| Param | Original file | Final file |
|---|---|---|
| Filename | modeM0/AS1A14_004T05_9000006502_53551cztM0_level2.fits | modeM0/AS1A14_004T05_9000006502_53551cztM0_level2_quad_clean.evt |
| Size (bytes) | 879,903,360 | 130,489,920 |
| Size | 839.1 MB | 124.4 MB |
| Events in quadrant A | 9,405,073 | 790,946 |
| Events in quadrant B | 4,994,762 | 964,312 |
| Events in quadrant C | 10,126,655 | 728,181 |
| Events in quadrant D | 7,288,911 | 790,693 |
| Mode M9 | |||
|---|---|---|---|
| Quadrant | BADHDUFLAG | Total packets | Discarded packets |
| A | 0 | 4 | 0 |
| B | 0 | 4 | 0 |
| C | 0 | 4 | 0 |
| D | 0 | 4 | 0 |
| Mode SS | |||
|---|---|---|---|
| Quadrant | BADHDUFLAG | Total packets | Discarded packets |
| A | 0 | 196 | 0 |
| B | 0 | 196 | 0 |
| C | 0 | 196 | 0 |
| D | 0 | 196 | 0 |
| Mode M0 | |||
|---|---|---|---|
| Quadrant | BADHDUFLAG | Total packets | Discarded packets |
| A | 0 | 34745 | 1 |
| B | 0 | 22028 | 1 |
| C | 0 | 36960 | 1 |
| D | 0 | 28695 | 1 |
| Quadrant | Total seconds | Saturated seconds | Saturation percentage |
|---|---|---|---|
| A | 9762 | 1591 | 16.297890% |
| B | 9763 | 228 | 2.335348% |
| C | 9763 | 1834 | 18.785209% |
| D | 9763 | 606 | 6.207108% |
Noise dominated data is calculated using 1-second bins in cleaned event files. If a bin has >2000 counts, and if more than 50% of those come from <1% of pixels, then it is considered to be noise-dominated and hence unusable.
| Quadrant | # 1 sec bins | Bins with >0 counts | Bins with >2000 counts | High rate bins dominated by noise | Noise dominated (total time) | Noise dominated (detector-on time) | Marked lightcurve |
|---|---|---|---|---|---|---|---|
| A | 10132 | 9763 | 1365 | 1365 | 13.47% | 13.98% | 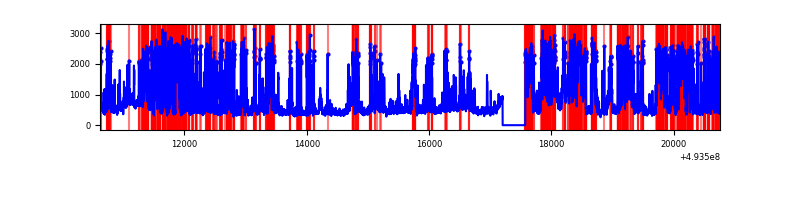 |
| B | 10133 | 9763 | 101 | 101 | 1.00% | 1.03% | 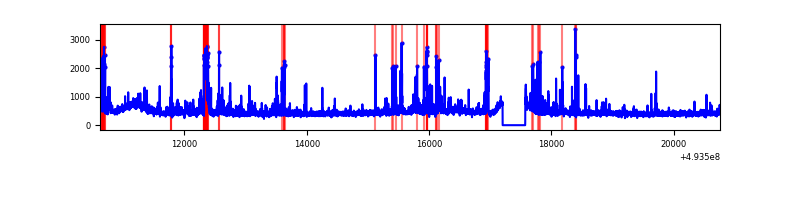 |
| C | 10133 | 9763 | 1551 | 1551 | 15.31% | 15.89% | 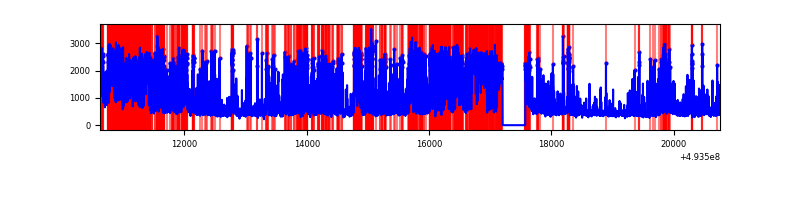 |
| D | 10133 | 9764 | 580 | 580 | 5.72% | 5.94% | 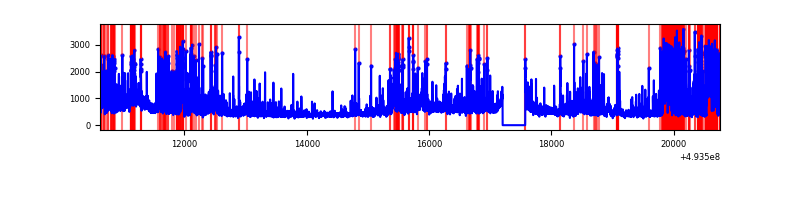 |
Top three noisy pixels from each quadrant. If the there are fewer than three noisy pixels in the level2.evt file, extra rows are filled as -1
| Pixel properties | Quadrant properties | ||||||
|---|---|---|---|---|---|---|---|
| Quadrant | DetID | PixID | Counts | Sigma | Mean | Median | Sigma |
| A | 3 | 63 | 3335080 | 13482.93 | 991 | 966 | 247.3 |
| A | 15 | 174 | 779115 | 3146.78 | 991 | 966 | 247.3 |
| A | 12 | 115 | 560653 | 2263.34 | 991 | 966 | 247.3 |
| B | 10 | 254 | 143964 | 646.95 | 1043 | 1006 | 221.0 |
| B | 2 | 249 | 124000 | 556.6 | 1043 | 1006 | 221.0 |
| B | 5 | 185 | 111605 | 500.51 | 1043 | 1006 | 221.0 |
| C | 15 | 224 | 4696837 | 18245.45 | 932 | 922 | 257.4 |
| C | 15 | 147 | 561808 | 2179.26 | 932 | 922 | 257.4 |
| C | 6 | 226 | 253107 | 979.84 | 932 | 922 | 257.4 |
| D | 15 | 94 | 1082260 | 3760.7 | 1004 | 958 | 287.5 |
| D | 13 | 153 | 404721 | 1404.26 | 1004 | 958 | 287.5 |
| D | 3 | 12 | 290840 | 1008.19 | 1004 | 958 | 287.5 |
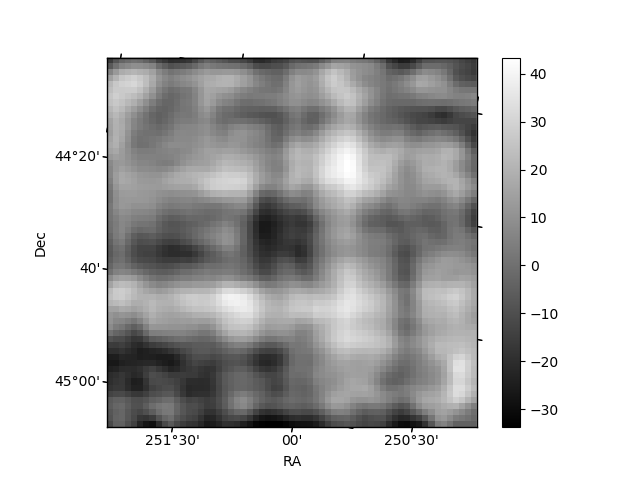
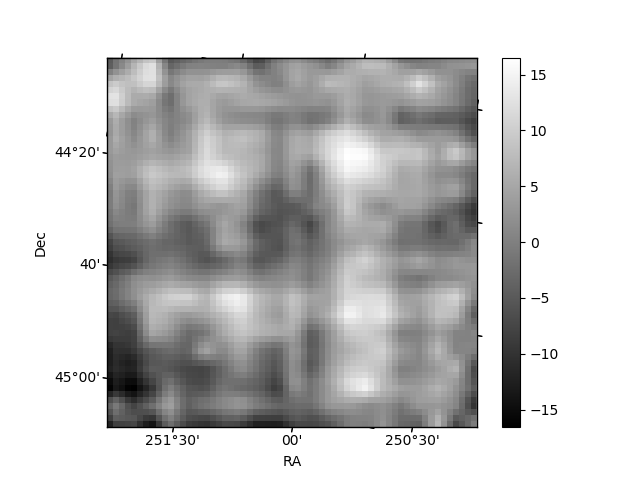
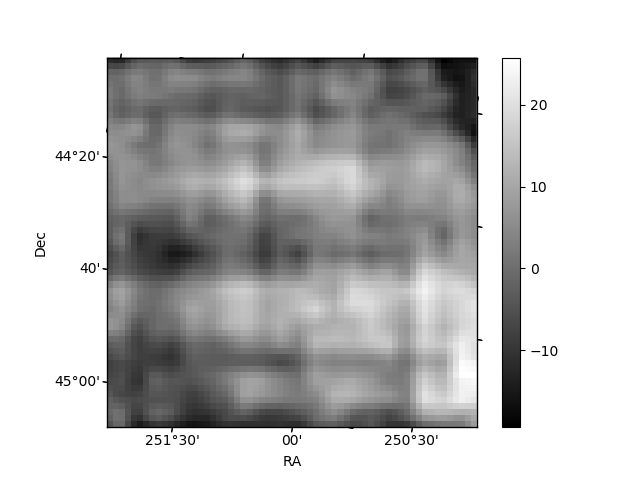
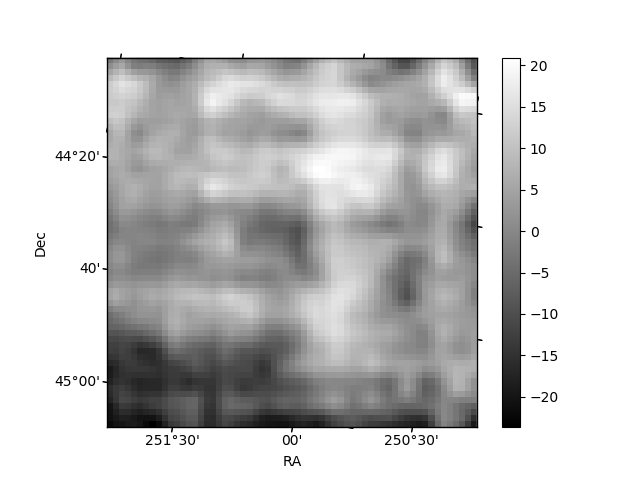
Histogram calculated using DETX and DETY for each event in the final _common_clean file
| Quadrant A | 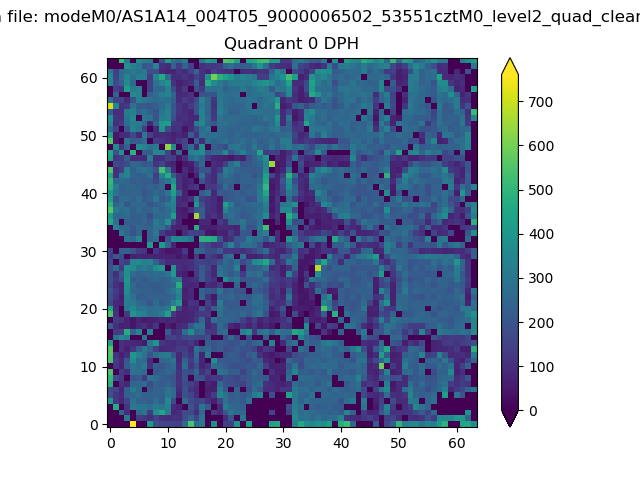 |
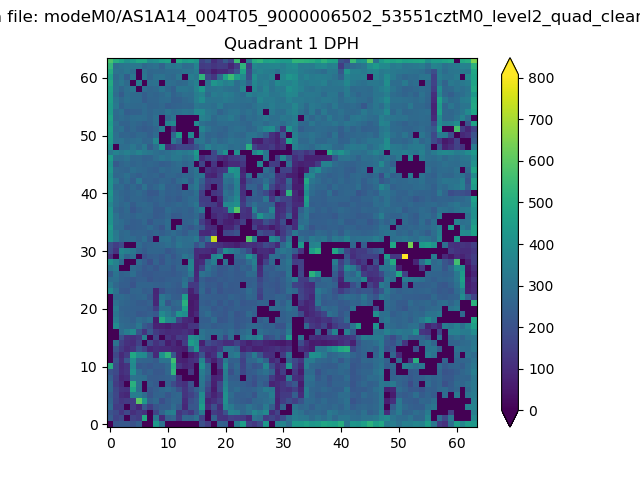 |
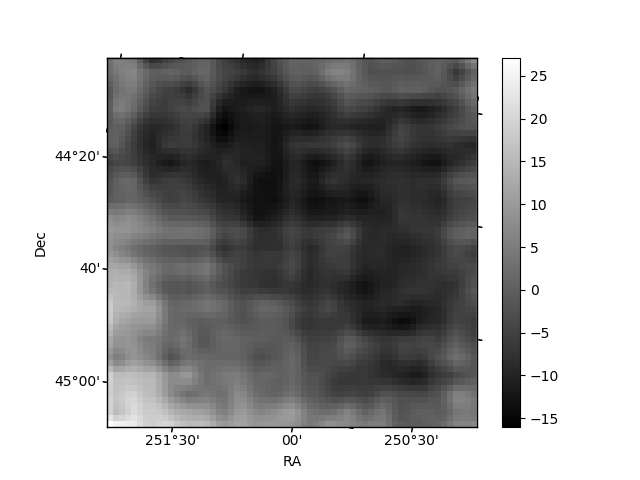
Quadrant B |
|---|---|---|---|
| Quadrant D | 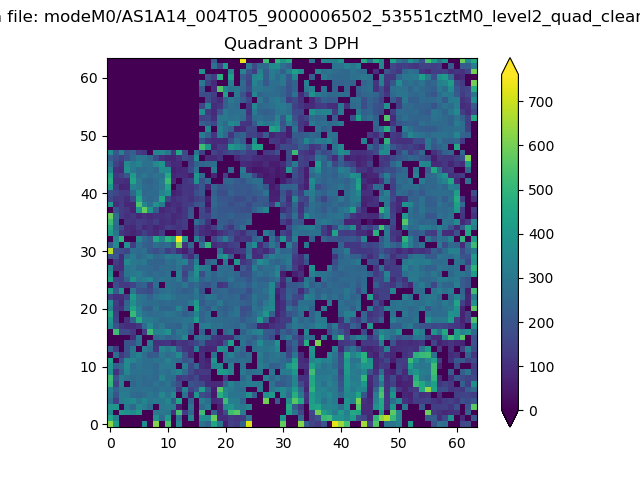 |
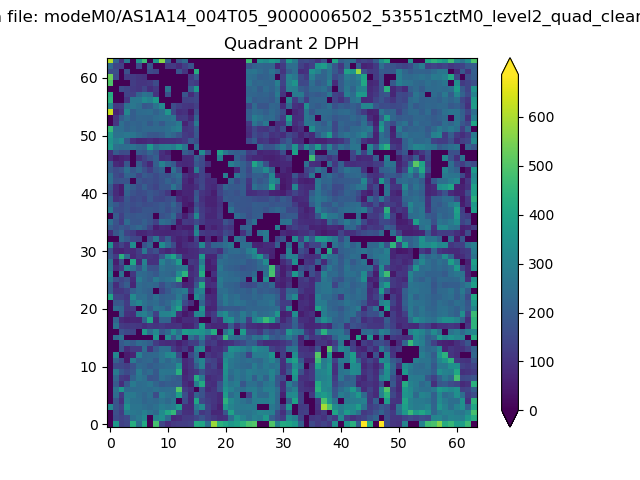 |
Quadrant C |
| Plot type | Count rate plots | Images |
|---|---|---|
| Comparison with Poisson distribution Blue bars denote a histogram of data divided into 1 sec bins. Red curve is a Poisson curve with rate = median count rate of data. |
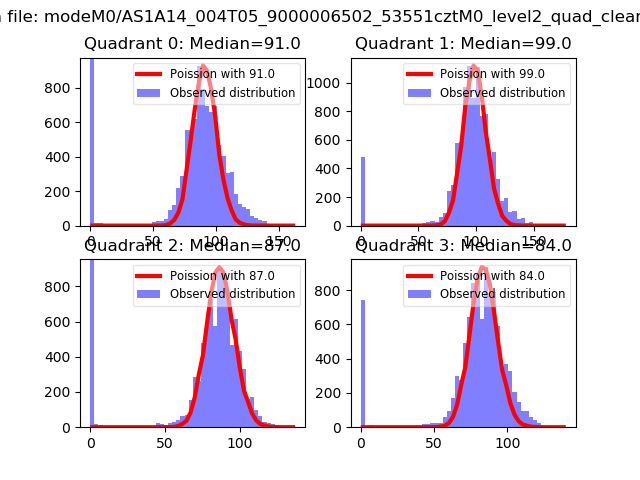 |
 |
| Quadrant-wise count rates Data is divided into 100 sec bins |
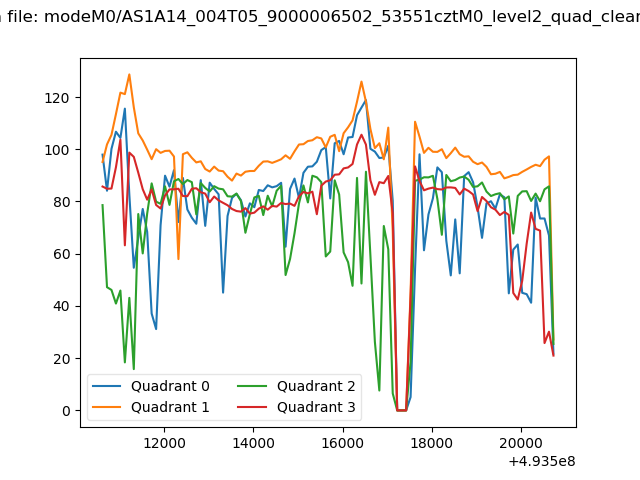 |
|
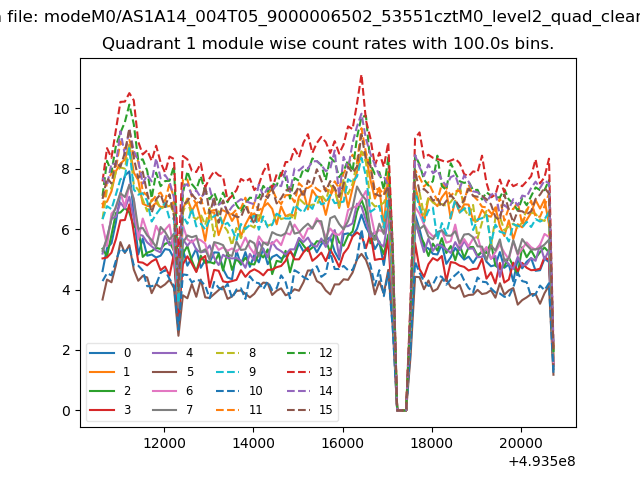
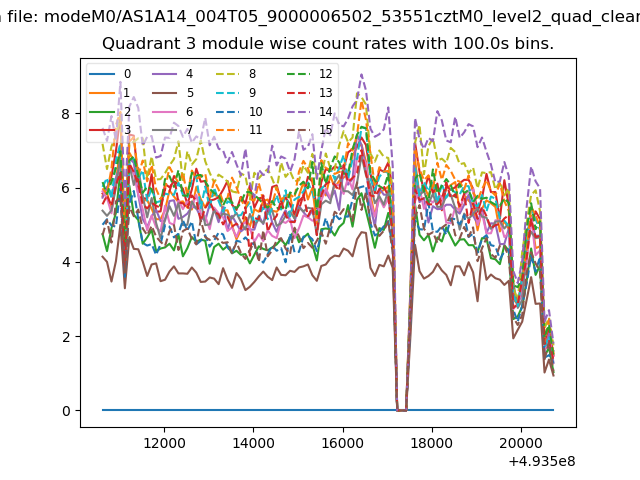
| Module-wise count rates for Quadrant A Data is divided into 100 sec bins |
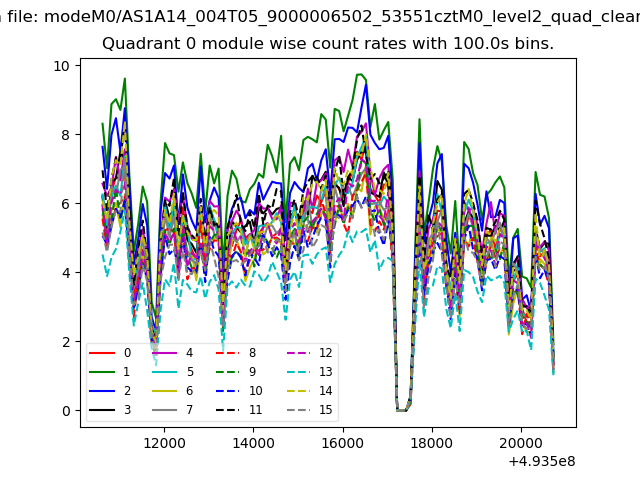 |
 |
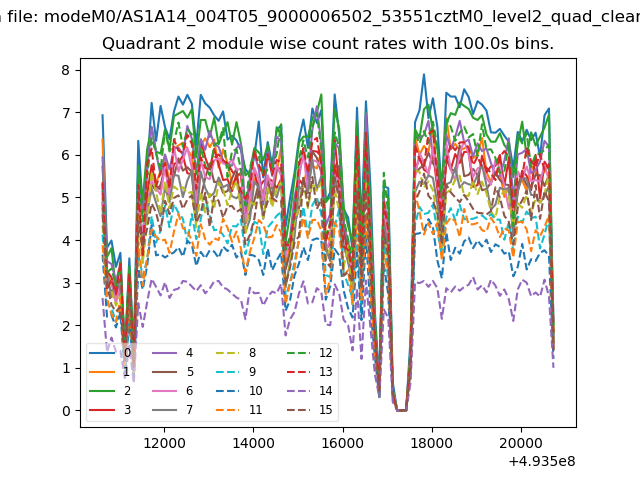
| Module-wise count rates for Quadrant B Data is divided into 100 sec bins |
 |
 |
| Module-wise count rates for Quadrant C Data is divided into 100 sec bins |
 |
 |
| Module-wise count rates for Quadrant D Data is divided into 100 sec bins |
 |
 |
| Parameter | Plot |
|---|---|
| CZT HV Monitor | 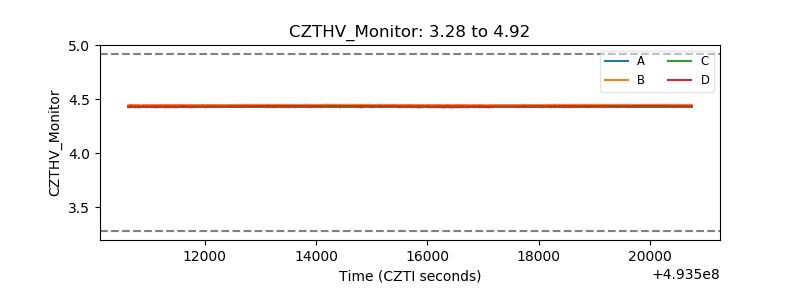 |
| D_VDD | 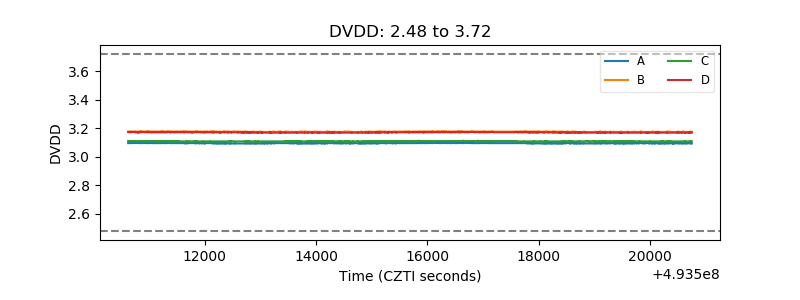 |
| Temperature 1 | 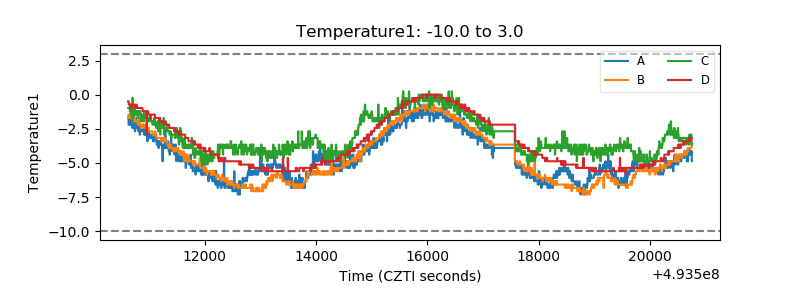 |
| Veto HV Monitor | 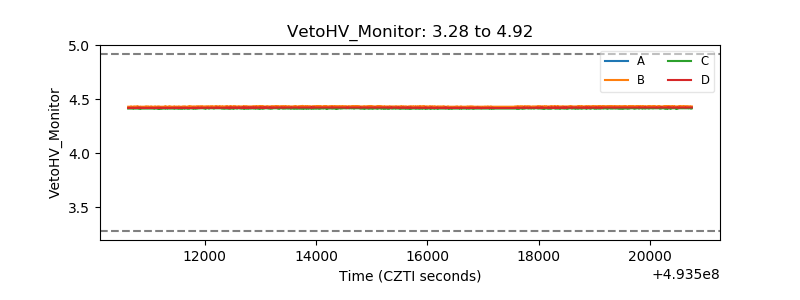 |
| Veto LLD | 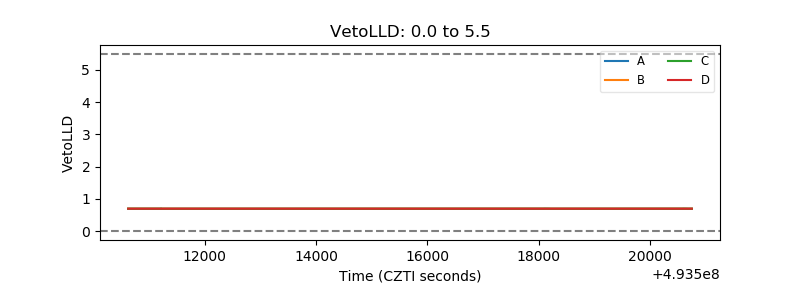 |
| Alpha Counter | 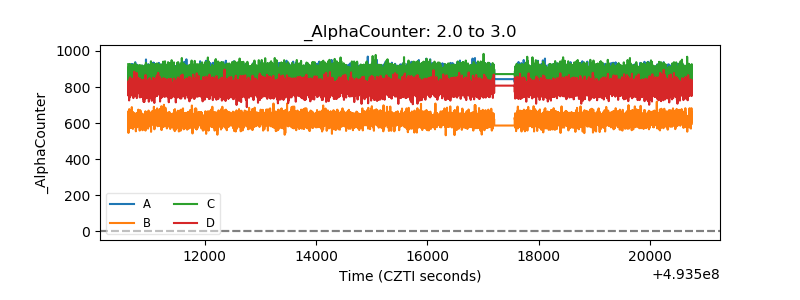 |
| _CPM_Rate | 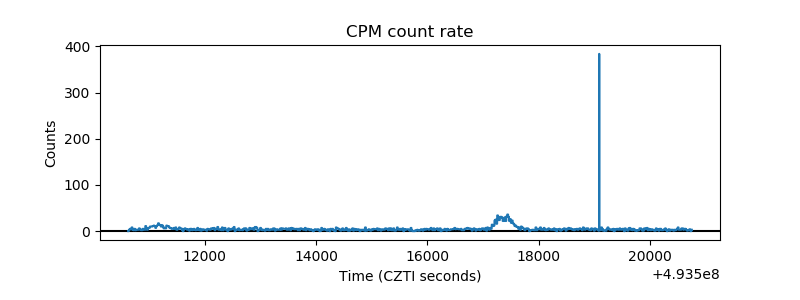 |
| CZT Counter | 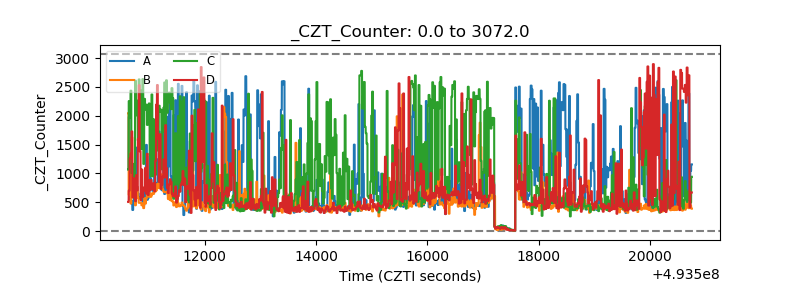 |
| +2.5 Volts monitor | 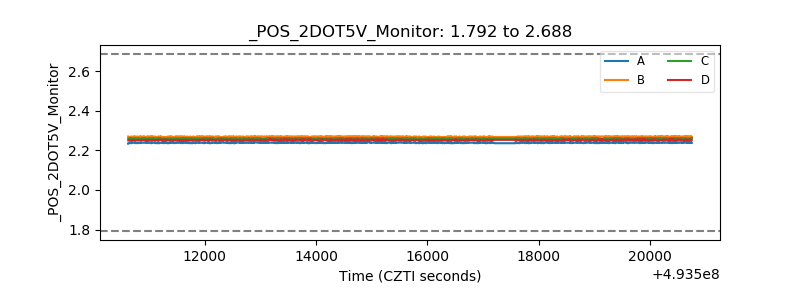 |
| +5 Volts monitor | 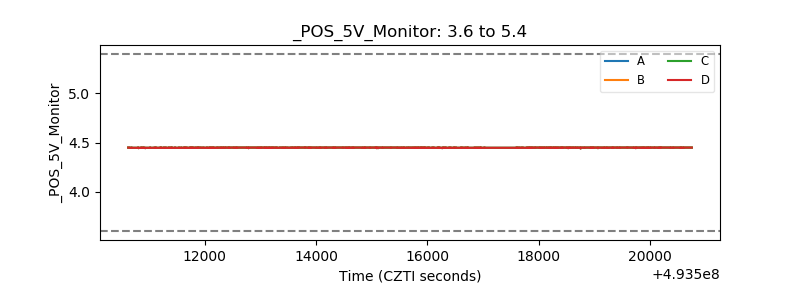 |
| _ROLL_ROT |  |
| _Roll_DEC | 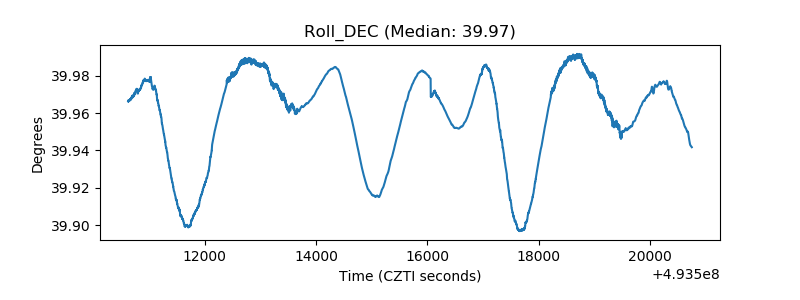 |
| _Roll_RA | 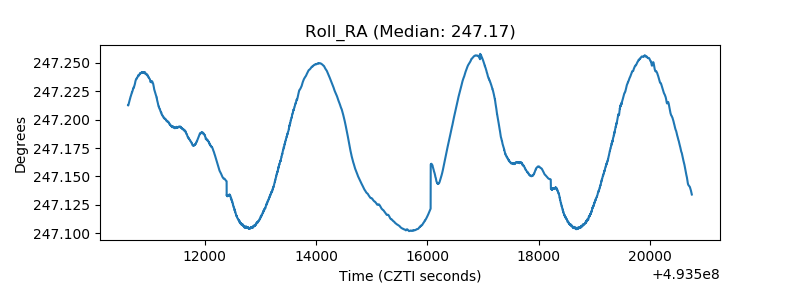 |
| Veto Counter | 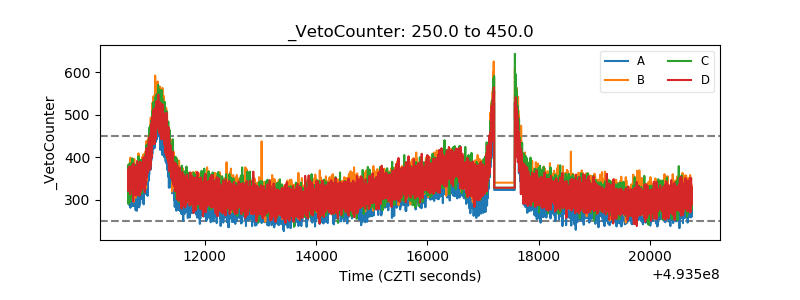 |