| Param | Original file | Final file |
|---|---|---|
| Filename | modeM0/AS1A14_004T05_9000006502_53552cztM0_level2.fits | modeM0/AS1A14_004T05_9000006502_53552cztM0_level2_quad_clean.evt |
| Size (bytes) | 917,717,760 | 137,520,000 |
| Size | 875.2 MB | 131.1 MB |
| Events in quadrant A | 10,077,455 | 810,984 |
| Events in quadrant B | 6,179,523 | 999,890 |
| Events in quadrant C | 9,234,135 | 827,781 |
| Events in quadrant D | 7,694,486 | 822,096 |
| Mode M9 | |||
|---|---|---|---|
| Quadrant | BADHDUFLAG | Total packets | Discarded packets |
| A | 0 | 15 | 0 |
| B | 0 | 15 | 0 |
| C | 0 | 15 | 0 |
| D | 0 | 15 | 0 |
| Mode SS | |||
|---|---|---|---|
| Quadrant | BADHDUFLAG | Total packets | Discarded packets |
| A | 0 | 206 | 0 |
| B | 0 | 206 | 0 |
| C | 0 | 206 | 0 |
| D | 0 | 206 | 0 |
| Mode M0 | |||
|---|---|---|---|
| Quadrant | BADHDUFLAG | Total packets | Discarded packets |
| A | 0 | 36960 | 2 |
| B | 0 | 25354 | 2 |
| C | 0 | 34466 | 2 |
| D | 0 | 29951 | 3 |
| Quadrant | Total seconds | Saturated seconds | Saturation percentage |
|---|---|---|---|
| A | 10146 | 1892 | 18.647743% |
| B | 10146 | 450 | 4.435245% |
| C | 10146 | 1177 | 11.600631% |
| D | 10145 | 719 | 7.087235% |
Noise dominated data is calculated using 1-second bins in cleaned event files. If a bin has >2000 counts, and if more than 50% of those come from <1% of pixels, then it is considered to be noise-dominated and hence unusable.
| Quadrant | # 1 sec bins | Bins with >0 counts | Bins with >2000 counts | High rate bins dominated by noise | Noise dominated (total time) | Noise dominated (detector-on time) | Marked lightcurve |
|---|---|---|---|---|---|---|---|
| A | 11546 | 10146 | 1609 | 1609 | 13.94% | 15.86% | 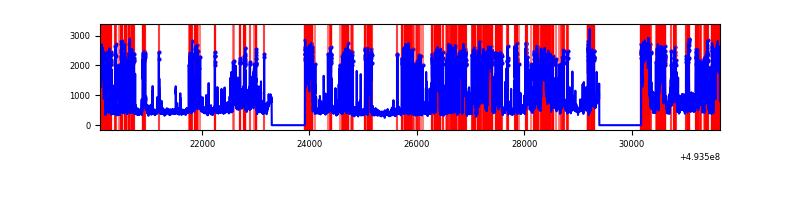 |
| B | 11546 | 10146 | 279 | 279 | 2.42% | 2.75% | 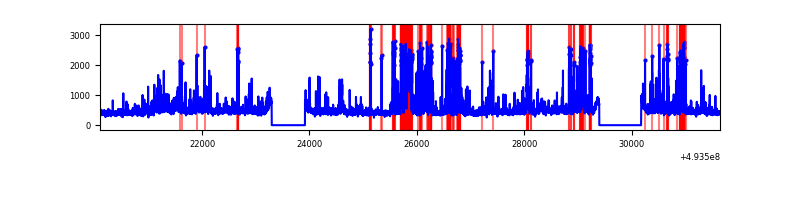 |
| C | 11546 | 10146 | 1039 | 1039 | 9.00% | 10.24% | 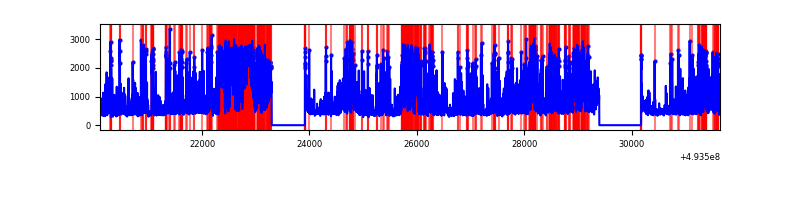 |
| D | 11545 | 10145 | 671 | 671 | 5.81% | 6.61% | 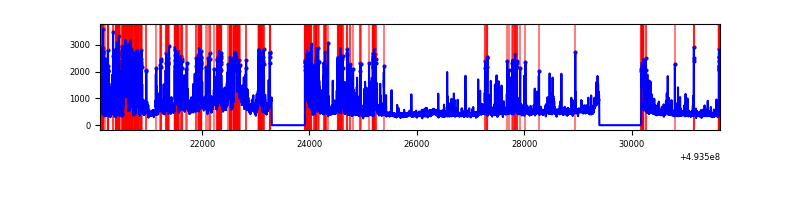 |
Top three noisy pixels from each quadrant. If the there are fewer than three noisy pixels in the level2.evt file, extra rows are filled as -1
| Pixel properties | Quadrant properties | ||||||
|---|---|---|---|---|---|---|---|
| Quadrant | DetID | PixID | Counts | Sigma | Mean | Median | Sigma |
| A | 3 | 63 | 4056731 | 16265.83 | 1019 | 993 | 249.3 |
| A | 12 | 115 | 1136596 | 4554.42 | 1019 | 993 | 249.3 |
| A | 15 | 174 | 663161 | 2655.67 | 1019 | 993 | 249.3 |
| B | 2 | 249 | 1289001 | 5581.35 | 1082 | 1044 | 230.8 |
| B | 2 | 136 | 127236 | 546.85 | 1082 | 1044 | 230.8 |
| B | 0 | 213 | 124808 | 536.33 | 1082 | 1044 | 230.8 |
| C | 15 | 224 | 3865174 | 13942.88 | 1019 | 1014 | 277.1 |
| C | 1 | 241 | 620896 | 2236.69 | 1019 | 1014 | 277.1 |
| C | 4 | 5 | 218234 | 783.79 | 1019 | 1014 | 277.1 |
| D | 15 | 94 | 763540 | 2538.23 | 1051 | 1005 | 300.4 |
| D | 4 | 7 | 716726 | 2382.41 | 1051 | 1005 | 300.4 |
| D | 3 | 12 | 485295 | 1612.05 | 1051 | 1005 | 300.4 |
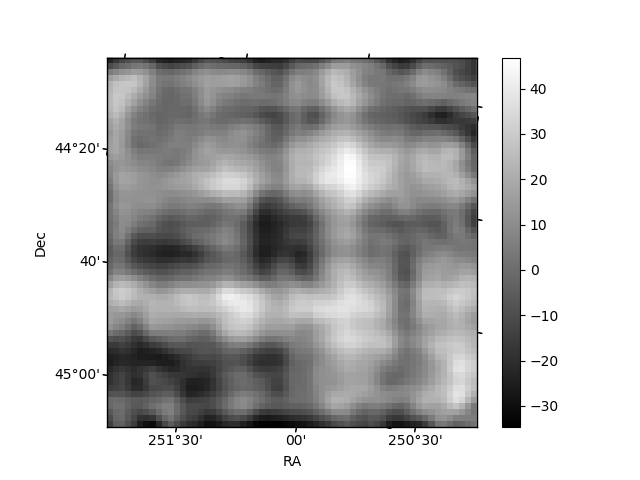
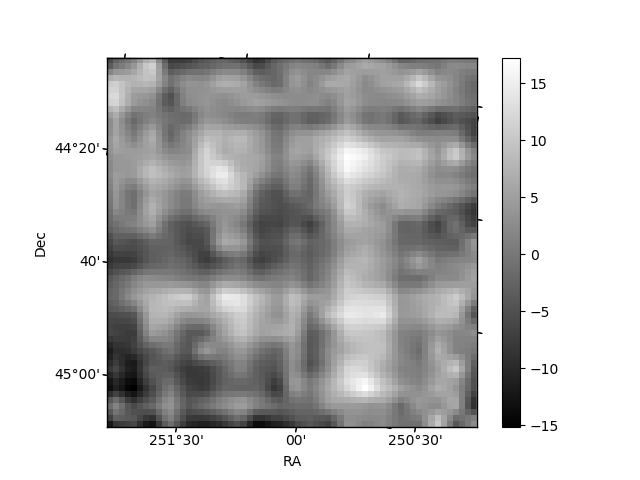
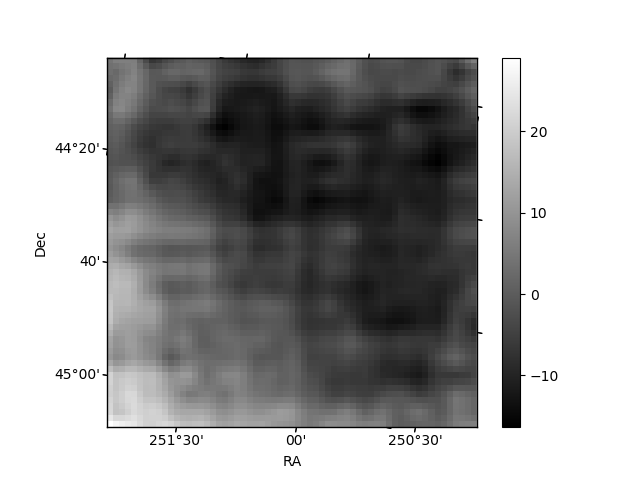
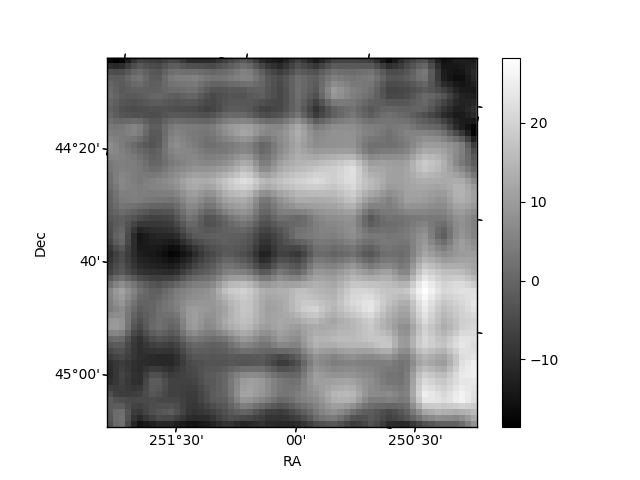
Histogram calculated using DETX and DETY for each event in the final _common_clean file
| Quadrant A | 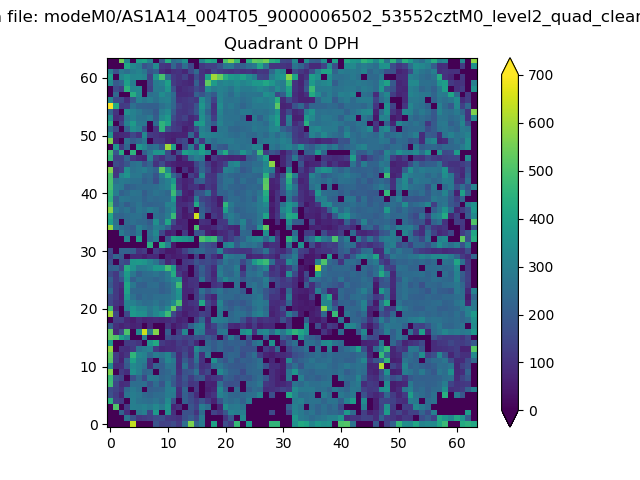 |
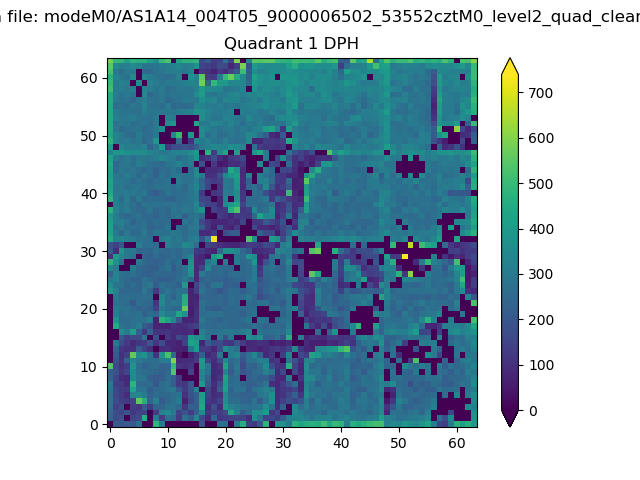 |
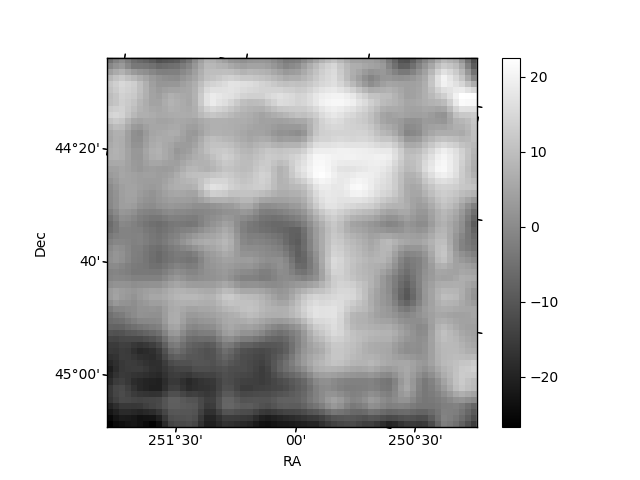
Quadrant B |
|---|---|---|---|
| Quadrant D | 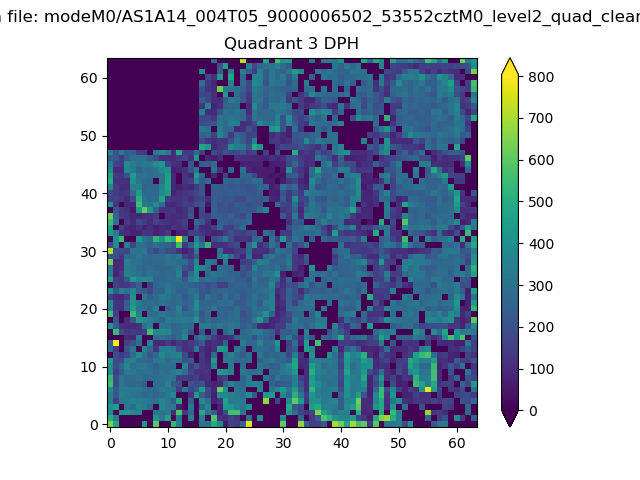 |
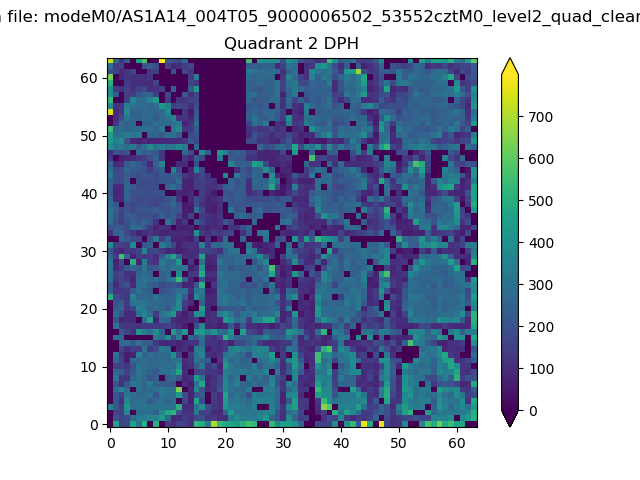 |
Quadrant C |
| Plot type | Count rate plots | Images |
|---|---|---|
| Comparison with Poisson distribution Blue bars denote a histogram of data divided into 1 sec bins. Red curve is a Poisson curve with rate = median count rate of data. |
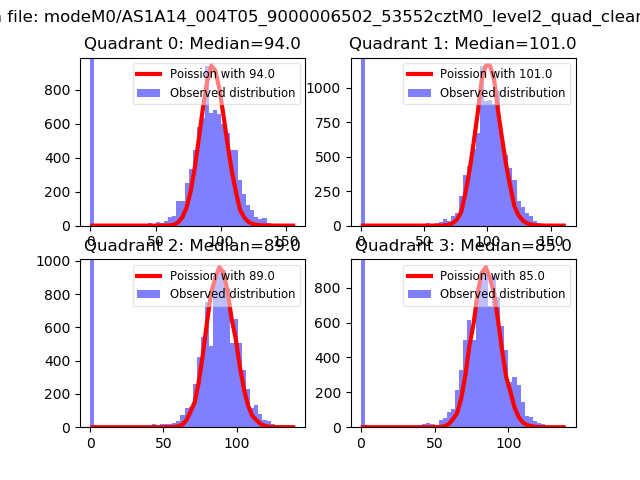 |
 |
| Quadrant-wise count rates Data is divided into 100 sec bins |
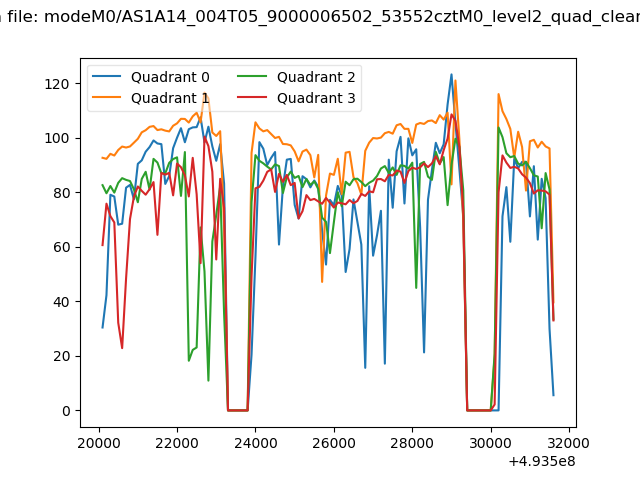 |
|
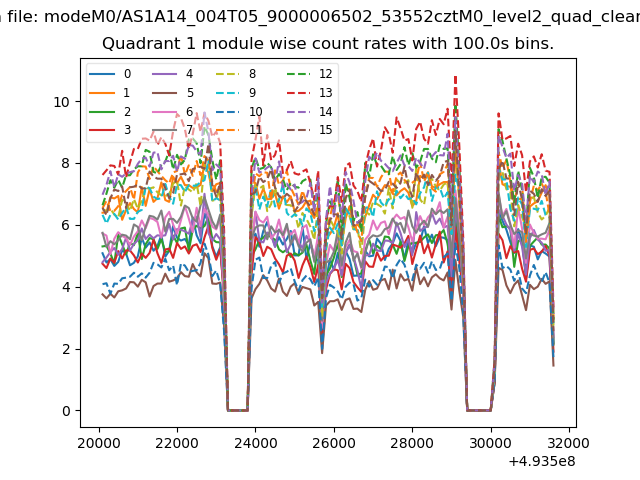
| Module-wise count rates for Quadrant A Data is divided into 100 sec bins |
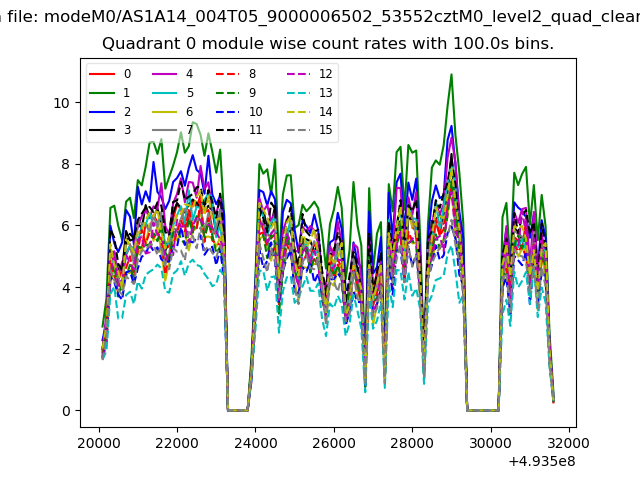 |
 |
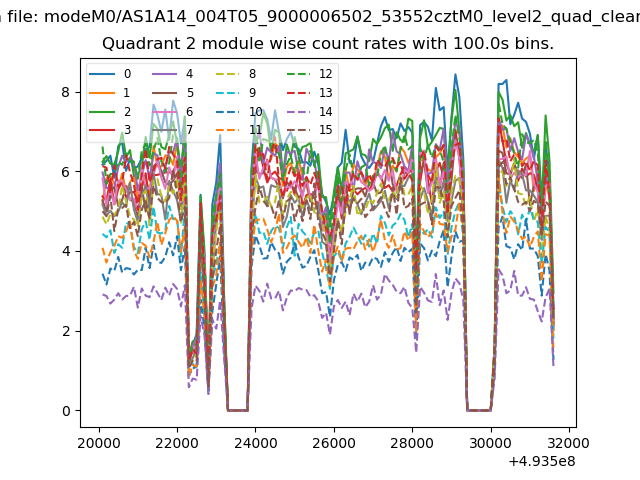
| Module-wise count rates for Quadrant B Data is divided into 100 sec bins |
 |
 |
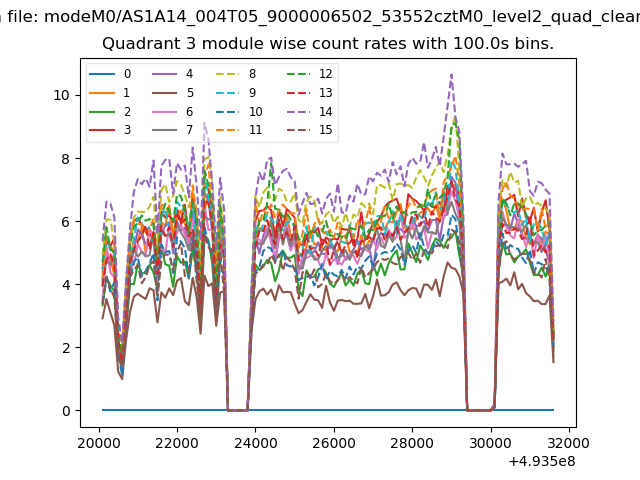
| Module-wise count rates for Quadrant C Data is divided into 100 sec bins |
 |
 |
| Module-wise count rates for Quadrant D Data is divided into 100 sec bins |
 |
 |
| Parameter | Plot |
|---|---|
| CZT HV Monitor | 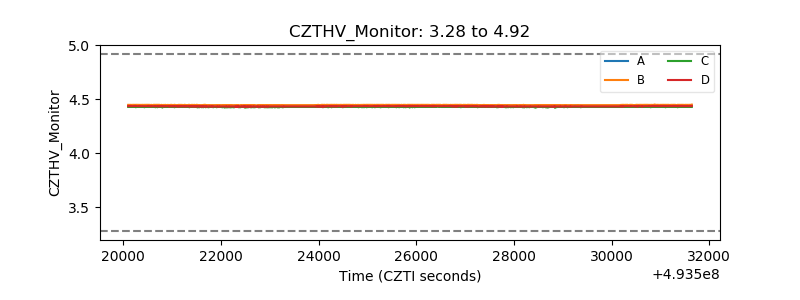 |
| D_VDD | 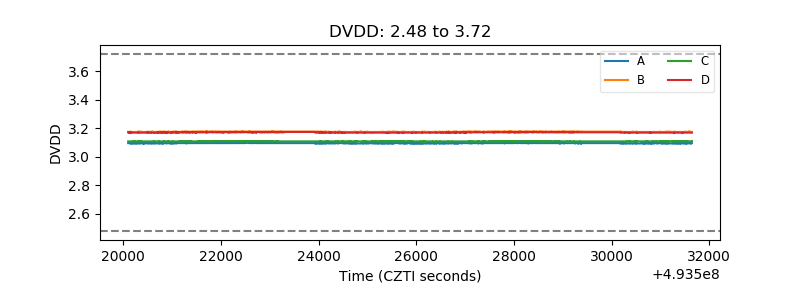 |
| Temperature 1 | 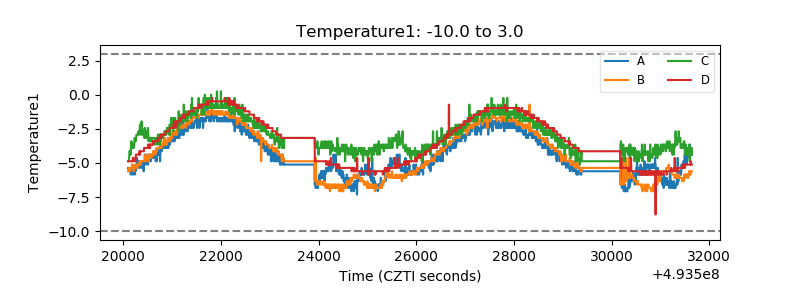 |
| Veto HV Monitor | 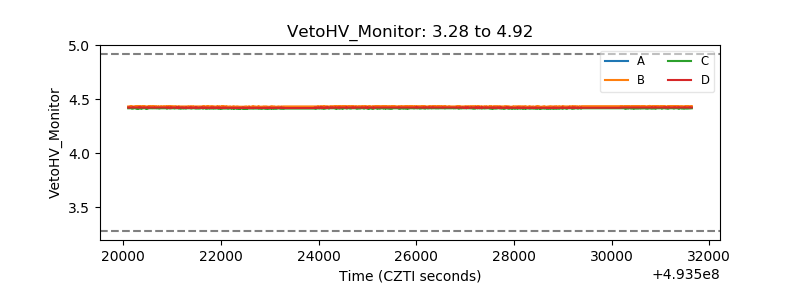 |
| Veto LLD | 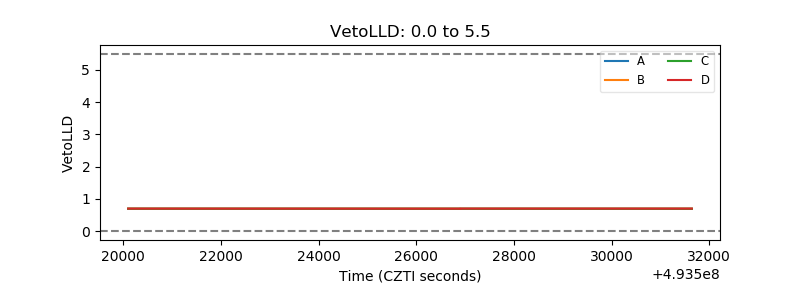 |
| Alpha Counter | 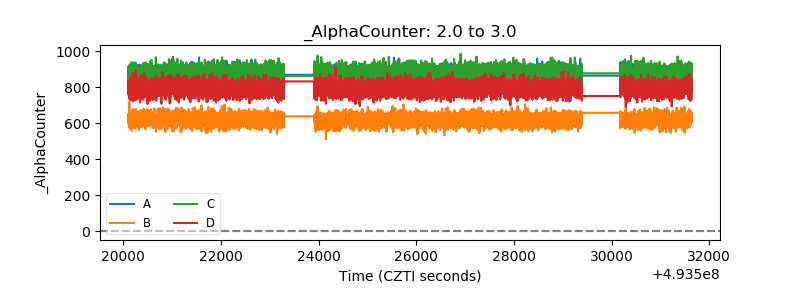 |
| _CPM_Rate | 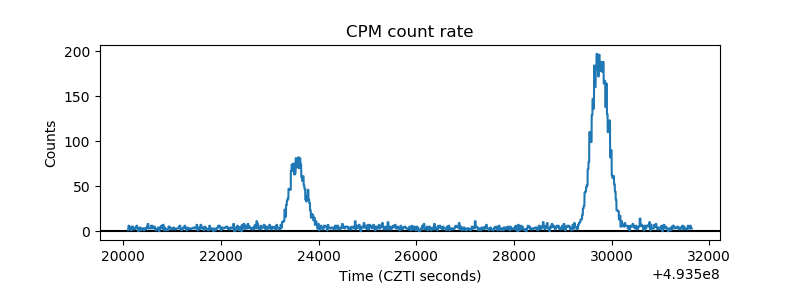 |
| CZT Counter | 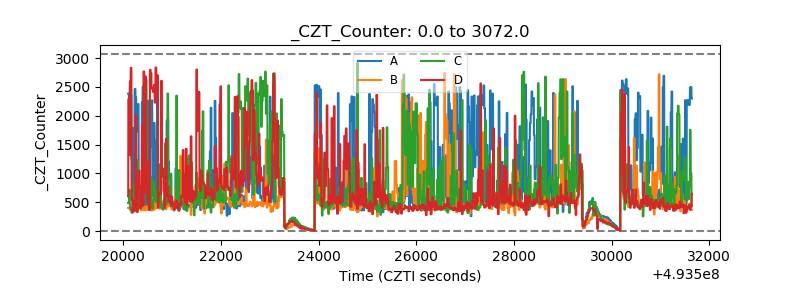 |
| +2.5 Volts monitor |  |
| +5 Volts monitor |  |
| _ROLL_ROT | 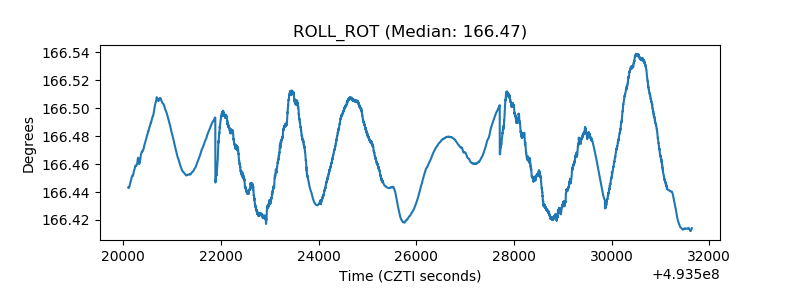 |
| _Roll_DEC | 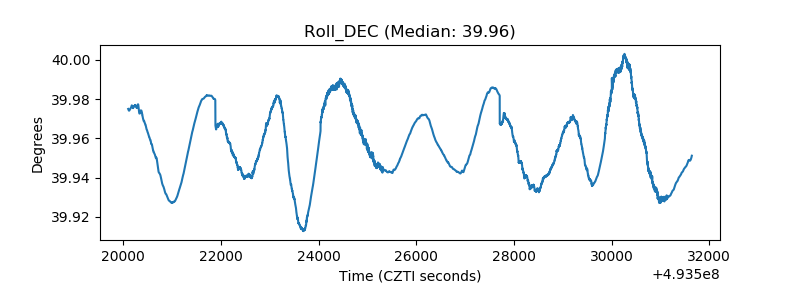 |
| _Roll_RA | 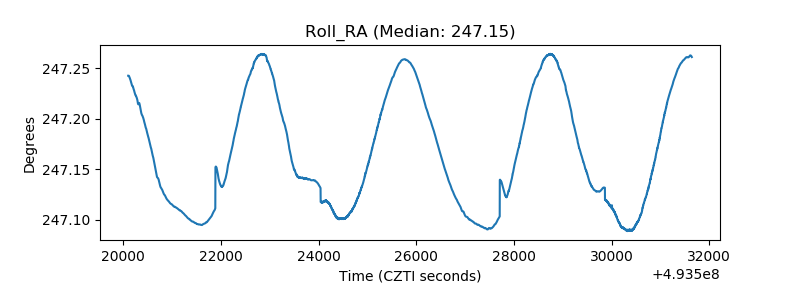 |
| Veto Counter | 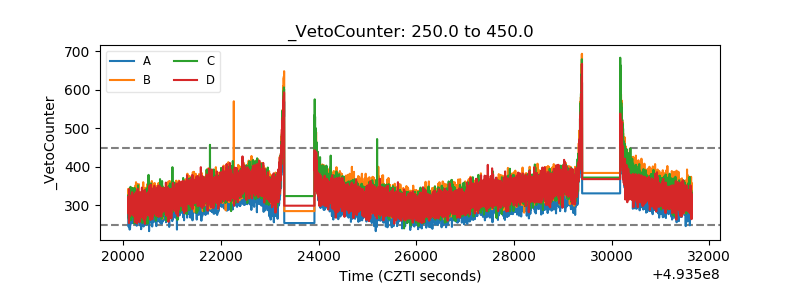 |