| Param | Original file | Final file |
|---|---|---|
| Filename | modeM0/AS1A14_004T05_9000006502_53553cztM0_level2.fits | modeM0/AS1A14_004T05_9000006502_53553cztM0_level2_quad_clean.evt |
| Size (bytes) | 753,629,760 | 88,940,160 |
| Size | 718.7 MB | 84.8 MB |
| Events in quadrant A | 9,447,142 | 500,886 |
| Events in quadrant B | 3,994,721 | 685,594 |
| Events in quadrant C | 6,513,701 | 576,843 |
| Events in quadrant D | 7,420,933 | 459,961 |
| Mode M9 | |||
|---|---|---|---|
| Quadrant | BADHDUFLAG | Total packets | Discarded packets |
| A | 0 | 9 | 0 |
| B | 0 | 9 | 0 |
| C | 0 | 9 | 0 |
| D | 0 | 9 | 0 |
| Mode SS | |||
|---|---|---|---|
| Quadrant | BADHDUFLAG | Total packets | Discarded packets |
| A | 0 | 138 | 0 |
| B | 0 | 138 | 0 |
| C | 0 | 138 | 0 |
| D | 0 | 138 | 0 |
| Mode M0 | |||
|---|---|---|---|
| Quadrant | BADHDUFLAG | Total packets | Discarded packets |
| A | 0 | 32719 | 1 |
| B | 0 | 16428 | 1 |
| C | 0 | 24000 | 1 |
| D | 0 | 26883 | 1 |
| Quadrant | Total seconds | Saturated seconds | Saturation percentage |
|---|---|---|---|
| A | 6728 | 1880 | 27.942925% |
| B | 6728 | 217 | 3.225327% |
| C | 6728 | 742 | 11.028537% |
| D | 6728 | 1561 | 23.201546% |
Noise dominated data is calculated using 1-second bins in cleaned event files. If a bin has >2000 counts, and if more than 50% of those come from <1% of pixels, then it is considered to be noise-dominated and hence unusable.
| Quadrant | # 1 sec bins | Bins with >0 counts | Bins with >2000 counts | High rate bins dominated by noise | Noise dominated (total time) | Noise dominated (detector-on time) | Marked lightcurve |
|---|---|---|---|---|---|---|---|
| A | 7673 | 6728 | 1723 | 1723 | 22.46% | 25.61% | 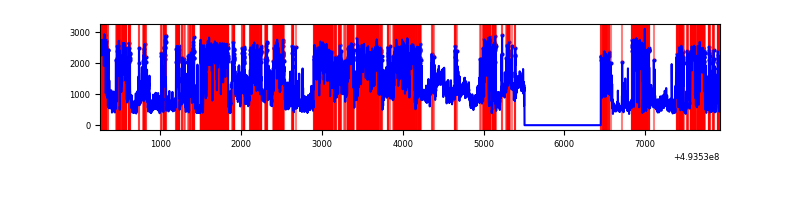 |
| B | 7673 | 6728 | 117 | 117 | 1.52% | 1.74% | 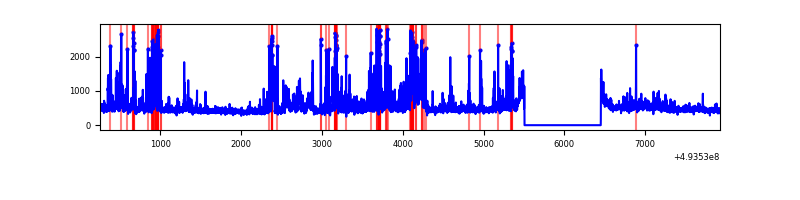 |
| C | 7673 | 6728 | 686 | 686 | 8.94% | 10.20% | 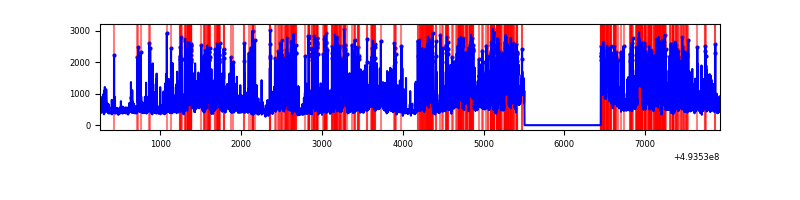 |
| D | 7673 | 6728 | 1514 | 1514 | 19.73% | 22.50% | 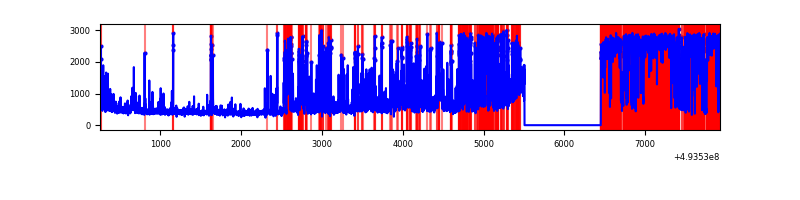 |
Top three noisy pixels from each quadrant. If the there are fewer than three noisy pixels in the level2.evt file, extra rows are filled as -1
| Pixel properties | Quadrant properties | ||||||
|---|---|---|---|---|---|---|---|
| Quadrant | DetID | PixID | Counts | Sigma | Mean | Median | Sigma |
| A | 12 | 115 | 3487582 | 20967.33 | 663 | 645 | 166.3 |
| A | 3 | 63 | 2260744 | 13590.22 | 663 | 645 | 166.3 |
| A | 15 | 174 | 746238 | 4483.33 | 663 | 645 | 166.3 |
| B | 2 | 249 | 548071 | 3525.85 | 725 | 700 | 155.2 |
| B | 5 | 185 | 109340 | 699.8 | 725 | 700 | 155.2 |
| B | 15 | 20 | 83351 | 532.39 | 725 | 700 | 155.2 |
| C | 15 | 224 | 1877601 | 9924.39 | 685 | 680 | 189.1 |
| C | 12 | 2 | 1086300 | 5740.32 | 685 | 680 | 189.1 |
| C | 4 | 5 | 233965 | 1233.52 | 685 | 680 | 189.1 |
| D | 15 | 94 | 3423743 | 19451.27 | 609 | 580 | 176.0 |
| D | 3 | 12 | 325012 | 1843.5 | 609 | 580 | 176.0 |
| D | 12 | 34 | 317241 | 1799.35 | 609 | 580 | 176.0 |
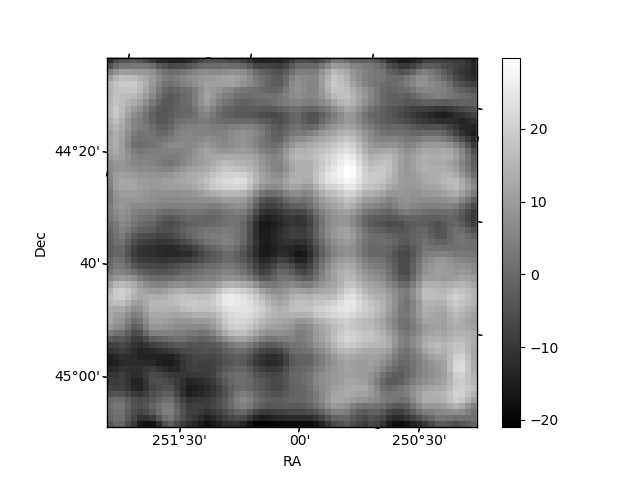
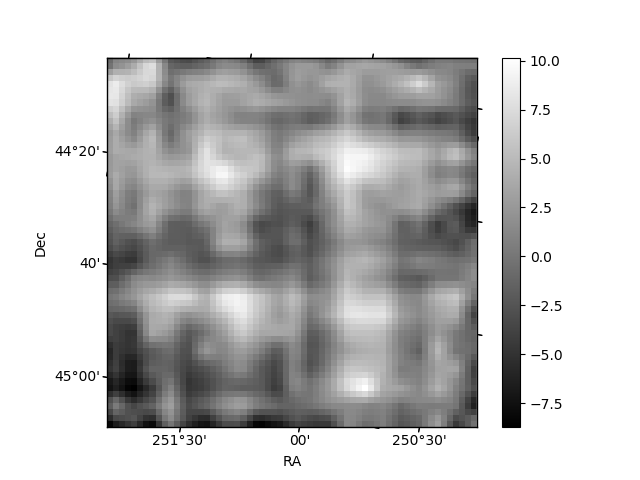
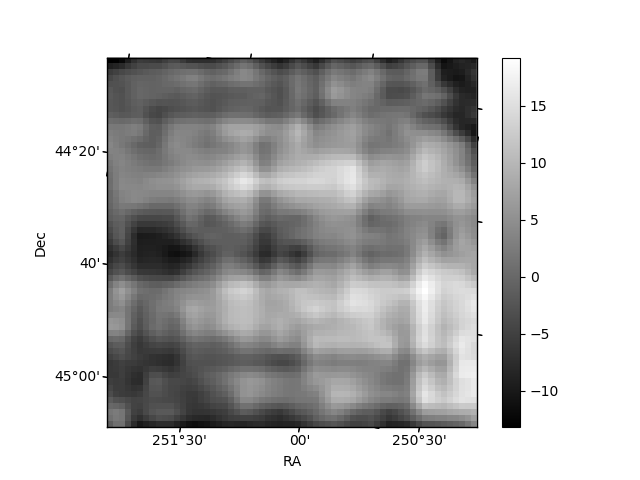
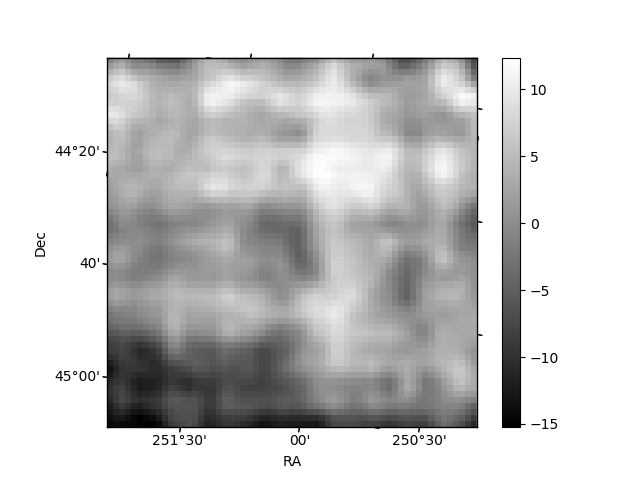
Histogram calculated using DETX and DETY for each event in the final _common_clean file
| Quadrant A | 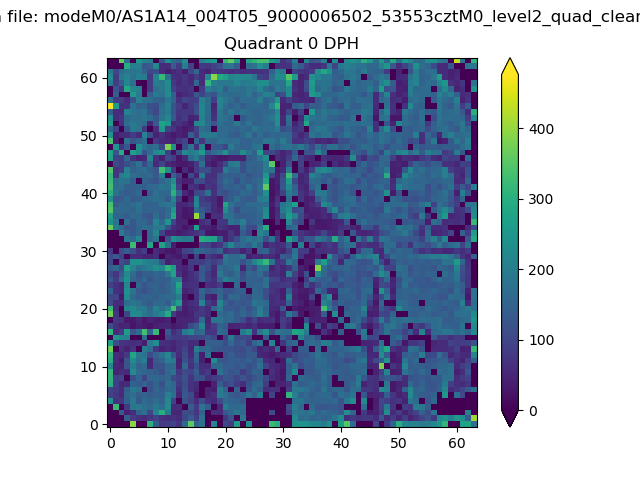 |
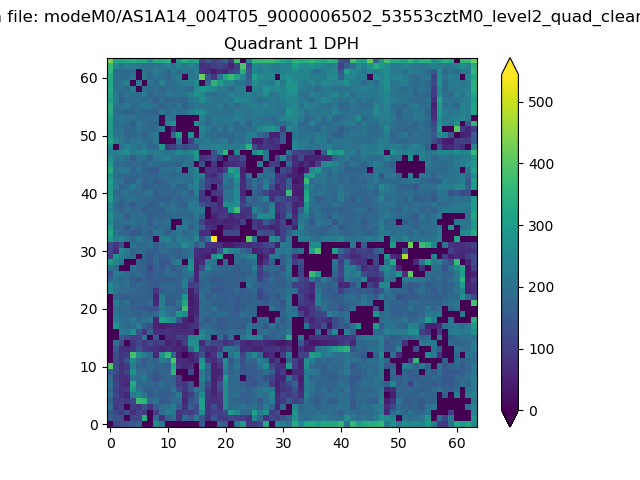 |
Quadrant B |
|---|---|---|---|
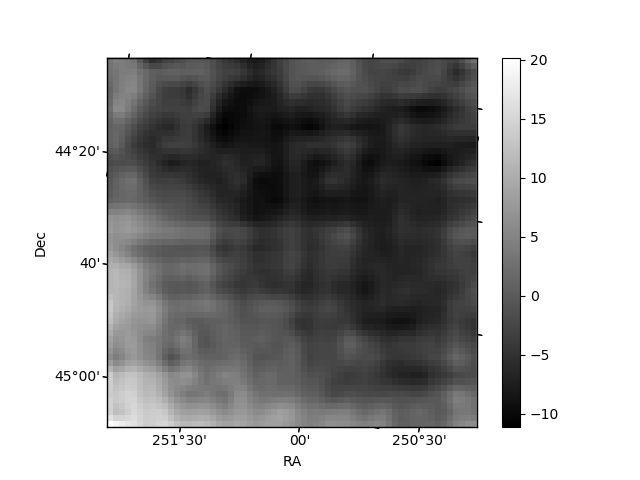
| Quadrant D | 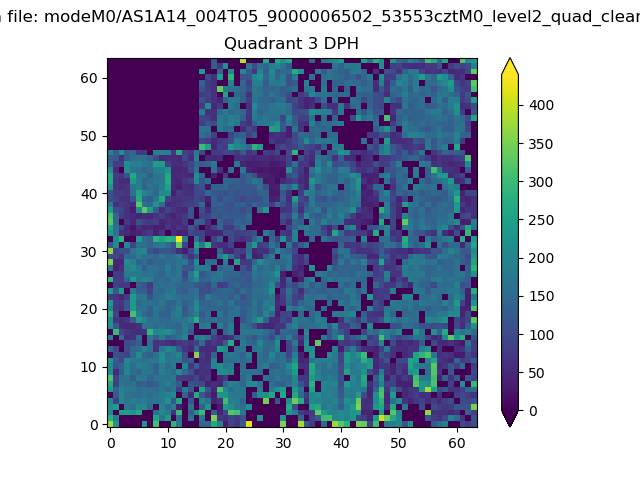 |
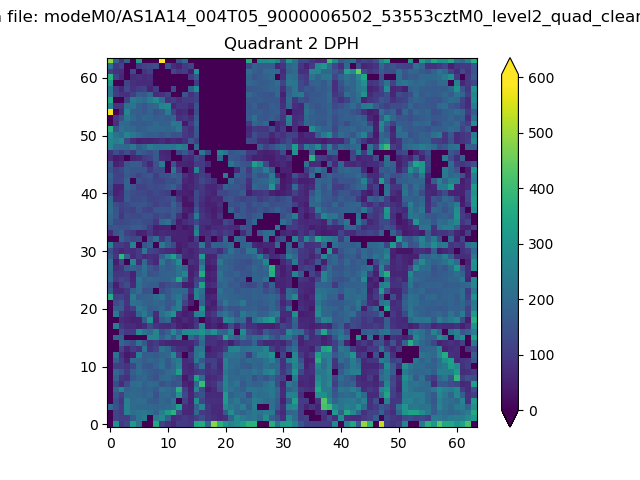 |
Quadrant C |
| Plot type | Count rate plots | Images |
|---|---|---|
| Comparison with Poisson distribution Blue bars denote a histogram of data divided into 1 sec bins. Red curve is a Poisson curve with rate = median count rate of data. |
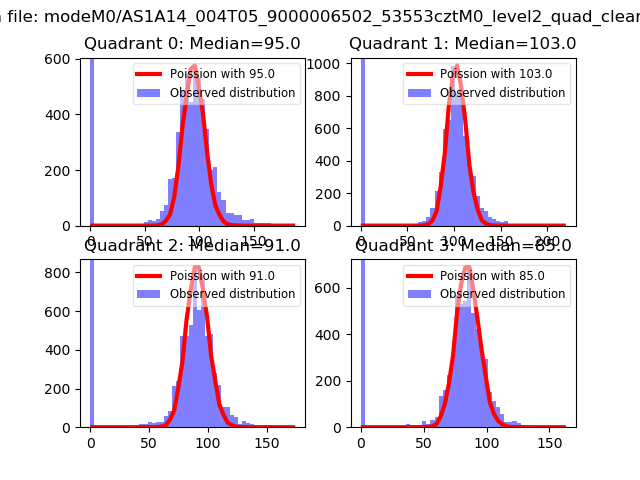 |
 |
| Quadrant-wise count rates Data is divided into 100 sec bins |
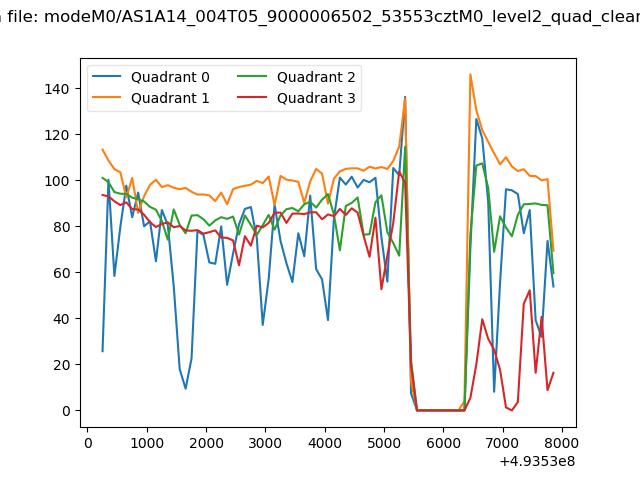 |
|
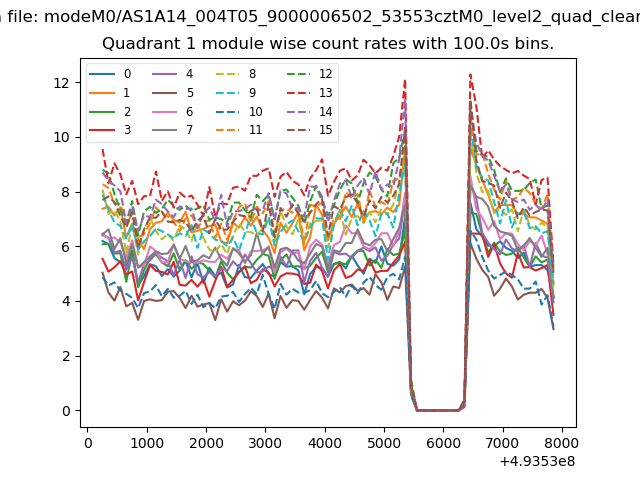
| Module-wise count rates for Quadrant A Data is divided into 100 sec bins |
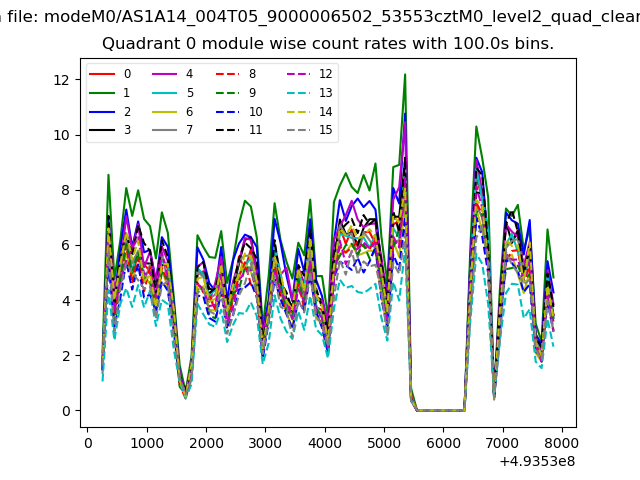 |
 |
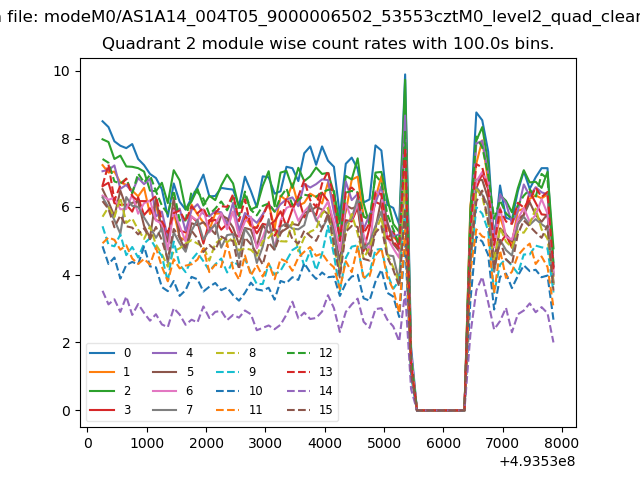
| Module-wise count rates for Quadrant B Data is divided into 100 sec bins |
 |
 |
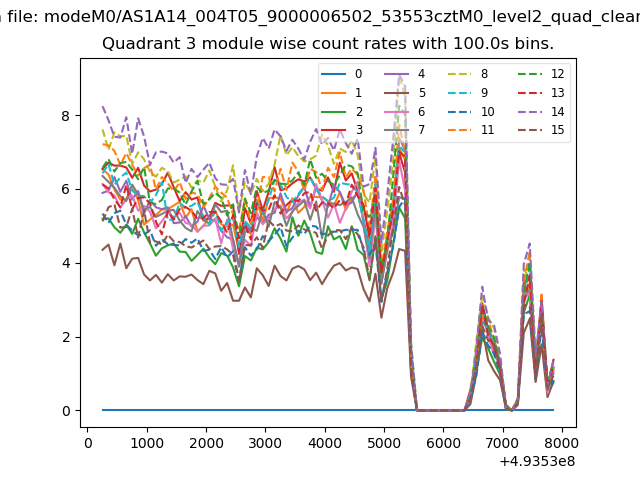
| Module-wise count rates for Quadrant C Data is divided into 100 sec bins |
 |
 |
| Module-wise count rates for Quadrant D Data is divided into 100 sec bins |
 |
 |
| Parameter | Plot |
|---|---|
| CZT HV Monitor | 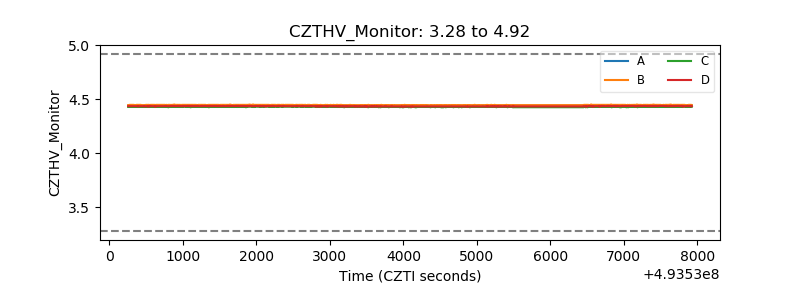 |
| D_VDD | 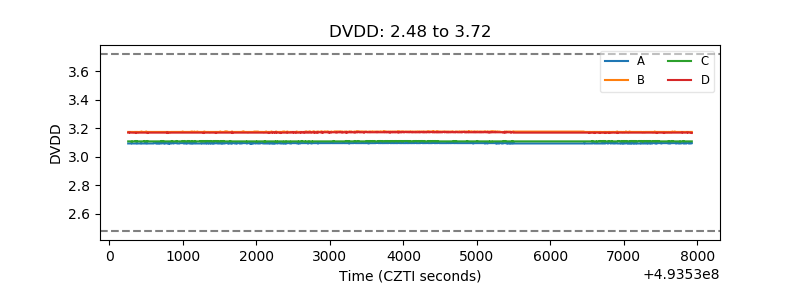 |
| Temperature 1 | 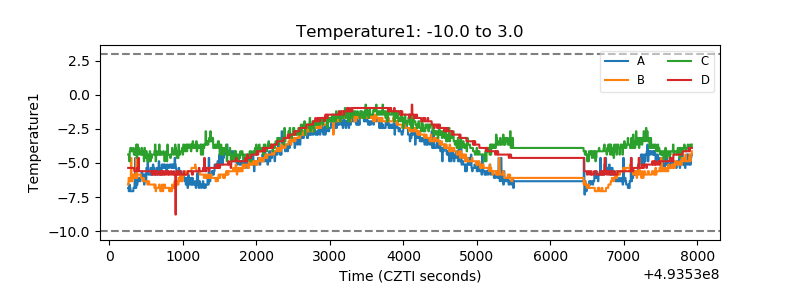 |
| Veto HV Monitor | 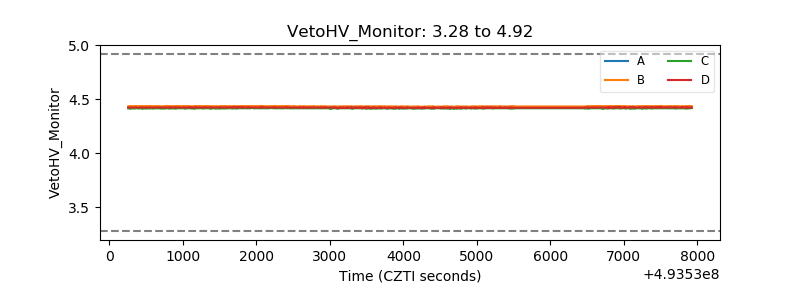 |
| Veto LLD | 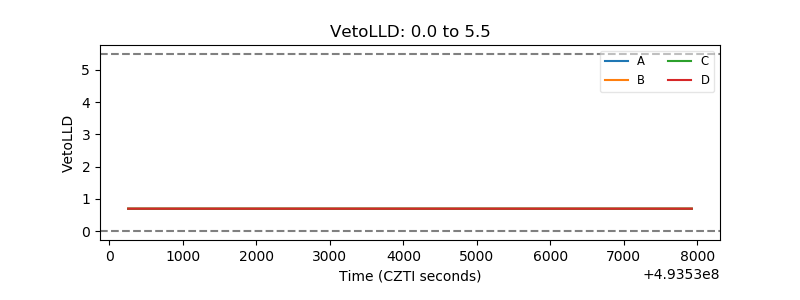 |
| Alpha Counter | 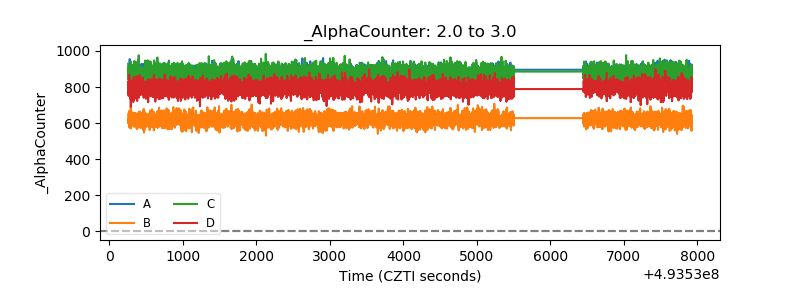 |
| _CPM_Rate | 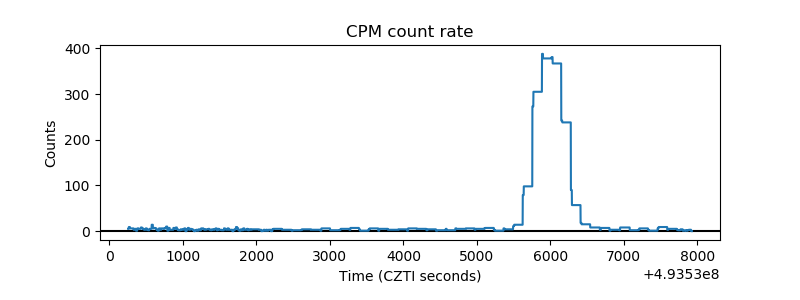 |
| CZT Counter | 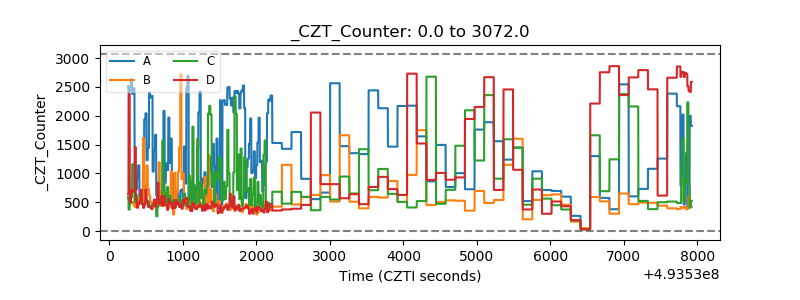 |
| +2.5 Volts monitor |  |
| +5 Volts monitor |  |
| _ROLL_ROT | 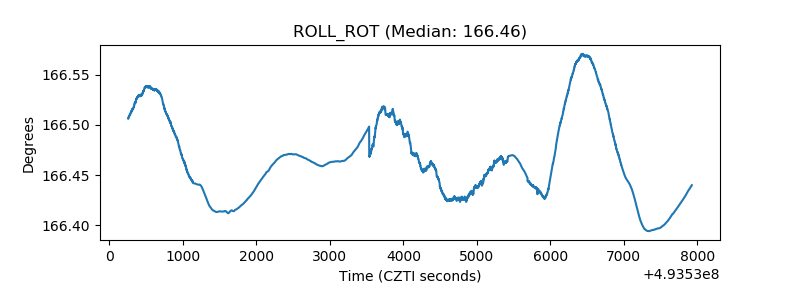 |
| _Roll_DEC | 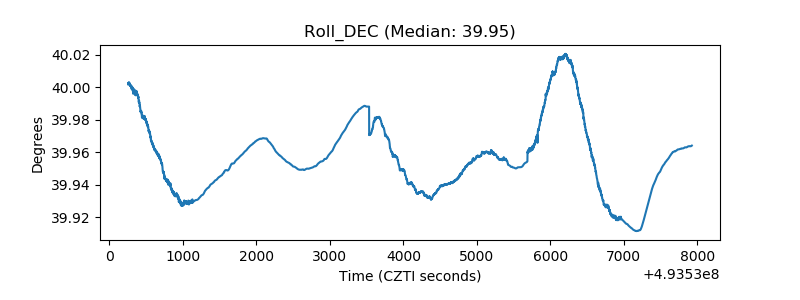 |
| _Roll_RA | 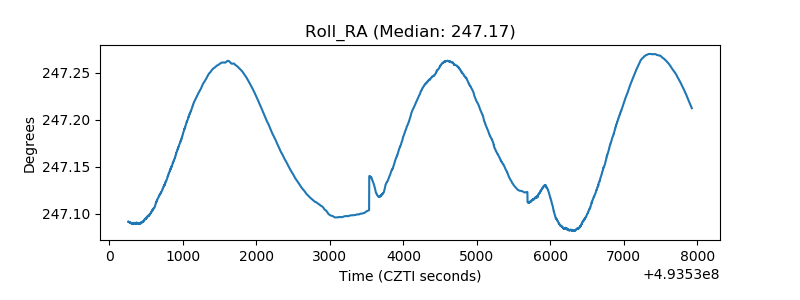 |
| Veto Counter | 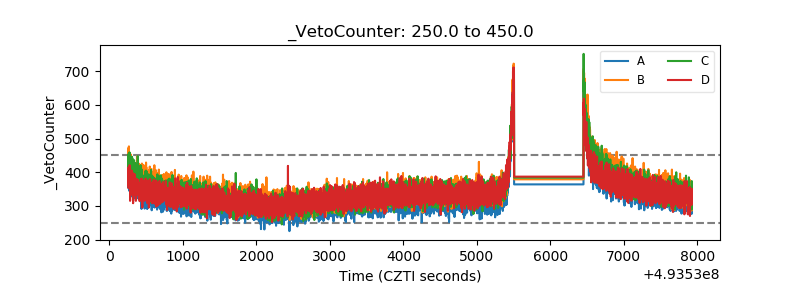 |