| Param | Original file | Final file |
|---|---|---|
| Filename | modeM0/AS1A14_004T05_9000006502_53555cztM0_level2.fits | modeM0/AS1A14_004T05_9000006502_53555cztM0_level2_quad_clean.evt |
| Size (bytes) | 838,117,440 | 75,732,480 |
| Size | 799.3 MB | 72.2 MB |
| Events in quadrant A | 9,338,626 | 372,937 |
| Events in quadrant B | 4,267,550 | 651,367 |
| Events in quadrant C | 6,057,497 | 546,404 |
| Events in quadrant D | 10,875,624 | 284,399 |
| Mode M9 | |||
|---|---|---|---|
| Quadrant | BADHDUFLAG | Total packets | Discarded packets |
| A | 0 | 10 | 0 |
| B | 0 | 10 | 0 |
| C | 0 | 10 | 0 |
| D | 0 | 10 | 0 |
| Mode SS | |||
|---|---|---|---|
| Quadrant | BADHDUFLAG | Total packets | Discarded packets |
| A | 0 | 128 | 0 |
| B | 0 | 128 | 0 |
| C | 0 | 128 | 0 |
| D | 0 | 128 | 0 |
| Mode M0 | |||
|---|---|---|---|
| Quadrant | BADHDUFLAG | Total packets | Discarded packets |
| A | 0 | 32075 | 1 |
| B | 0 | 16900 | 1 |
| C | 0 | 22376 | 1 |
| D | 0 | 36599 | 1 |
| Quadrant | Total seconds | Saturated seconds | Saturation percentage |
|---|---|---|---|
| A | 6267 | 2696 | 43.018988% |
| B | 6268 | 271 | 4.323548% |
| C | 6268 | 699 | 11.151883% |
| D | 6268 | 3354 | 53.509892% |
Noise dominated data is calculated using 1-second bins in cleaned event files. If a bin has >2000 counts, and if more than 50% of those come from <1% of pixels, then it is considered to be noise-dominated and hence unusable.
| Quadrant | # 1 sec bins | Bins with >0 counts | Bins with >2000 counts | High rate bins dominated by noise | Noise dominated (total time) | Noise dominated (detector-on time) | Marked lightcurve |
|---|---|---|---|---|---|---|---|
| A | 7292 | 6267 | 2358 | 2358 | 32.34% | 37.63% | 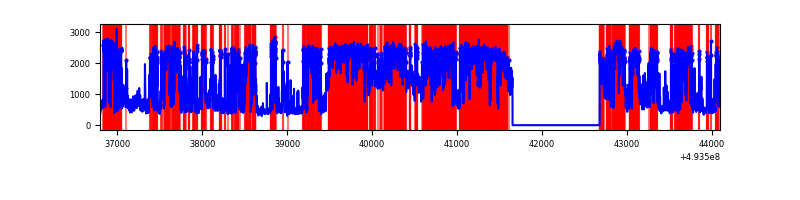 |
| B | 7293 | 6268 | 113 | 113 | 1.55% | 1.80% | 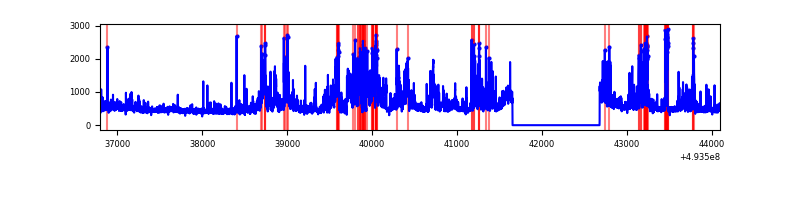 |
| C | 7292 | 6267 | 580 | 580 | 7.95% | 9.25% | 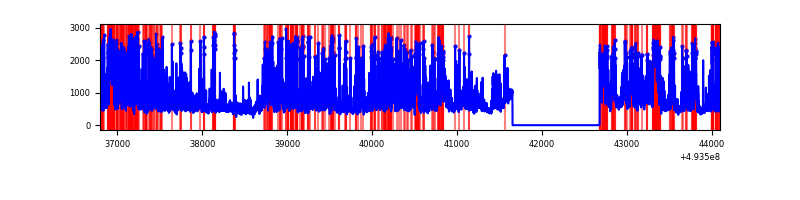 |
| D | 7293 | 6268 | 3346 | 3346 | 45.88% | 53.38% | 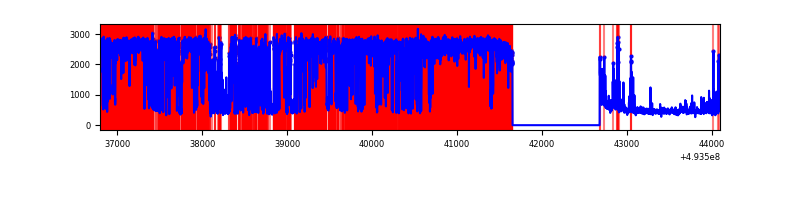 |
Top three noisy pixels from each quadrant. If the there are fewer than three noisy pixels in the level2.evt file, extra rows are filled as -1
| Pixel properties | Quadrant properties | ||||||
|---|---|---|---|---|---|---|---|
| Quadrant | DetID | PixID | Counts | Sigma | Mean | Median | Sigma |
| A | 3 | 63 | 5131374 | 37009.72 | 555 | 541 | 138.6 |
| A | 12 | 115 | 1115314 | 8041.08 | 555 | 541 | 138.6 |
| A | 15 | 174 | 594491 | 4284.28 | 555 | 541 | 138.6 |
| B | 10 | 254 | 838021 | 5732.55 | 685 | 662 | 146.1 |
| B | 5 | 185 | 197544 | 1347.85 | 685 | 662 | 146.1 |
| B | 10 | 247 | 133310 | 908.11 | 685 | 662 | 146.1 |
| C | 15 | 224 | 1624286 | 9038.92 | 651 | 645 | 179.6 |
| C | 12 | 254 | 562158 | 3125.98 | 651 | 645 | 179.6 |
| C | 12 | 2 | 403333 | 2241.79 | 651 | 645 | 179.6 |
| D | 15 | 94 | 8439793 | 67740.04 | 428 | 408 | 124.6 |
| D | 2 | 120 | 147257 | 1178.71 | 428 | 408 | 124.6 |
| D | 3 | 12 | 122640 | 981.11 | 428 | 408 | 124.6 |
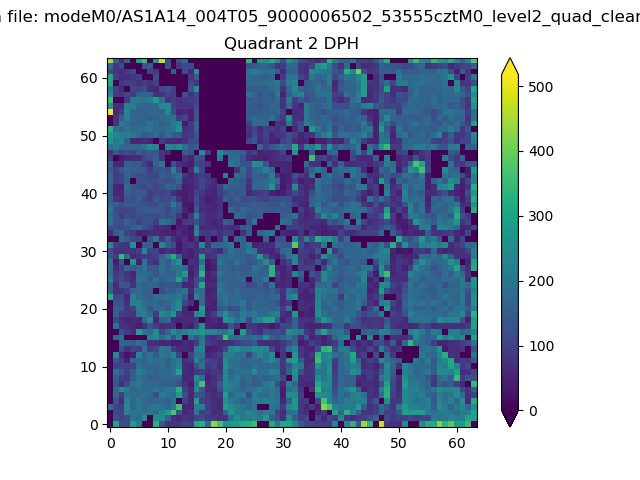
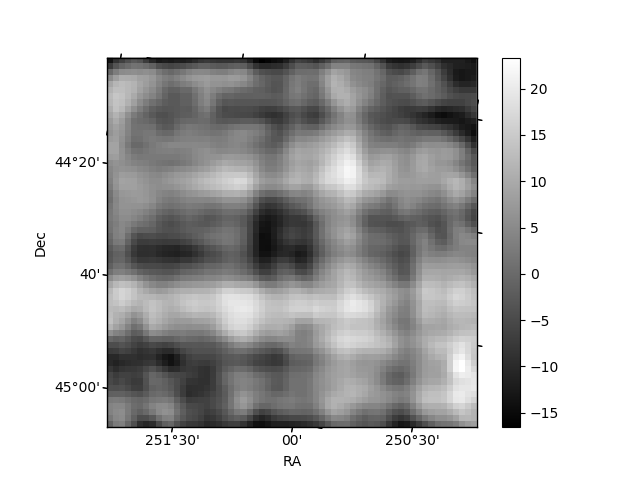
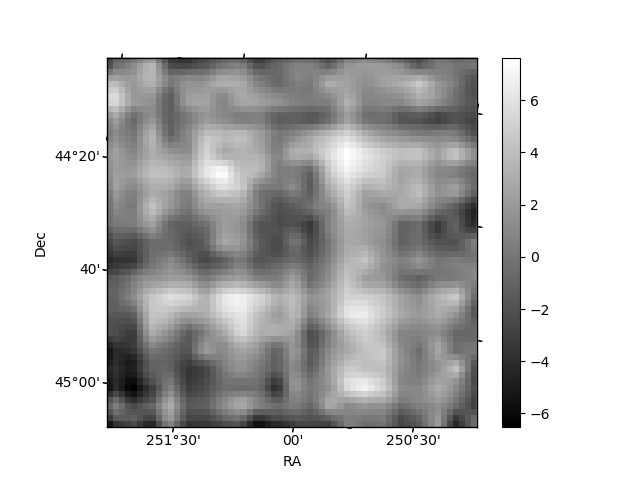
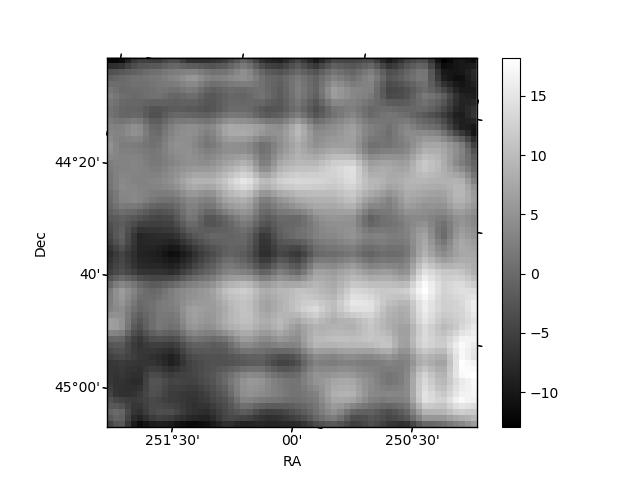
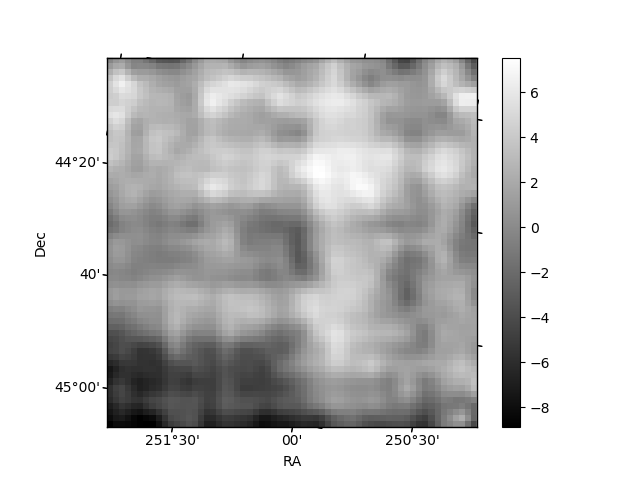
Histogram calculated using DETX and DETY for each event in the final _common_clean file
| Quadrant A | 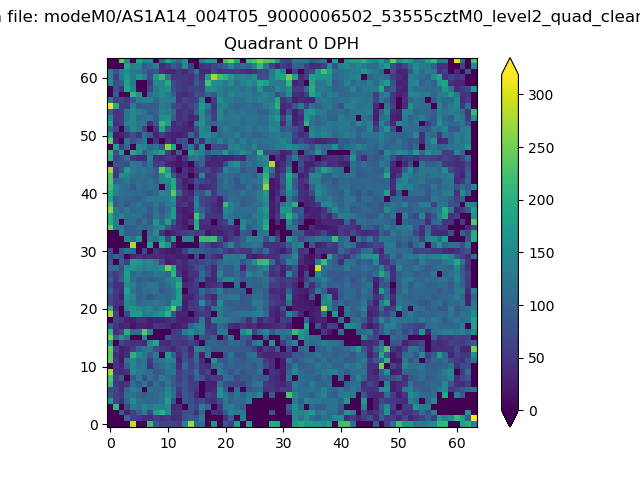 |
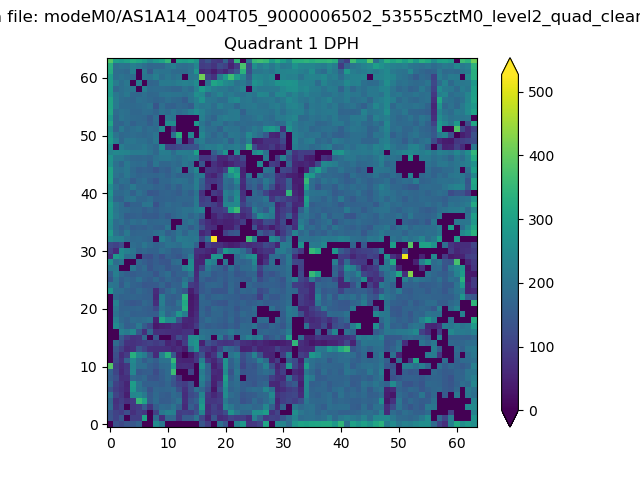 |
Quadrant B |
|---|---|---|---|
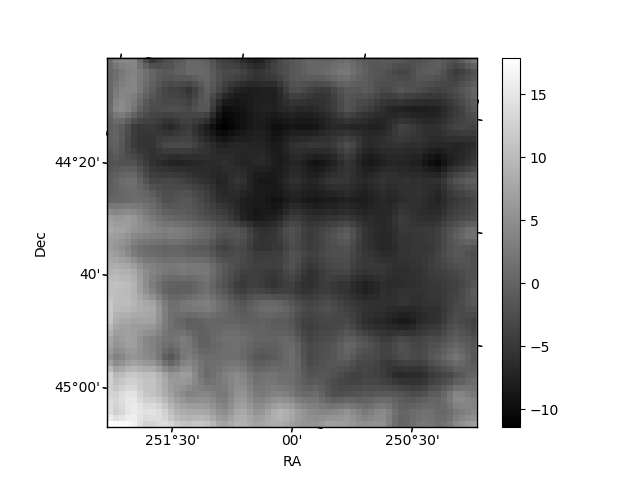
| Quadrant D | 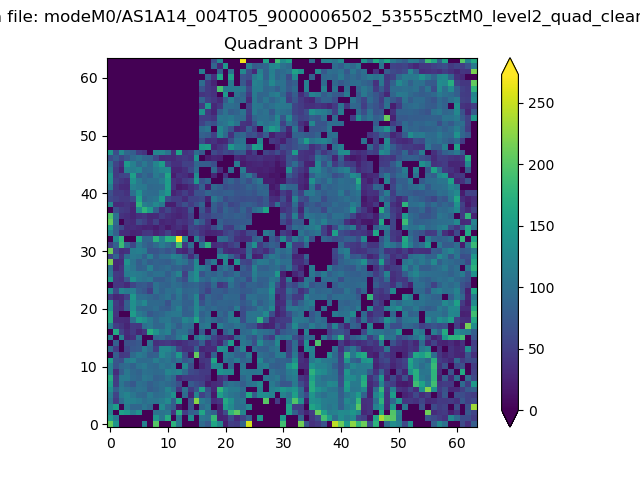 |
 |
Quadrant C |
| Plot type | Count rate plots | Images |
|---|---|---|
| Comparison with Poisson distribution Blue bars denote a histogram of data divided into 1 sec bins. Red curve is a Poisson curve with rate = median count rate of data. |
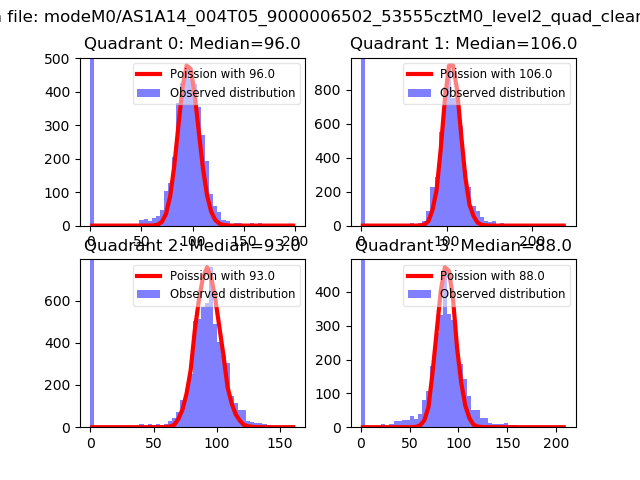 |
 |
| Quadrant-wise count rates Data is divided into 100 sec bins |
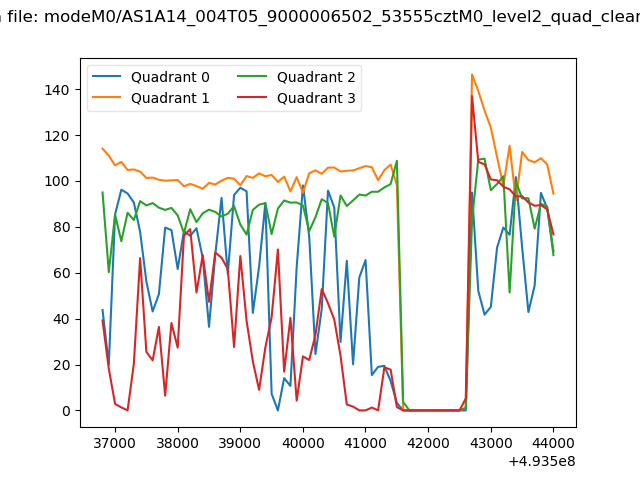 |
|
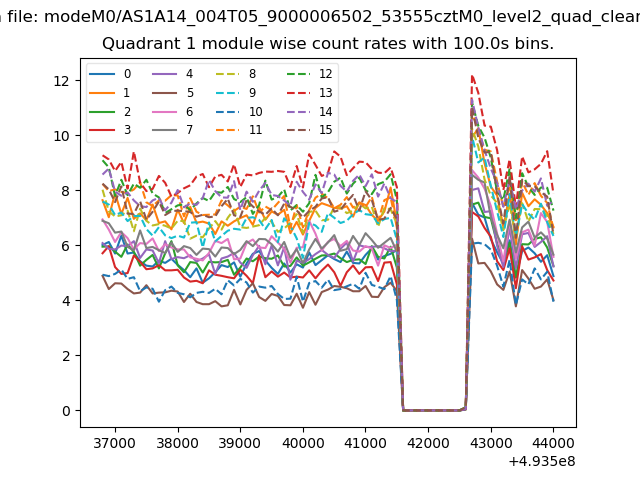
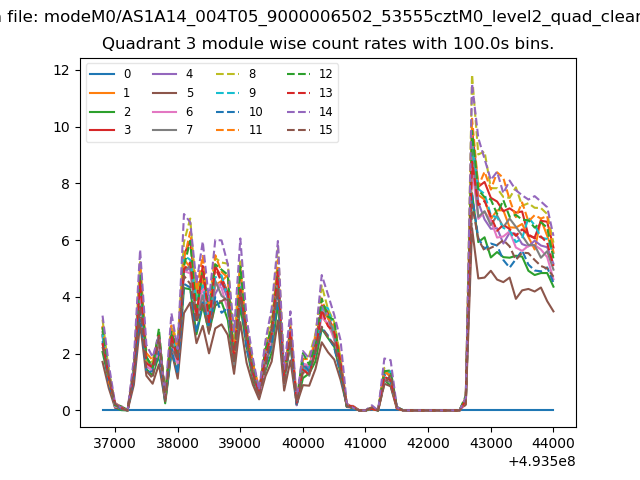
| Module-wise count rates for Quadrant A Data is divided into 100 sec bins |
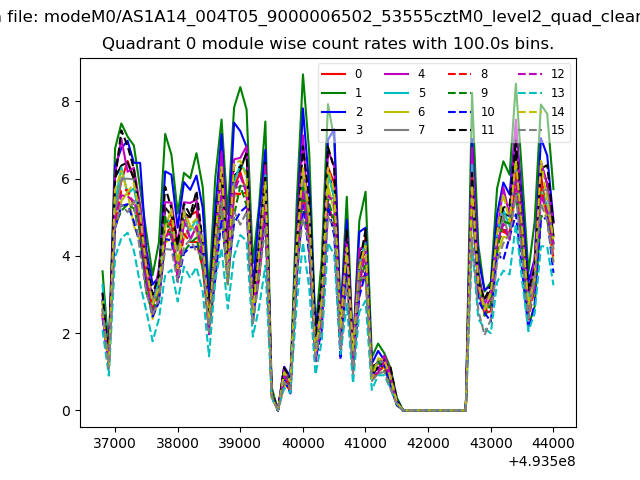 |
 |
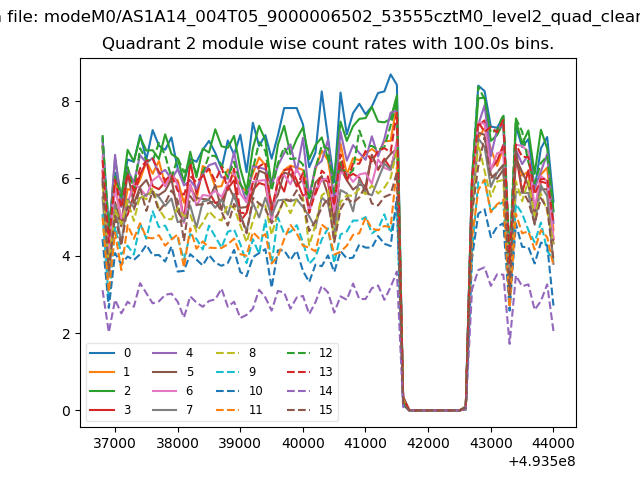
| Module-wise count rates for Quadrant B Data is divided into 100 sec bins |
 |
 |
| Module-wise count rates for Quadrant C Data is divided into 100 sec bins |
 |
 |
| Module-wise count rates for Quadrant D Data is divided into 100 sec bins |
 |
 |
| Parameter | Plot |
|---|---|
| CZT HV Monitor | 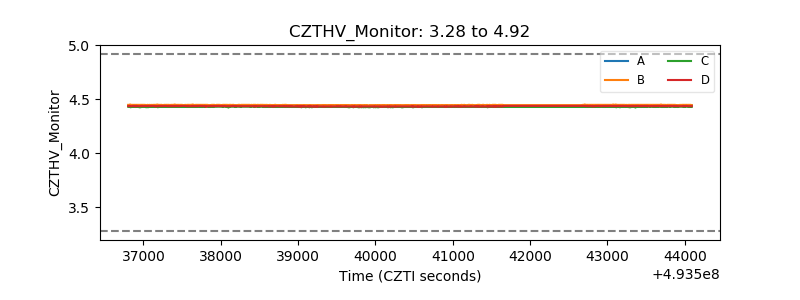 |
| D_VDD | 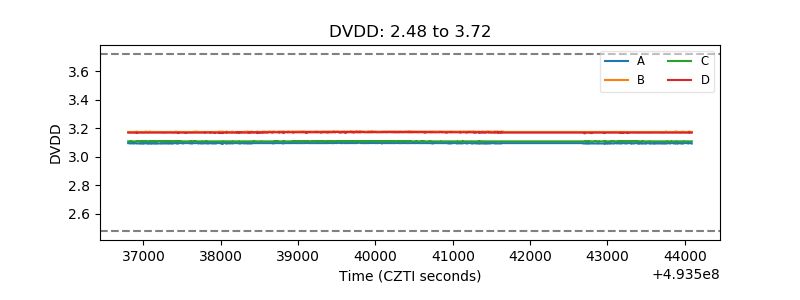 |
| Temperature 1 | 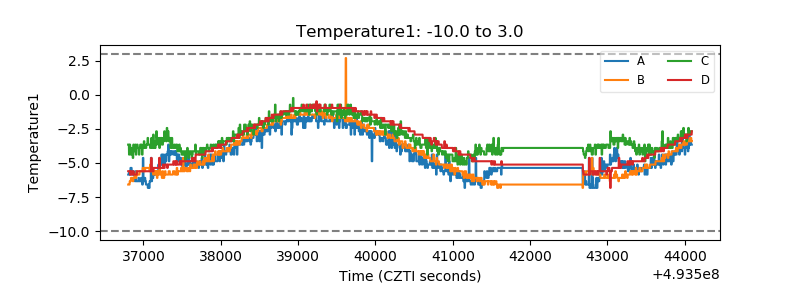 |
| Veto HV Monitor | 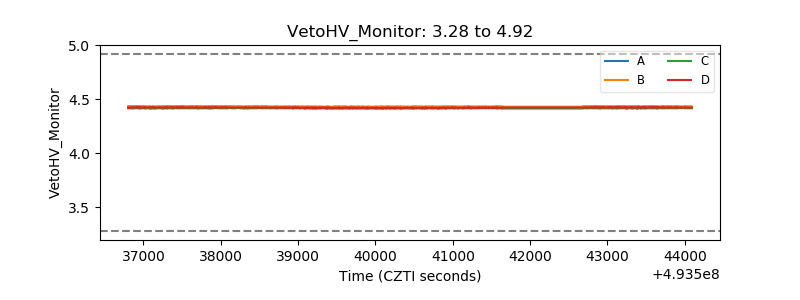 |
| Veto LLD | 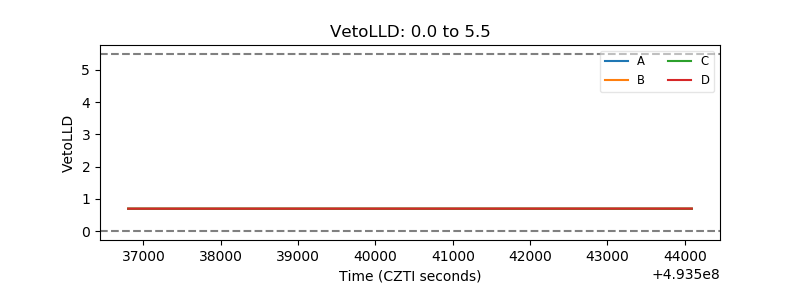 |
| Alpha Counter | 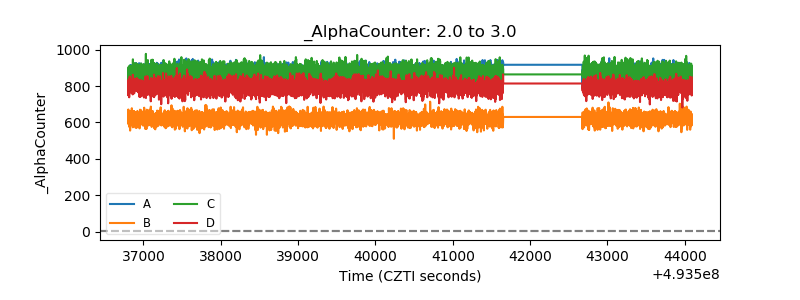 |
| _CPM_Rate | 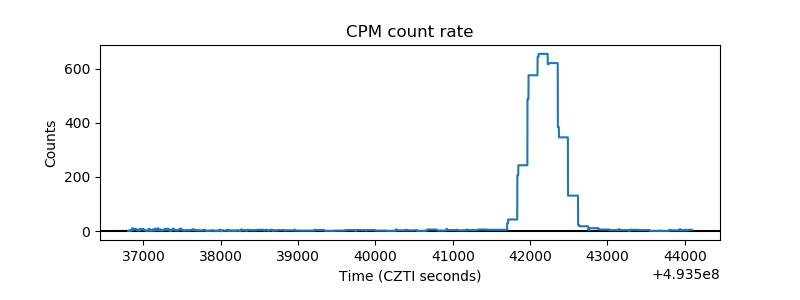 |
| CZT Counter | 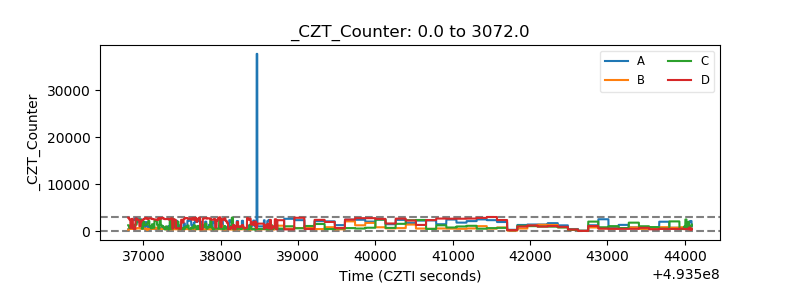 |
| +2.5 Volts monitor |  |
| +5 Volts monitor |  |
| _ROLL_ROT | 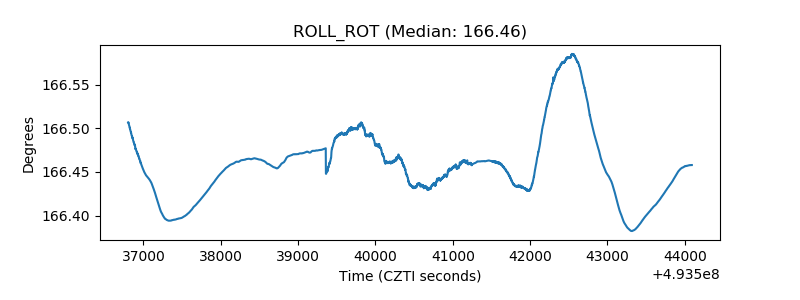 |
| _Roll_DEC | 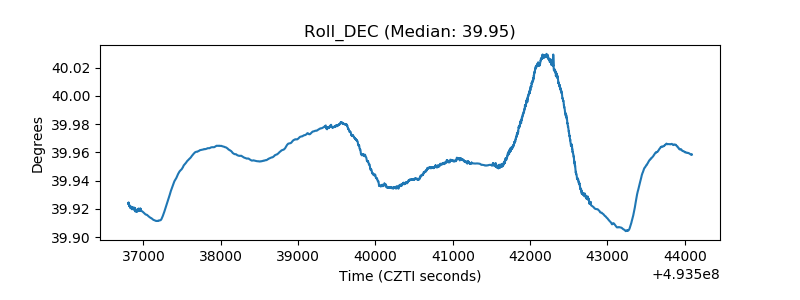 |
| _Roll_RA | 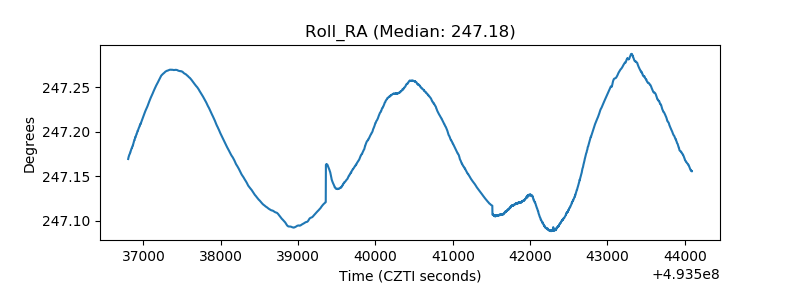 |
| Veto Counter | 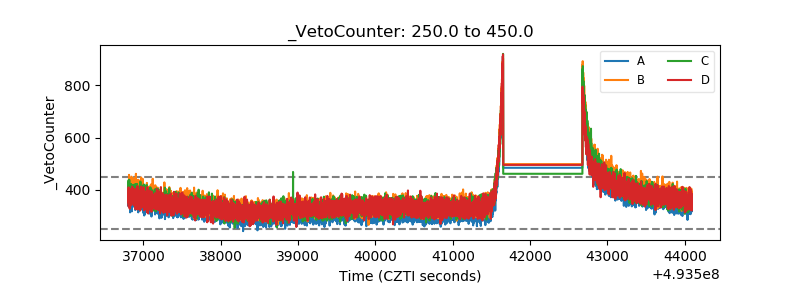 |