| Param | Original file | Final file |
|---|---|---|
| Filename | modeM0/AS1A14_004T05_9000006502_53556cztM0_level2.fits | modeM0/AS1A14_004T05_9000006502_53556cztM0_level2_quad_clean.evt |
| Size (bytes) | 652,688,640 | 91,002,240 |
| Size | 622.5 MB | 86.8 MB |
| Events in quadrant A | 7,979,219 | 492,355 |
| Events in quadrant B | 4,381,452 | 701,629 |
| Events in quadrant C | 7,435,922 | 514,574 |
| Events in quadrant D | 3,860,569 | 594,440 |
| Mode M9 | |||
|---|---|---|---|
| Quadrant | BADHDUFLAG | Total packets | Discarded packets |
| A | 0 | 11 | 0 |
| B | 0 | 11 | 0 |
| C | 0 | 12 | 0 |
| D | 0 | 12 | 0 |
| Mode SS | |||
|---|---|---|---|
| Quadrant | BADHDUFLAG | Total packets | Discarded packets |
| A | 0 | 132 | 0 |
| B | 0 | 132 | 0 |
| C | 0 | 132 | 0 |
| D | 0 | 132 | 0 |
| Mode M0 | |||
|---|---|---|---|
| Quadrant | BADHDUFLAG | Total packets | Discarded packets |
| A | 0 | 28130 | 2 |
| B | 0 | 17319 | 2 |
| C | 0 | 26623 | 2 |
| D | 0 | 15805 | 2 |
| Quadrant | Total seconds | Saturated seconds | Saturation percentage |
|---|---|---|---|
| A | 6485 | 1999 | 30.824981% |
| B | 6485 | 348 | 5.366230% |
| C | 6485 | 1509 | 23.269082% |
| D | 6485 | 211 | 3.253662% |
Noise dominated data is calculated using 1-second bins in cleaned event files. If a bin has >2000 counts, and if more than 50% of those come from <1% of pixels, then it is considered to be noise-dominated and hence unusable.
| Quadrant | # 1 sec bins | Bins with >0 counts | Bins with >2000 counts | High rate bins dominated by noise | Noise dominated (total time) | Noise dominated (detector-on time) | Marked lightcurve |
|---|---|---|---|---|---|---|---|
| A | 7599 | 6484 | 1532 | 1532 | 20.16% | 23.63% | 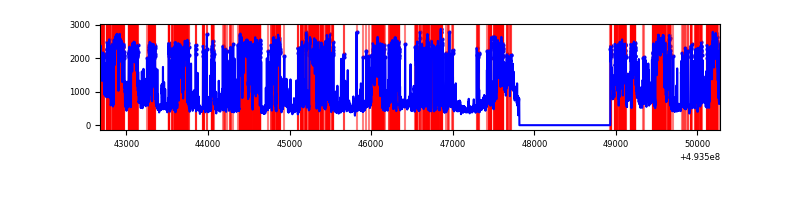 |
| B | 7600 | 6485 | 107 | 107 | 1.41% | 1.65% | 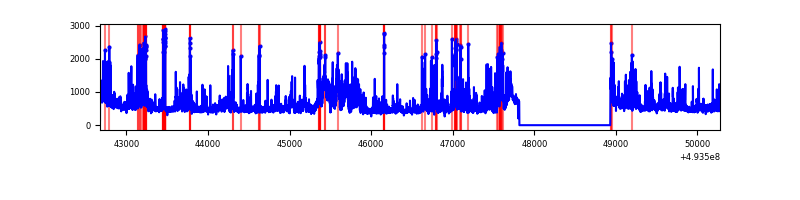 |
| C | 7600 | 6485 | 1201 | 1201 | 15.80% | 18.52% | 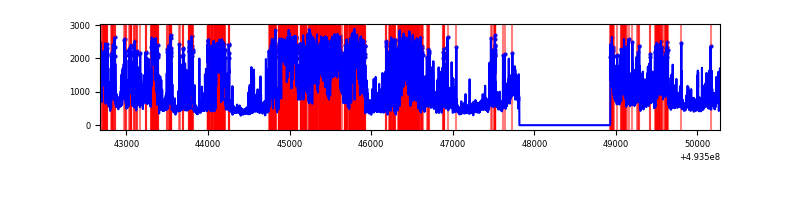 |
| D | 7599 | 6484 | 92 | 92 | 1.21% | 1.42% | 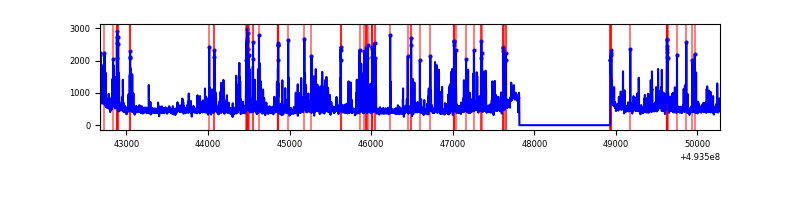 |
Top three noisy pixels from each quadrant. If the there are fewer than three noisy pixels in the level2.evt file, extra rows are filled as -1
| Pixel properties | Quadrant properties | ||||||
|---|---|---|---|---|---|---|---|
| Quadrant | DetID | PixID | Counts | Sigma | Mean | Median | Sigma |
| A | 3 | 63 | 3457745 | 21423.04 | 648 | 634 | 161.4 |
| A | 15 | 174 | 717110 | 4439.86 | 648 | 634 | 161.4 |
| A | 7 | 206 | 510228 | 3157.85 | 648 | 634 | 161.4 |
| B | 5 | 185 | 412652 | 2623.79 | 733 | 710 | 157.0 |
| B | 10 | 254 | 364975 | 2320.12 | 733 | 710 | 157.0 |
| B | 15 | 20 | 178834 | 1134.53 | 733 | 710 | 157.0 |
| C | 12 | 254 | 2840750 | 15664.13 | 656 | 652 | 181.3 |
| C | 15 | 224 | 1034080 | 5699.72 | 656 | 652 | 181.3 |
| C | 15 | 201 | 296410 | 1631.21 | 656 | 652 | 181.3 |
| D | 13 | 153 | 223866 | 1087.59 | 727 | 695 | 205.2 |
| D | 2 | 120 | 100217 | 485.01 | 727 | 695 | 205.2 |
| D | 3 | 12 | 94563 | 457.45 | 727 | 695 | 205.2 |
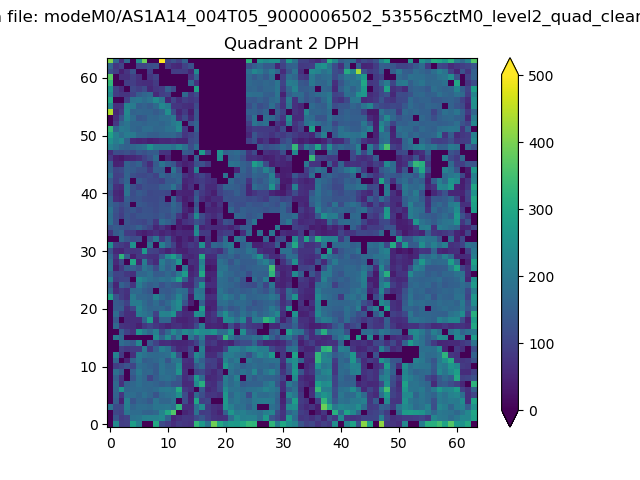
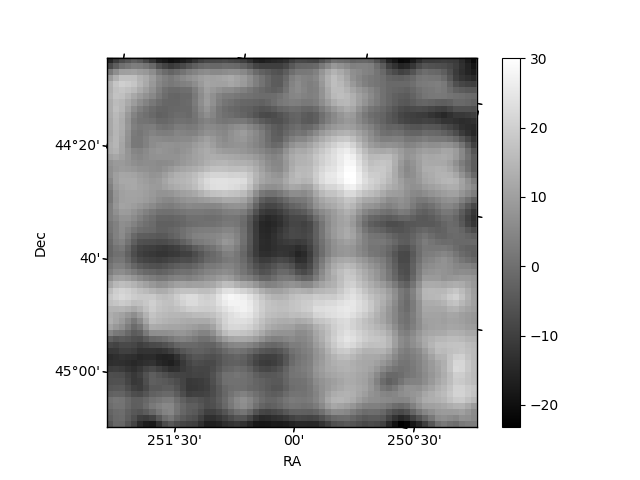
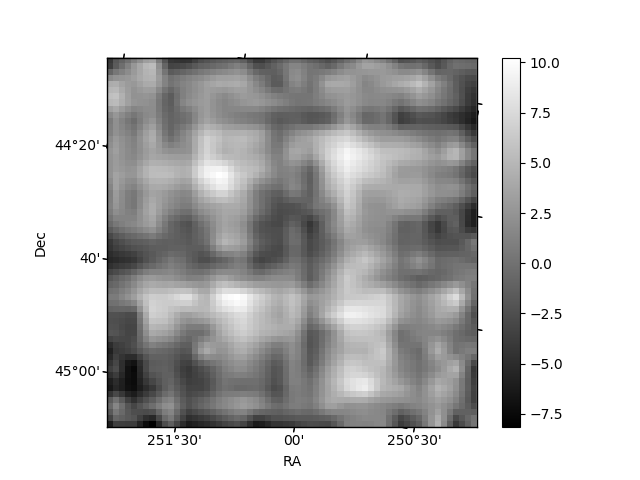
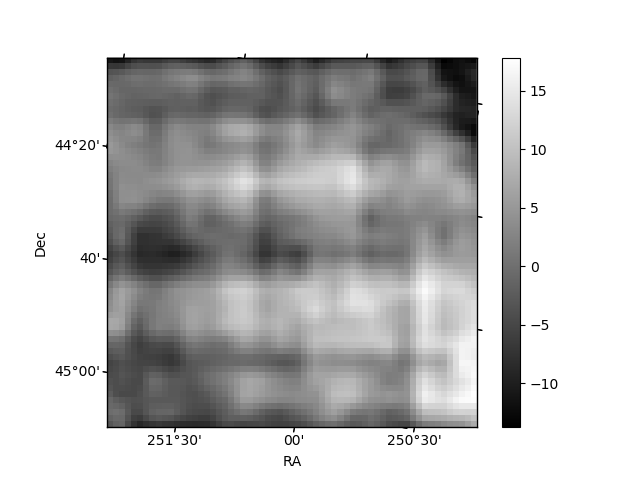
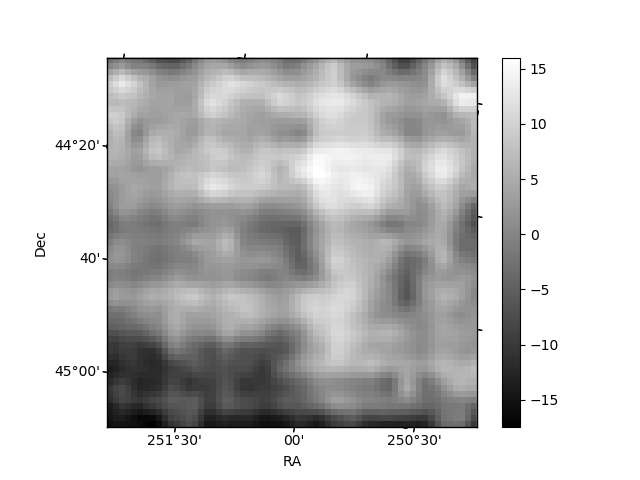
Histogram calculated using DETX and DETY for each event in the final _common_clean file
| Quadrant A | 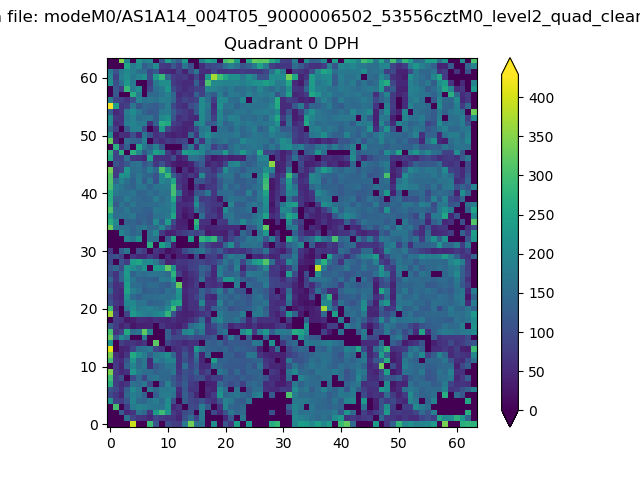 |
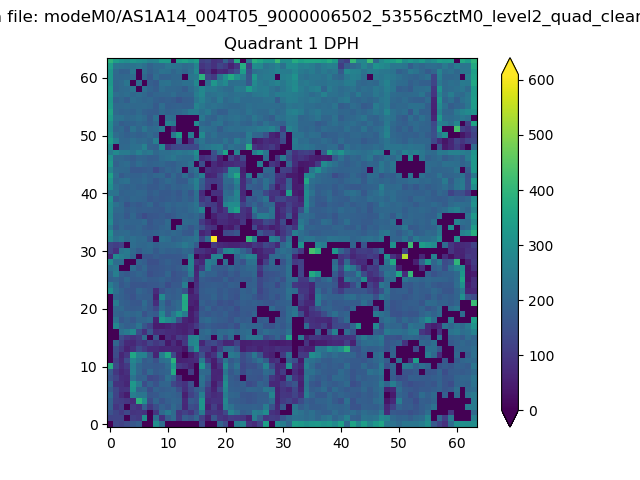 |
Quadrant B |
|---|---|---|---|
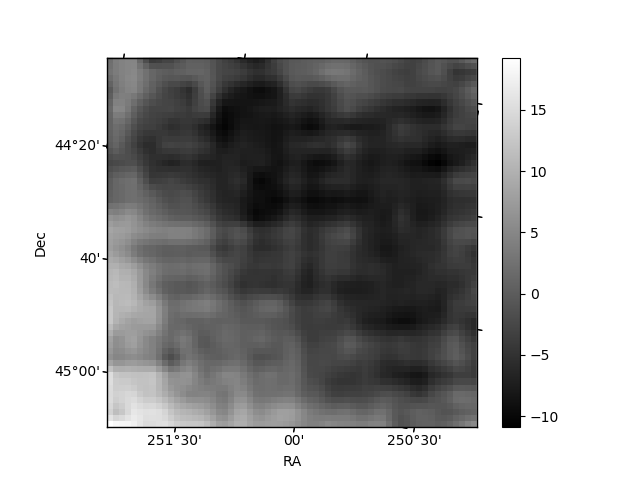
| Quadrant D | 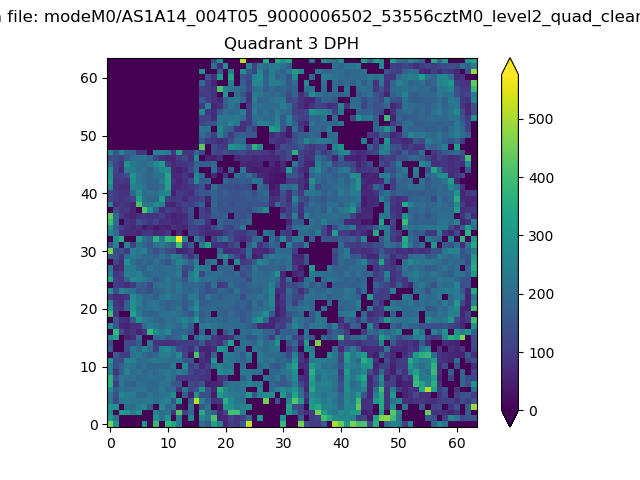 |
 |
Quadrant C |
| Plot type | Count rate plots | Images |
|---|---|---|
| Comparison with Poisson distribution Blue bars denote a histogram of data divided into 1 sec bins. Red curve is a Poisson curve with rate = median count rate of data. |
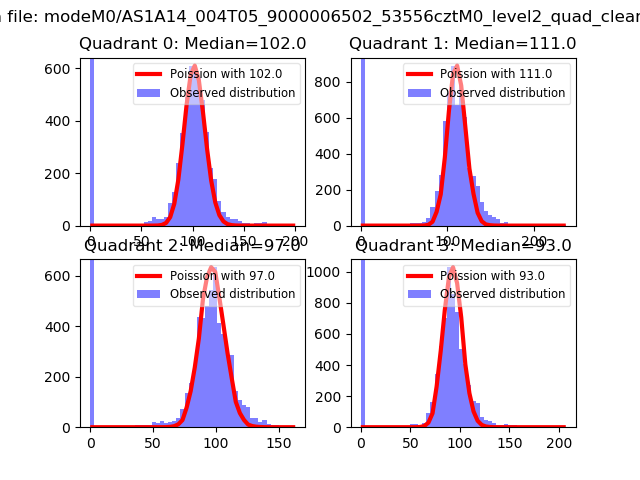 |
 |
| Quadrant-wise count rates Data is divided into 100 sec bins |
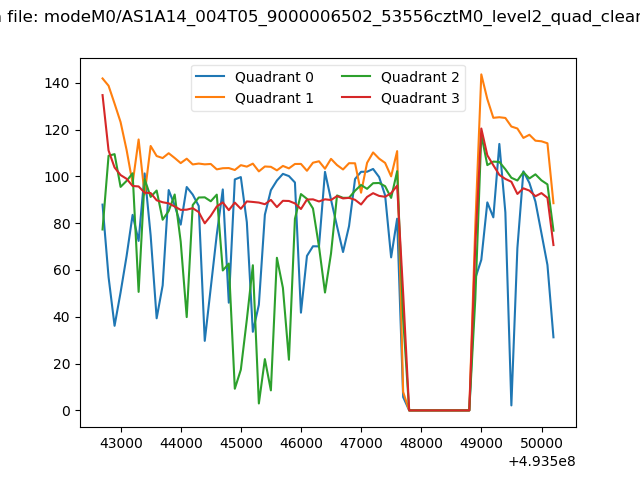 |
|
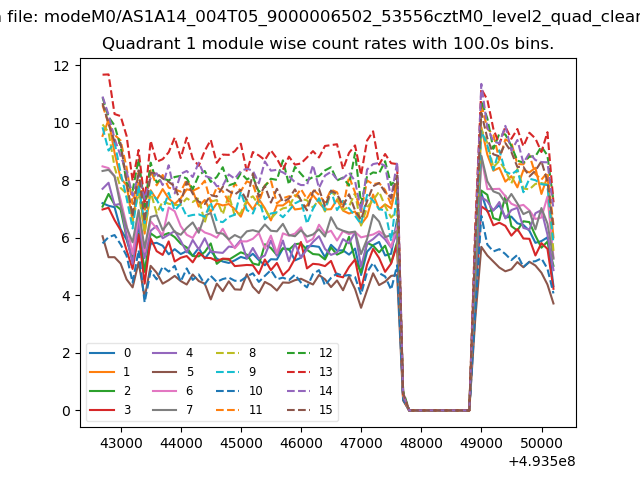
| Module-wise count rates for Quadrant A Data is divided into 100 sec bins |
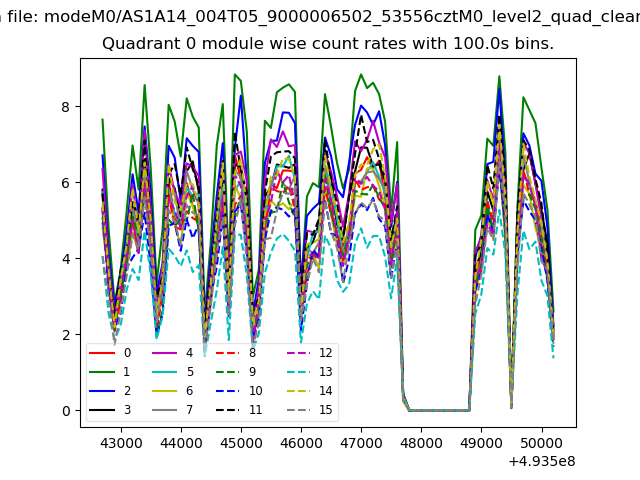 |
 |
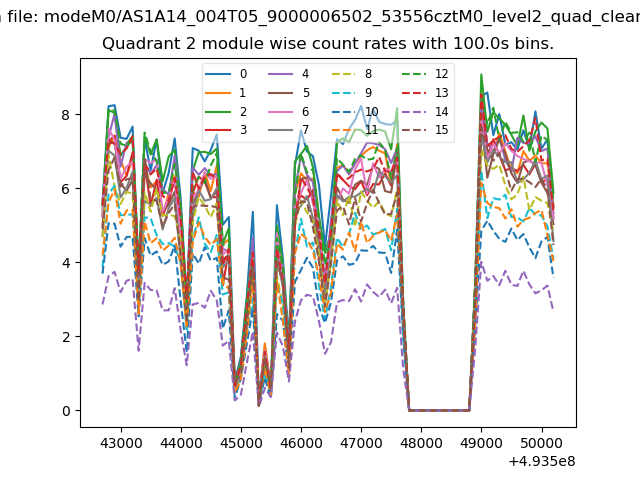
| Module-wise count rates for Quadrant B Data is divided into 100 sec bins |
 |
 |
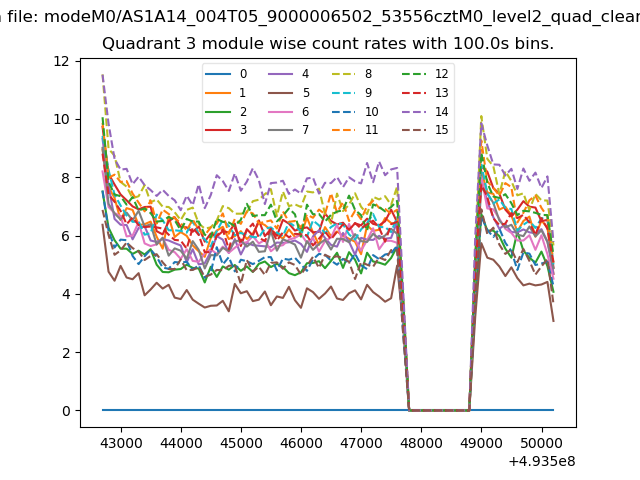
| Module-wise count rates for Quadrant C Data is divided into 100 sec bins |
 |
 |
| Module-wise count rates for Quadrant D Data is divided into 100 sec bins |
 |
 |
| Parameter | Plot |
|---|---|
| CZT HV Monitor | 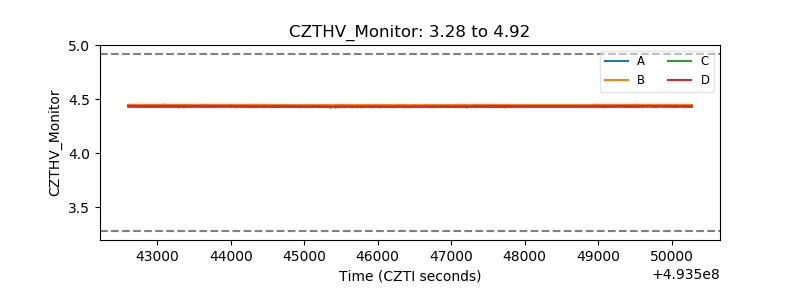 |
| D_VDD | 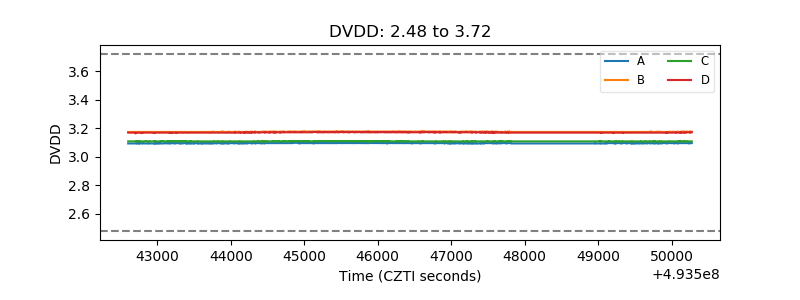 |
| Temperature 1 | 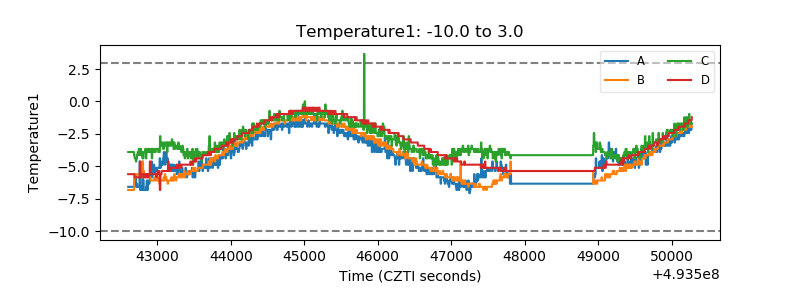 |
| Veto HV Monitor | 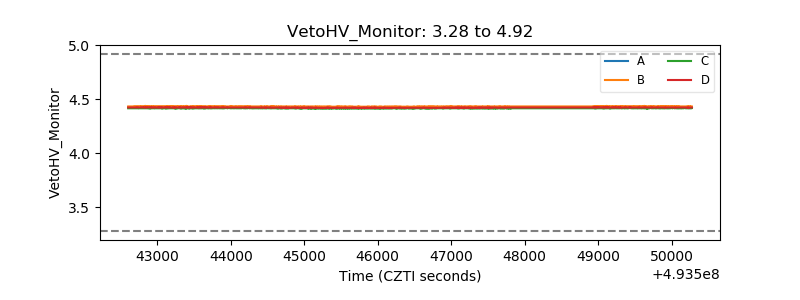 |
| Veto LLD | 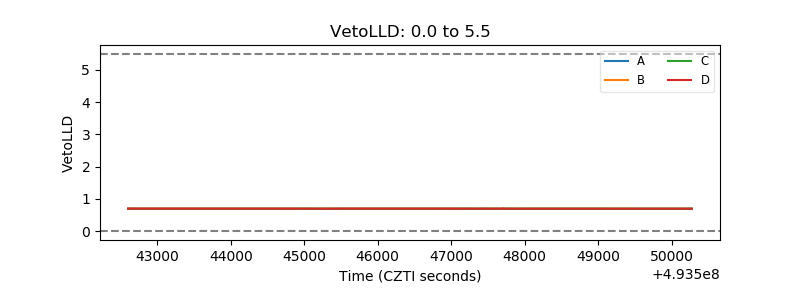 |
| Alpha Counter | 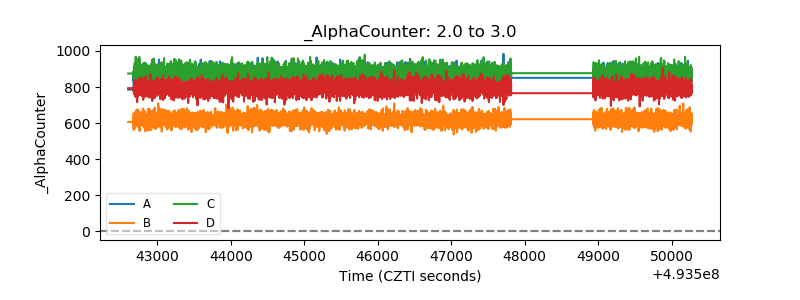 |
| _CPM_Rate | 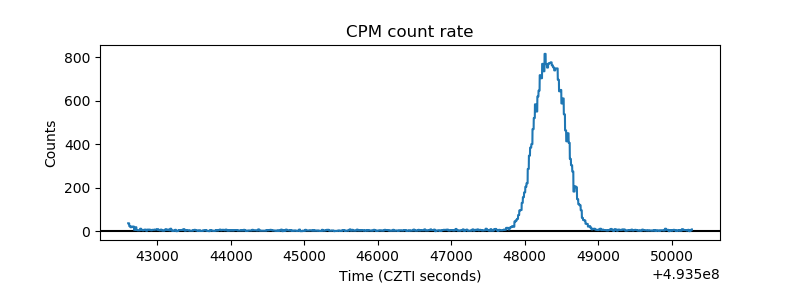 |
| CZT Counter | 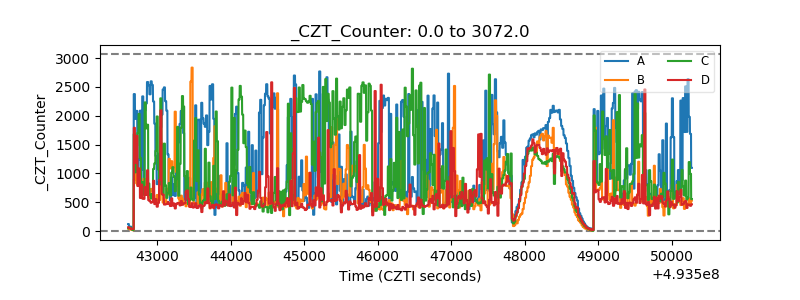 |
| +2.5 Volts monitor |  |
| +5 Volts monitor |  |
| _ROLL_ROT | 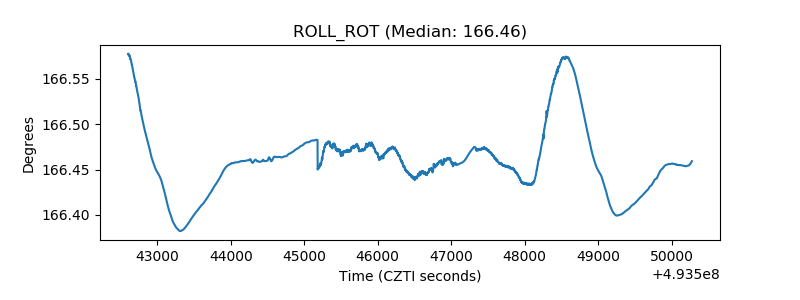 |
| _Roll_DEC | 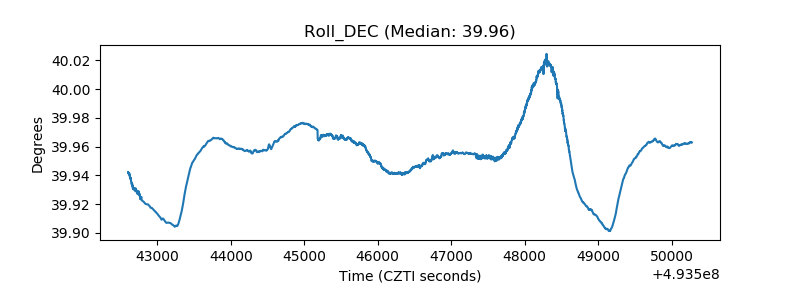 |
| _Roll_RA | 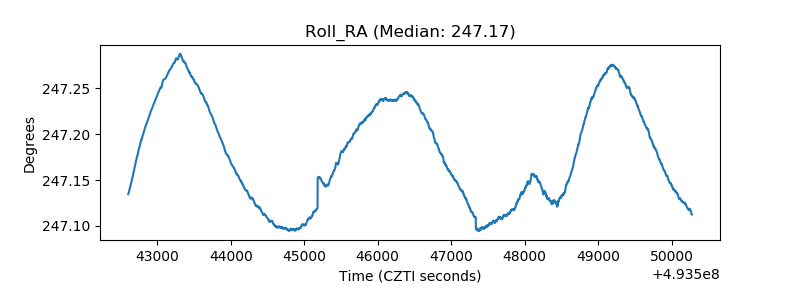 |
| Veto Counter | 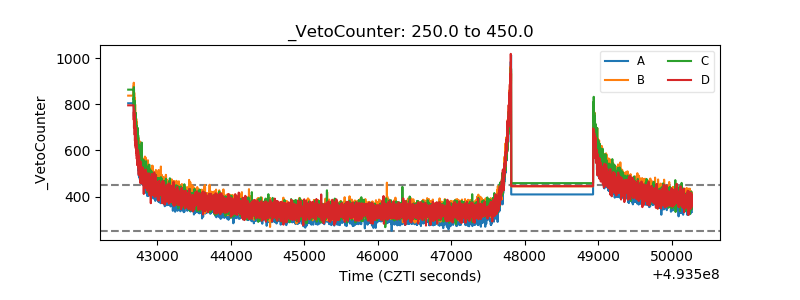 |