| Param | Original file | Final file |
|---|---|---|
| Filename | modeM0/AS1A14_004T05_9000006502_53557cztM0_level2.fits | modeM0/AS1A14_004T05_9000006502_53557cztM0_level2_quad_clean.evt |
| Size (bytes) | 686,865,600 | 81,262,080 |
| Size | 655.0 MB | 77.5 MB |
| Events in quadrant A | 8,279,355 | 448,572 |
| Events in quadrant B | 3,670,582 | 645,319 |
| Events in quadrant C | 9,150,355 | 401,266 |
| Events in quadrant D | 3,863,057 | 549,003 |
| Mode M9 | |||
|---|---|---|---|
| Quadrant | BADHDUFLAG | Total packets | Discarded packets |
| A | 0 | 12 | 0 |
| B | 0 | 12 | 0 |
| C | 0 | 12 | 0 |
| D | 0 | 12 | 0 |
| Mode SS | |||
|---|---|---|---|
| Quadrant | BADHDUFLAG | Total packets | Discarded packets |
| A | 0 | 120 | 0 |
| B | 0 | 120 | 0 |
| C | 0 | 120 | 0 |
| D | 0 | 120 | 0 |
| Mode M0 | |||
|---|---|---|---|
| Quadrant | BADHDUFLAG | Total packets | Discarded packets |
| A | 0 | 28715 | 1 |
| B | 0 | 14776 | 1 |
| C | 0 | 31218 | 1 |
| D | 0 | 15420 | 1 |
| Quadrant | Total seconds | Saturated seconds | Saturation percentage |
|---|---|---|---|
| A | 5964 | 1975 | 33.115359% |
| B | 5965 | 296 | 4.962280% |
| C | 5965 | 2128 | 35.674769% |
| D | 5965 | 210 | 3.520536% |
Noise dominated data is calculated using 1-second bins in cleaned event files. If a bin has >2000 counts, and if more than 50% of those come from <1% of pixels, then it is considered to be noise-dominated and hence unusable.
| Quadrant | # 1 sec bins | Bins with >0 counts | Bins with >2000 counts | High rate bins dominated by noise | Noise dominated (total time) | Noise dominated (detector-on time) | Marked lightcurve |
|---|---|---|---|---|---|---|---|
| A | 7133 | 5963 | 1707 | 1707 | 23.93% | 28.63% | 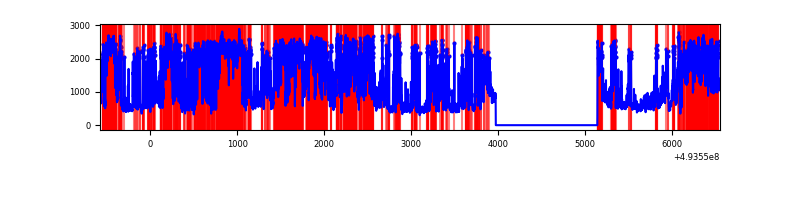 |
| B | 7134 | 5964 | 168 | 168 | 2.35% | 2.82% | 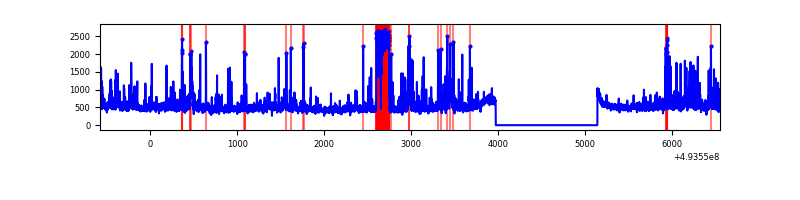 |
| C | 7134 | 5964 | 2078 | 2078 | 29.13% | 34.84% | 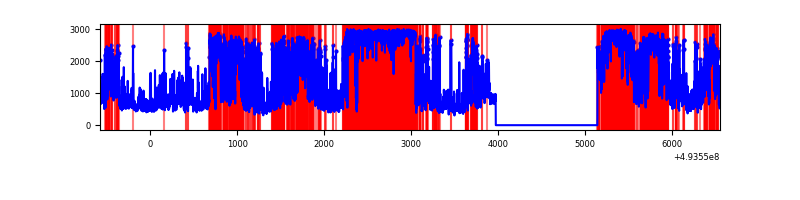 |
| D | 7134 | 5965 | 133 | 133 | 1.86% | 2.23% | 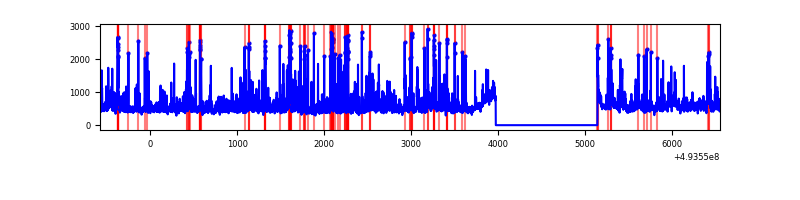 |
Top three noisy pixels from each quadrant. If the there are fewer than three noisy pixels in the level2.evt file, extra rows are filled as -1
| Pixel properties | Quadrant properties | ||||||
|---|---|---|---|---|---|---|---|
| Quadrant | DetID | PixID | Counts | Sigma | Mean | Median | Sigma |
| A | 3 | 63 | 3128329 | 21178.45 | 597 | 583 | 147.7 |
| A | 3 | 62 | 1179864 | 7985.09 | 597 | 583 | 147.7 |
| A | 12 | 115 | 697731 | 4720.5 | 597 | 583 | 147.7 |
| B | 5 | 185 | 558894 | 3964.41 | 665 | 644 | 140.8 |
| B | 15 | 20 | 145555 | 1029.09 | 665 | 644 | 140.8 |
| B | 10 | 247 | 77641 | 546.79 | 665 | 644 | 140.8 |
| C | 1 | 241 | 3930543 | 26208.05 | 539 | 533 | 150.0 |
| C | 12 | 254 | 1289776 | 8597.57 | 539 | 533 | 150.0 |
| C | 15 | 178 | 817676 | 5449.28 | 539 | 533 | 150.0 |
| D | 13 | 153 | 158671 | 843.36 | 665 | 635 | 187.4 |
| D | 14 | 50 | 115325 | 612.04 | 665 | 635 | 187.4 |
| D | 15 | 94 | 114946 | 610.02 | 665 | 635 | 187.4 |
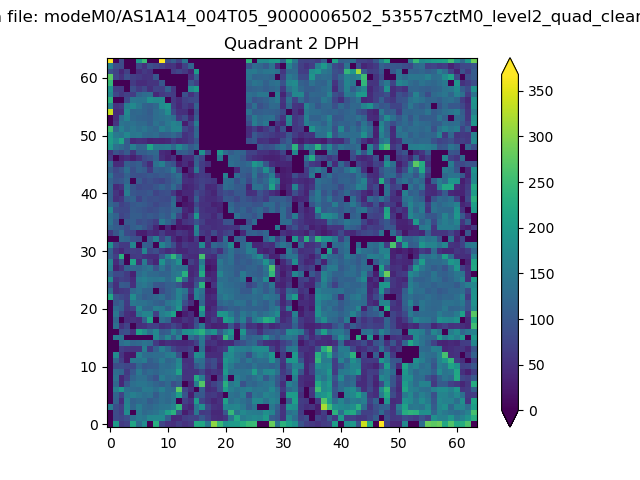
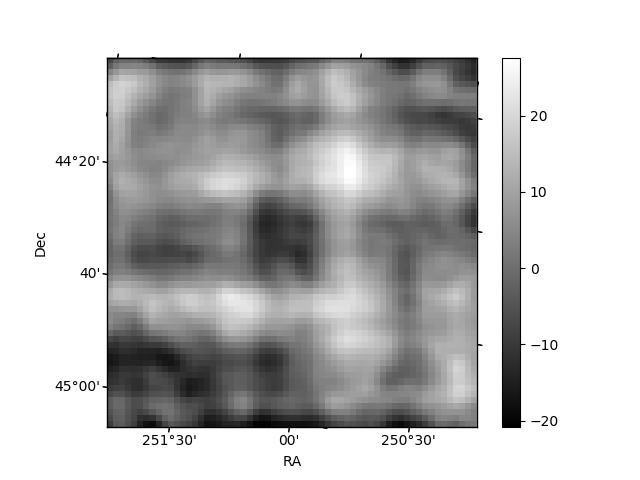
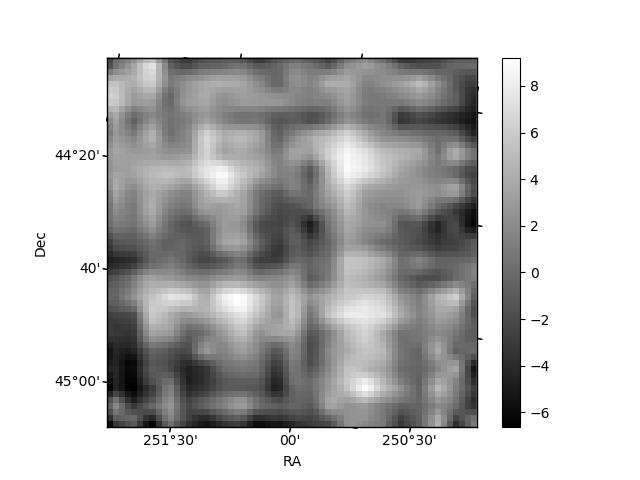
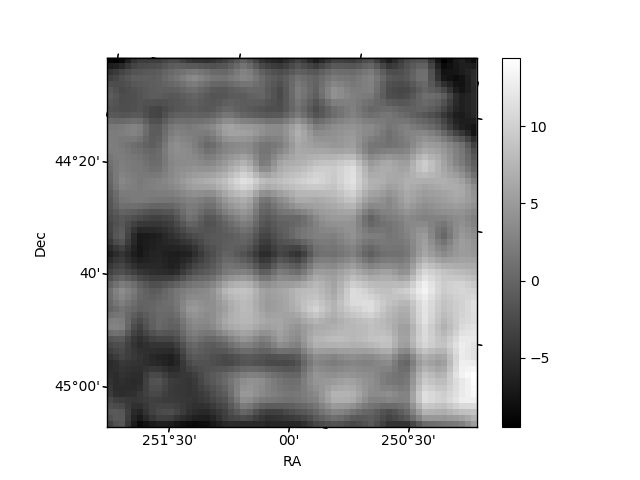
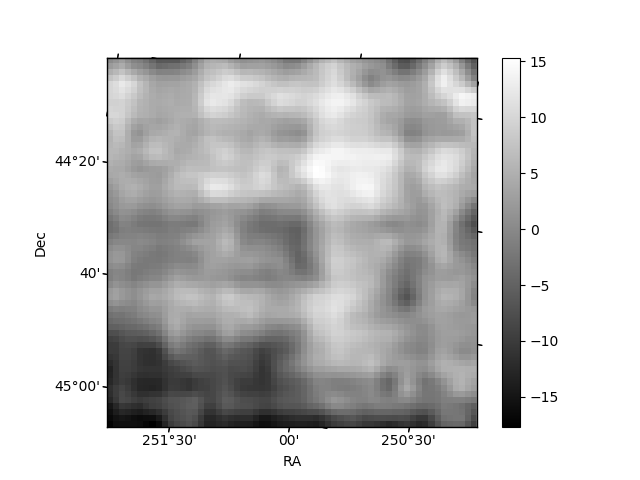
Histogram calculated using DETX and DETY for each event in the final _common_clean file
| Quadrant A | 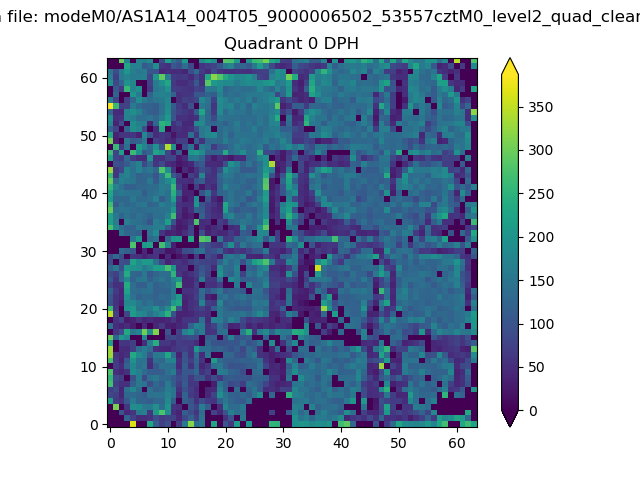 |
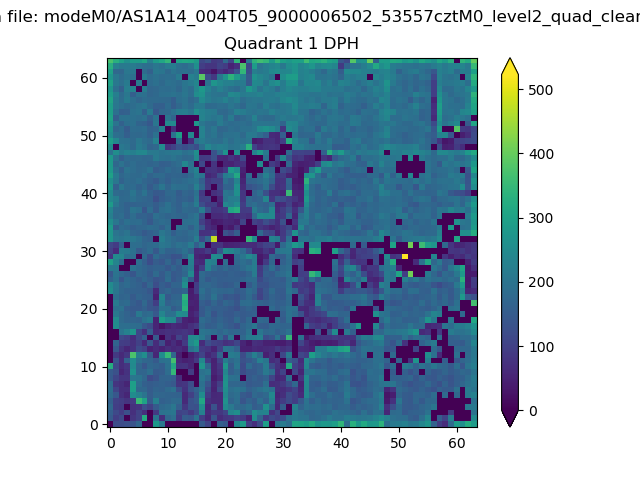 |
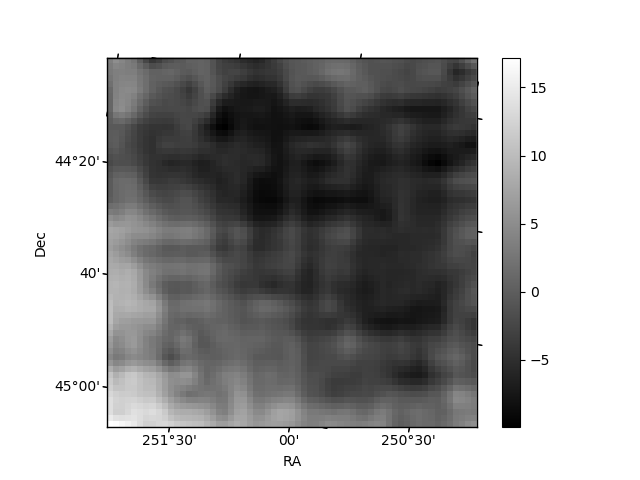
Quadrant B |
|---|---|---|---|
| Quadrant D | 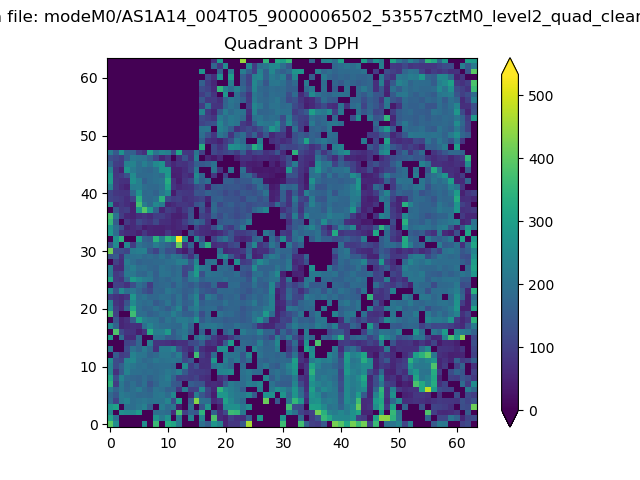 |
 |
Quadrant C |
| Plot type | Count rate plots | Images |
|---|---|---|
| Comparison with Poisson distribution Blue bars denote a histogram of data divided into 1 sec bins. Red curve is a Poisson curve with rate = median count rate of data. |
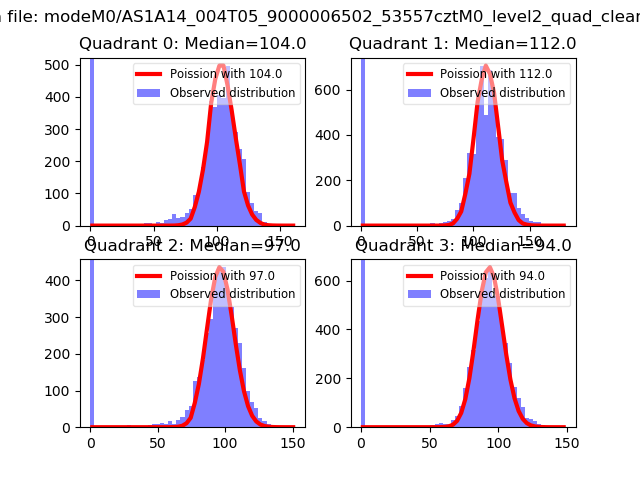 |
 |
| Quadrant-wise count rates Data is divided into 100 sec bins |
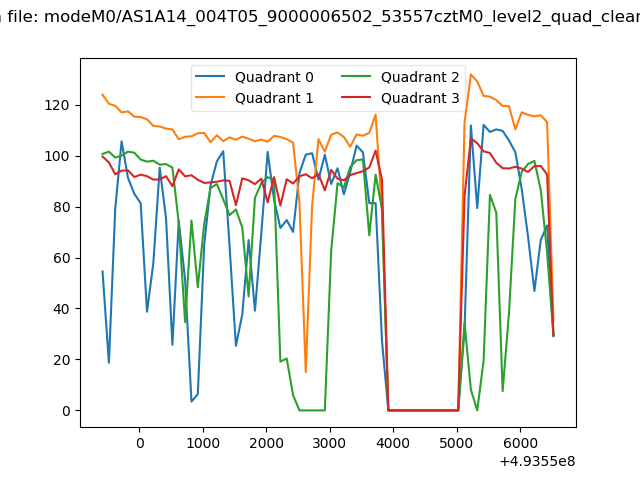 |
|
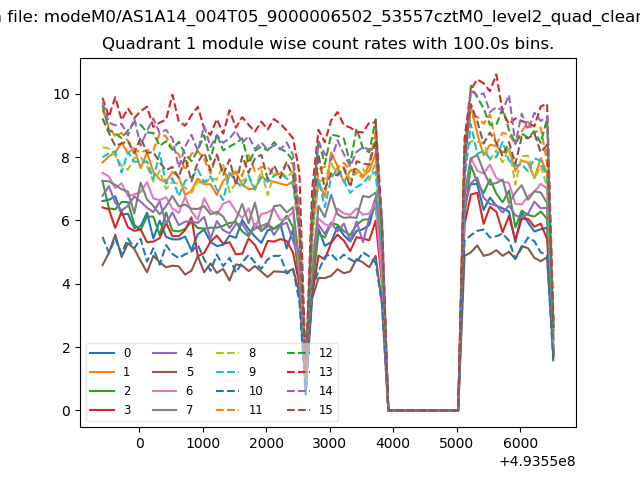
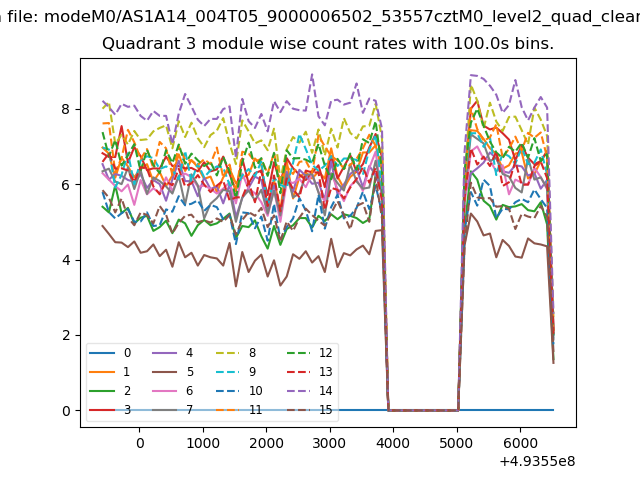
| Module-wise count rates for Quadrant A Data is divided into 100 sec bins |
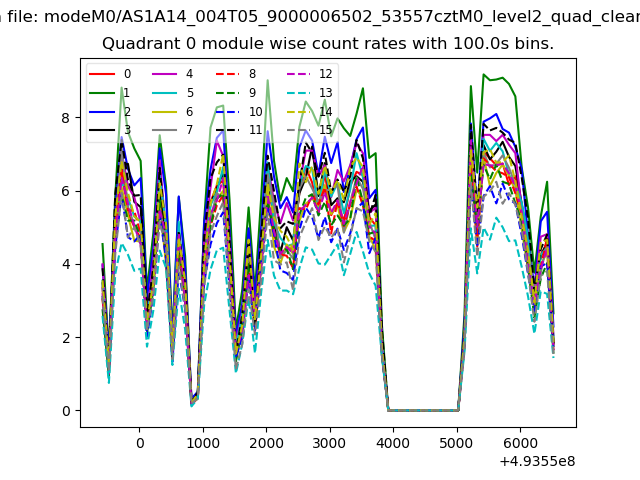 |
 |
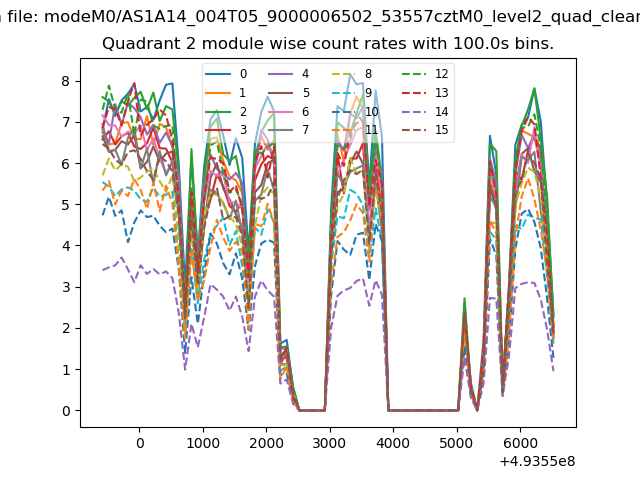
| Module-wise count rates for Quadrant B Data is divided into 100 sec bins |
 |
 |
| Module-wise count rates for Quadrant C Data is divided into 100 sec bins |
 |
 |
| Module-wise count rates for Quadrant D Data is divided into 100 sec bins |
 |
 |
| Parameter | Plot |
|---|---|
| CZT HV Monitor | 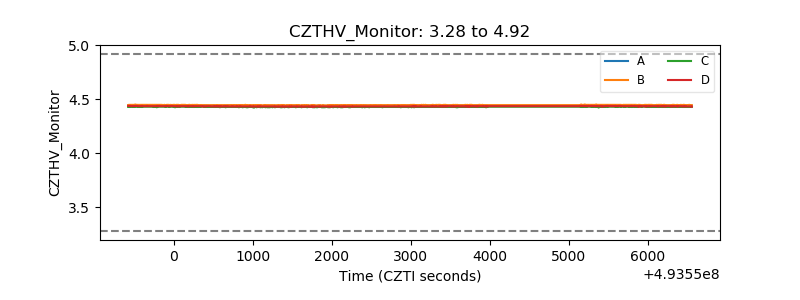 |
| D_VDD | 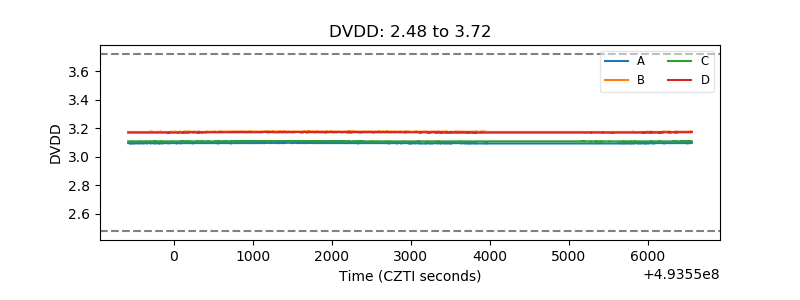 |
| Temperature 1 | 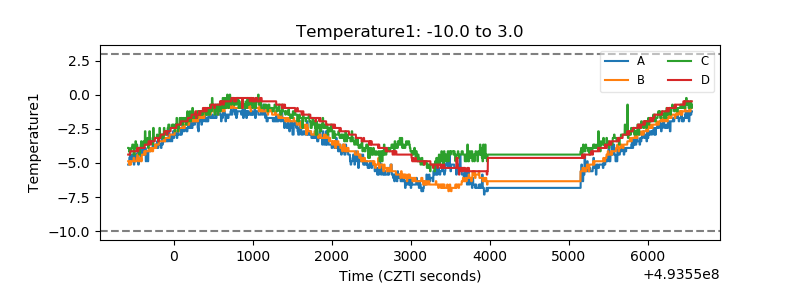 |
| Veto HV Monitor | 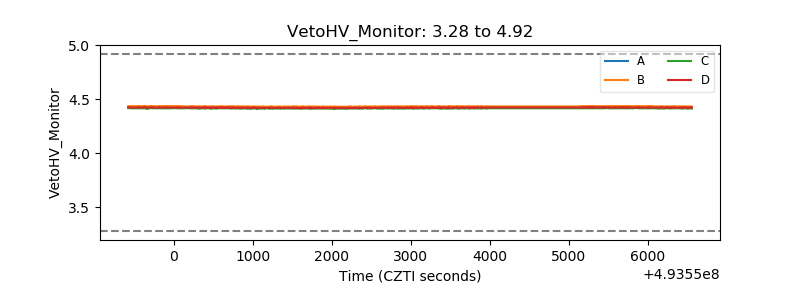 |
| Veto LLD | 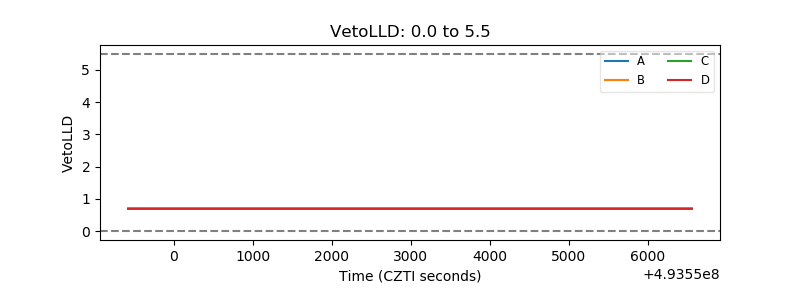 |
| Alpha Counter | 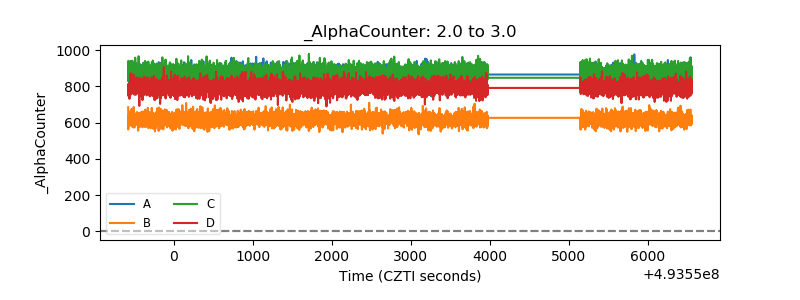 |
| _CPM_Rate | 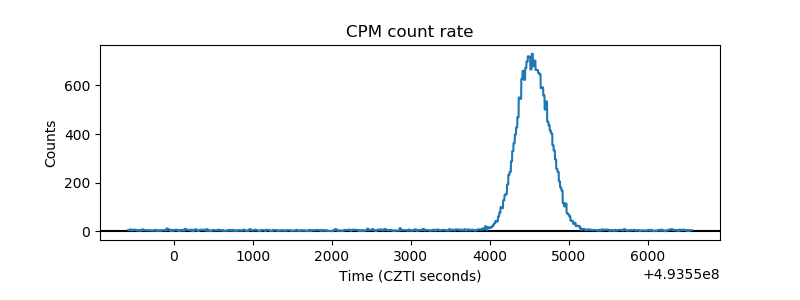 |
| CZT Counter | 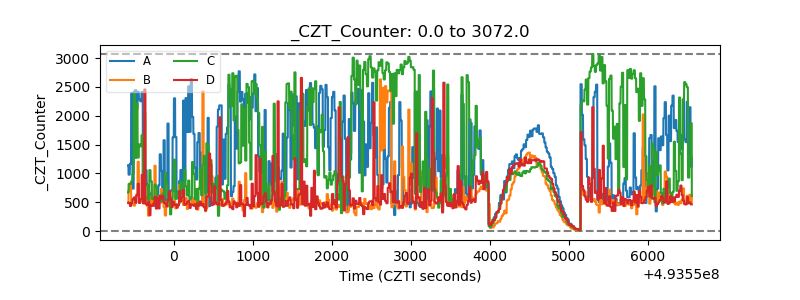 |
| +2.5 Volts monitor |  |
| +5 Volts monitor |  |
| _ROLL_ROT | 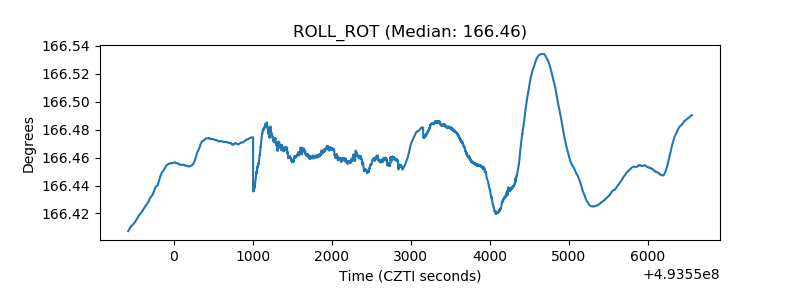 |
| _Roll_DEC | 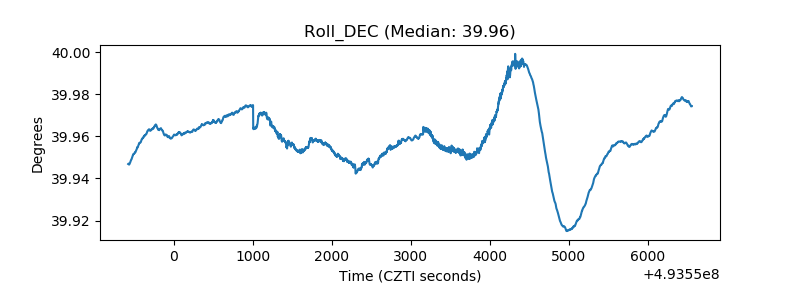 |
| _Roll_RA | 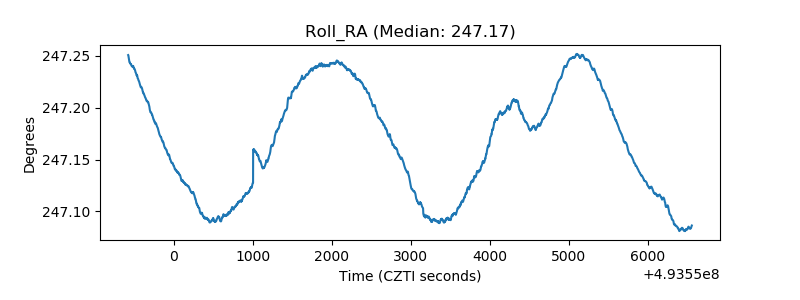 |
| Veto Counter | 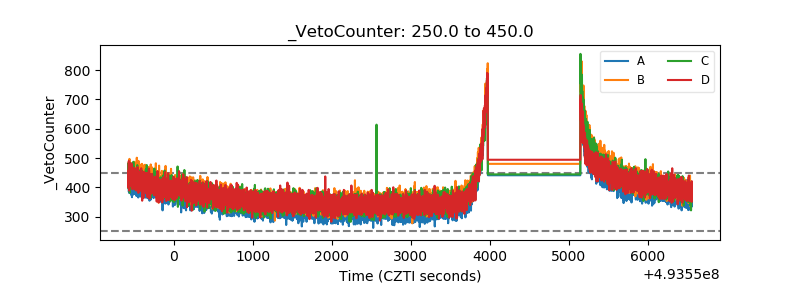 |