| Param | Original file | Final file |
|---|---|---|
| Filename | modeM0/AS1A14_004T05_9000006502_53559cztM0_level2.fits | modeM0/AS1A14_004T05_9000006502_53559cztM0_level2_quad_clean.evt |
| Size (bytes) | 903,706,560 | 67,380,480 |
| Size | 861.8 MB | 64.3 MB |
| Events in quadrant A | 8,539,233 | 411,451 |
| Events in quadrant B | 3,670,612 | 624,158 |
| Events in quadrant C | 10,584,441 | 301,987 |
| Events in quadrant D | 10,195,494 | 284,115 |
| Mode M9 | |||
|---|---|---|---|
| Quadrant | BADHDUFLAG | Total packets | Discarded packets |
| A | 0 | 10 | 0 |
| B | 0 | 10 | 0 |
| C | 0 | 10 | 0 |
| D | 0 | 10 | 0 |
| Mode SS | |||
|---|---|---|---|
| Quadrant | BADHDUFLAG | Total packets | Discarded packets |
| A | 0 | 122 | 0 |
| B | 0 | 122 | 0 |
| C | 0 | 122 | 0 |
| D | 0 | 122 | 0 |
| Mode M0 | |||
|---|---|---|---|
| Quadrant | BADHDUFLAG | Total packets | Discarded packets |
| A | 0 | 29499 | 1 |
| B | 0 | 14967 | 1 |
| C | 0 | 35455 | 1 |
| D | 0 | 34432 | 1 |
| Quadrant | Total seconds | Saturated seconds | Saturation percentage |
|---|---|---|---|
| A | 5986 | 2158 | 36.050785% |
| B | 5987 | 230 | 3.841657% |
| C | 5986 | 3013 | 50.334113% |
| D | 5986 | 3018 | 50.417641% |
Noise dominated data is calculated using 1-second bins in cleaned event files. If a bin has >2000 counts, and if more than 50% of those come from <1% of pixels, then it is considered to be noise-dominated and hence unusable.
| Quadrant | # 1 sec bins | Bins with >0 counts | Bins with >2000 counts | High rate bins dominated by noise | Noise dominated (total time) | Noise dominated (detector-on time) | Marked lightcurve |
|---|---|---|---|---|---|---|---|
| A | 7041 | 5987 | 1877 | 1877 | 26.66% | 31.35% | 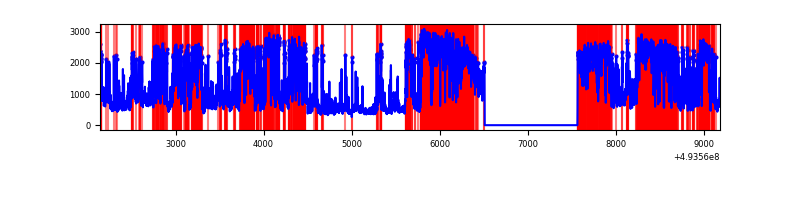 |
| B | 7042 | 5988 | 79 | 79 | 1.12% | 1.32% | 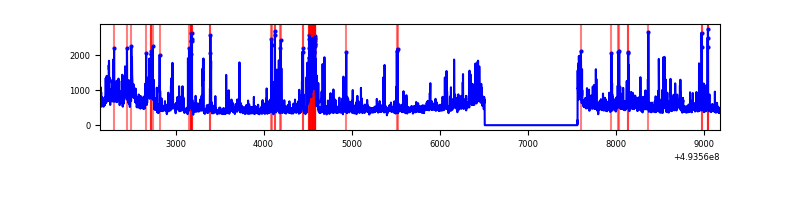 |
| C | 7041 | 5987 | 2989 | 2989 | 42.45% | 49.92% | 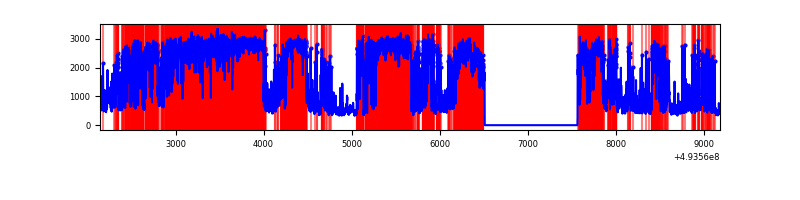 |
| D | 7041 | 5987 | 2533 | 2533 | 35.98% | 42.31% | 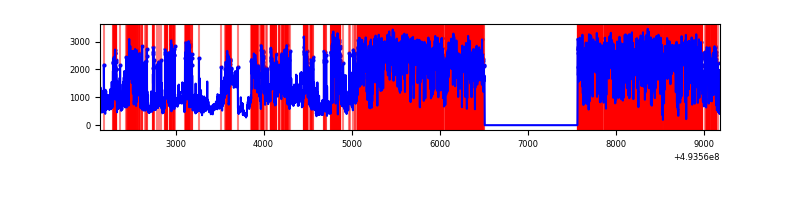 |
Top three noisy pixels from each quadrant. If the there are fewer than three noisy pixels in the level2.evt file, extra rows are filled as -1
| Pixel properties | Quadrant properties | ||||||
|---|---|---|---|---|---|---|---|
| Quadrant | DetID | PixID | Counts | Sigma | Mean | Median | Sigma |
| A | 3 | 63 | 2480704 | 18206.36 | 547 | 534 | 136.2 |
| A | 15 | 174 | 1408717 | 10337.15 | 547 | 534 | 136.2 |
| A | 12 | 115 | 927149 | 6802.07 | 547 | 534 | 136.2 |
| B | 10 | 254 | 235989 | 1707.74 | 645 | 625 | 137.8 |
| B | 5 | 185 | 228678 | 1654.7 | 645 | 625 | 137.8 |
| B | 0 | 213 | 151819 | 1097.03 | 645 | 625 | 137.8 |
| C | 1 | 241 | 6382340 | 51551.74 | 445 | 442 | 123.8 |
| C | 15 | 224 | 1018106 | 8220.49 | 445 | 442 | 123.8 |
| C | 12 | 254 | 699658 | 5648.13 | 445 | 442 | 123.8 |
| D | 8 | 176 | 6138311 | 52095.96 | 406 | 387 | 117.8 |
| D | 2 | 62 | 511602 | 4338.97 | 406 | 387 | 117.8 |
| D | 4 | 7 | 480995 | 4079.19 | 406 | 387 | 117.8 |
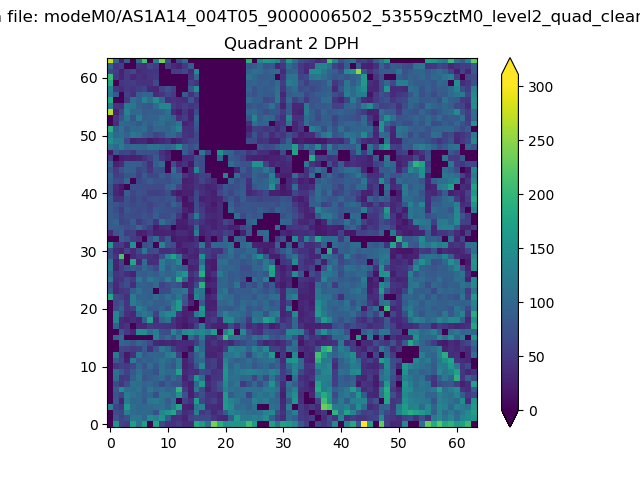
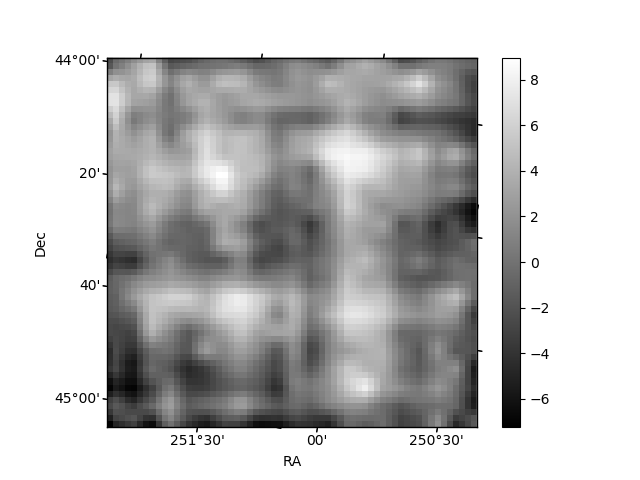
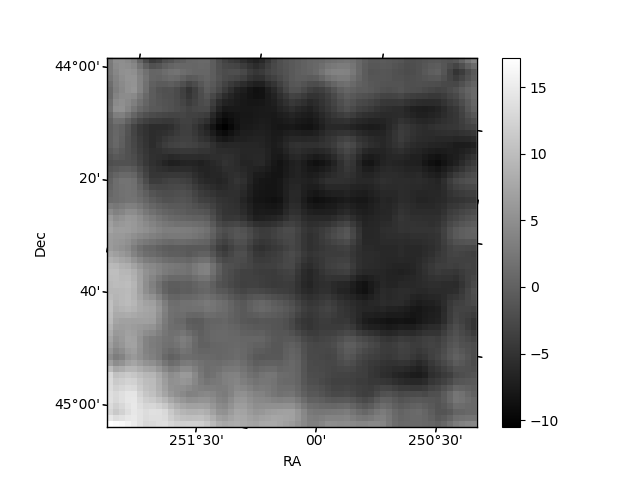
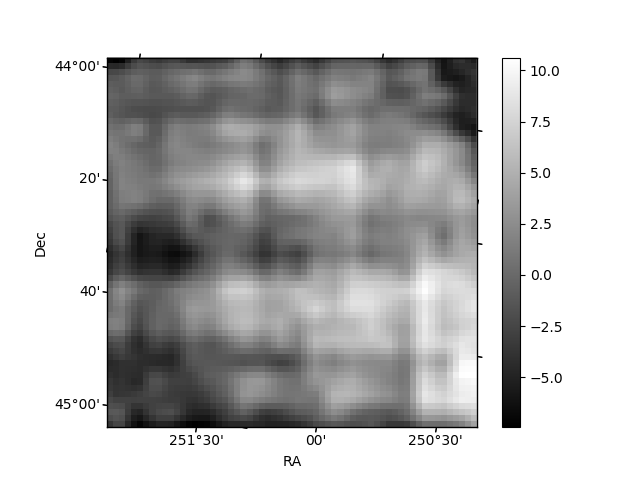
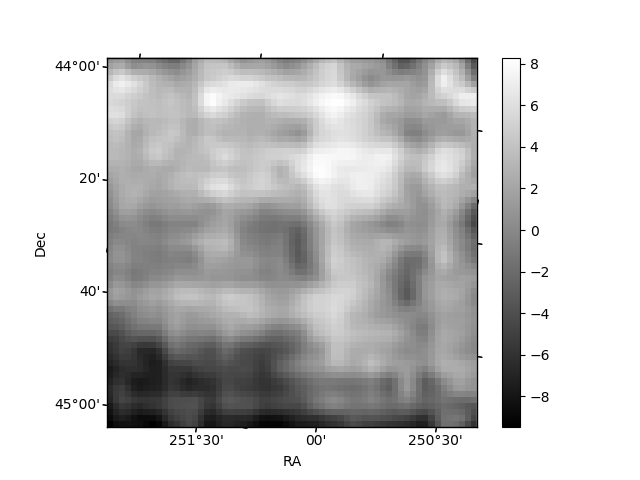
Histogram calculated using DETX and DETY for each event in the final _common_clean file
| Quadrant A | 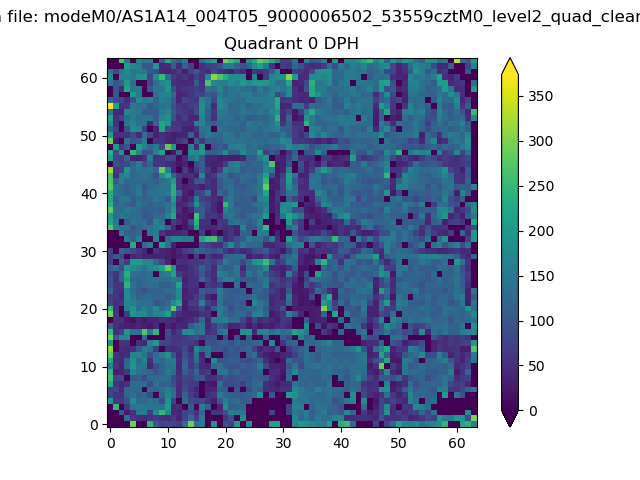 |
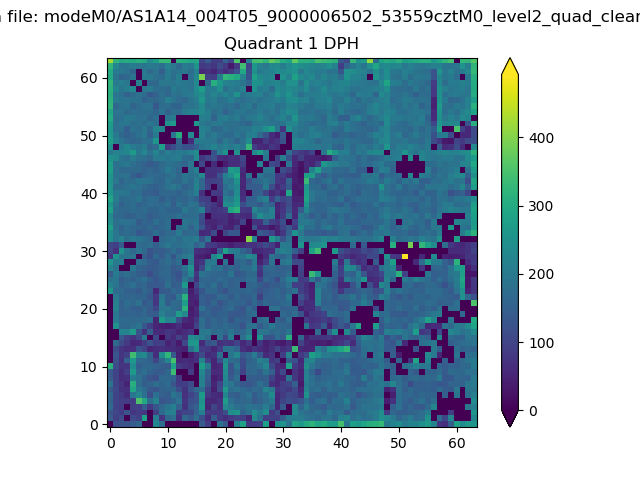 |
Quadrant B |
|---|---|---|---|
| Quadrant D | 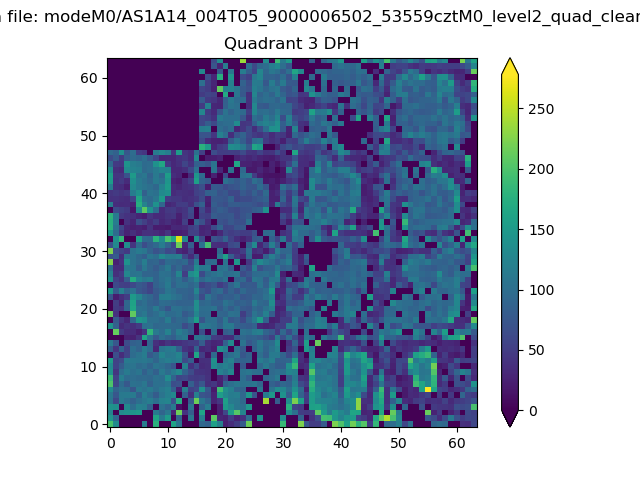 |
 |
Quadrant C |
| Plot type | Count rate plots | Images |
|---|---|---|
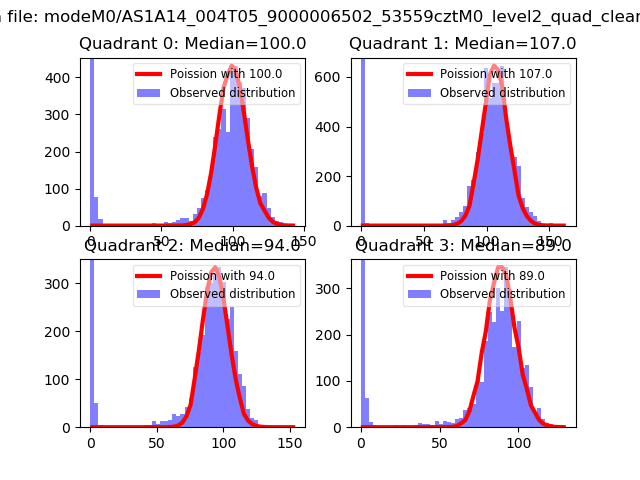
| Comparison with Poisson distribution Blue bars denote a histogram of data divided into 1 sec bins. Red curve is a Poisson curve with rate = median count rate of data. |
 |
 |
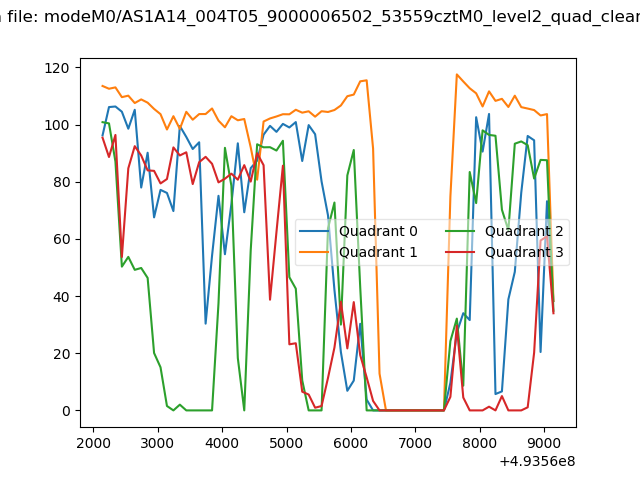
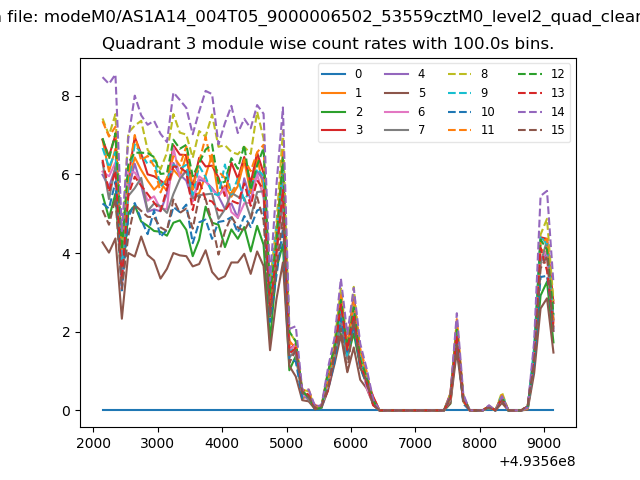
| Quadrant-wise count rates Data is divided into 100 sec bins |
 |
|
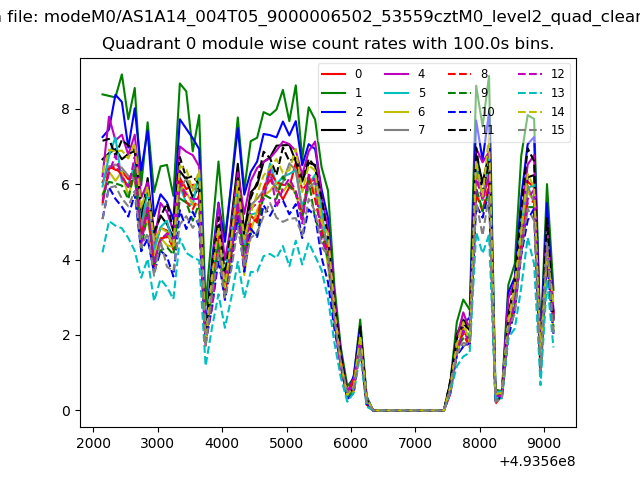
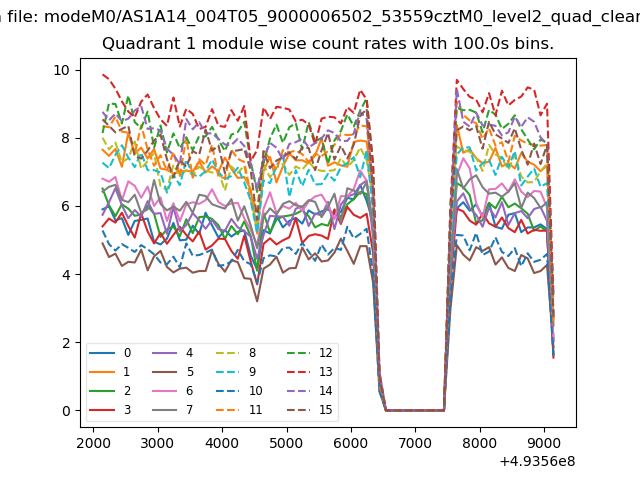
| Module-wise count rates for Quadrant A Data is divided into 100 sec bins |
 |
 |
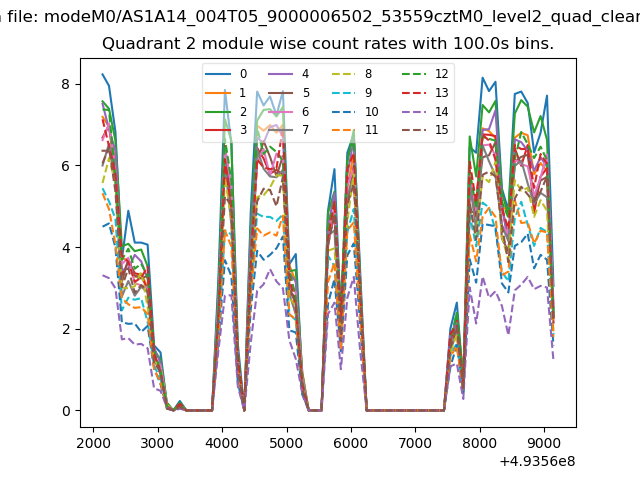
| Module-wise count rates for Quadrant B Data is divided into 100 sec bins |
 |
 |
| Module-wise count rates for Quadrant C Data is divided into 100 sec bins |
 |
 |
| Module-wise count rates for Quadrant D Data is divided into 100 sec bins |
 |
 |
| Parameter | Plot |
|---|---|
| CZT HV Monitor | 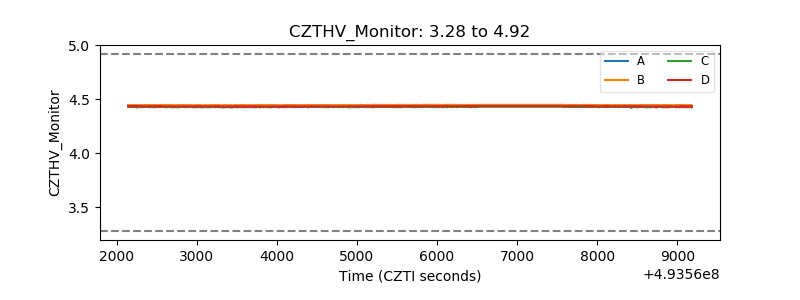 |
| D_VDD | 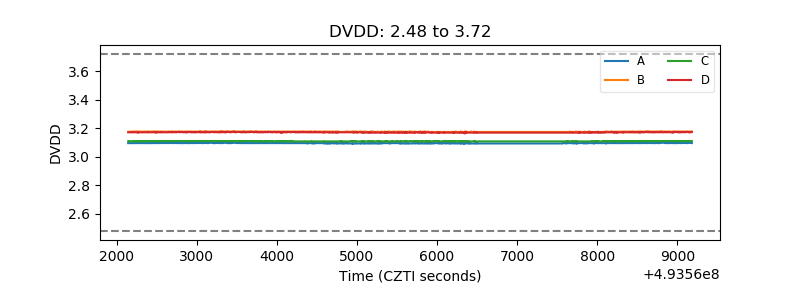 |
| Temperature 1 | 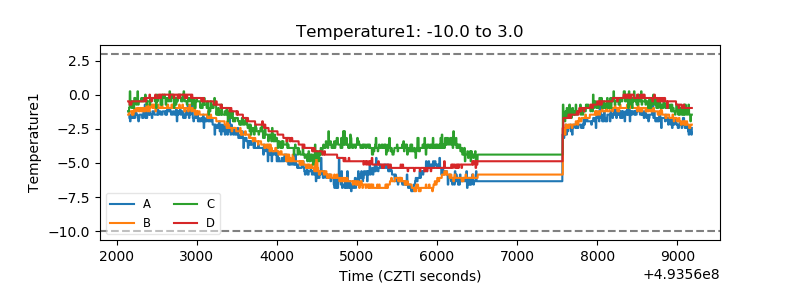 |
| Veto HV Monitor | 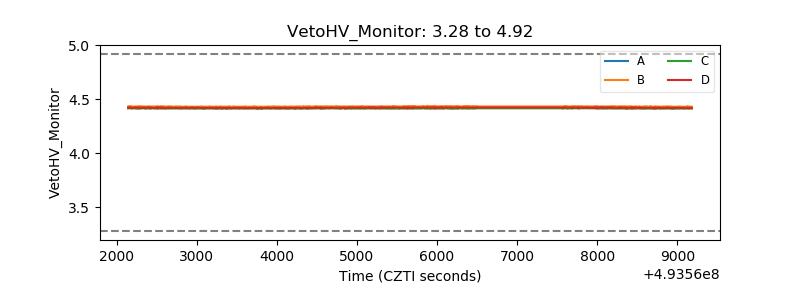 |
| Veto LLD | 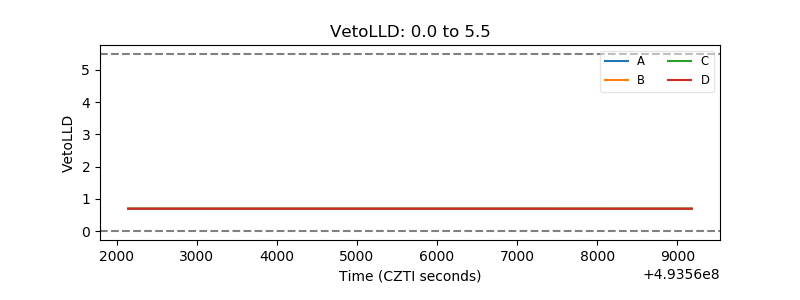 |
| Alpha Counter | 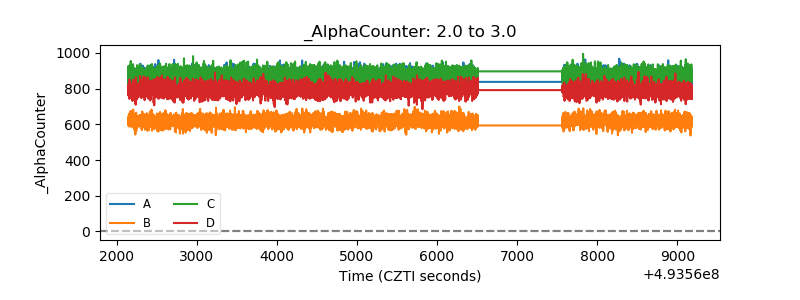 |
| _CPM_Rate | 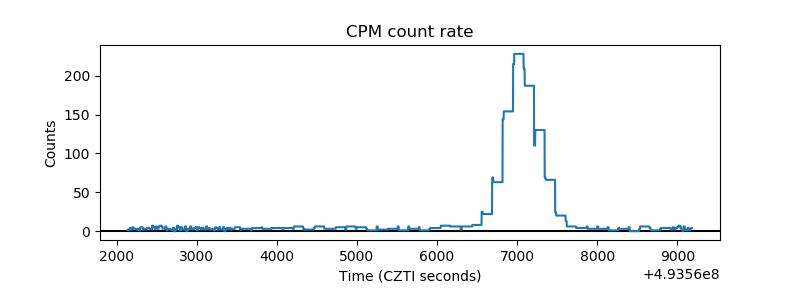 |
| CZT Counter | 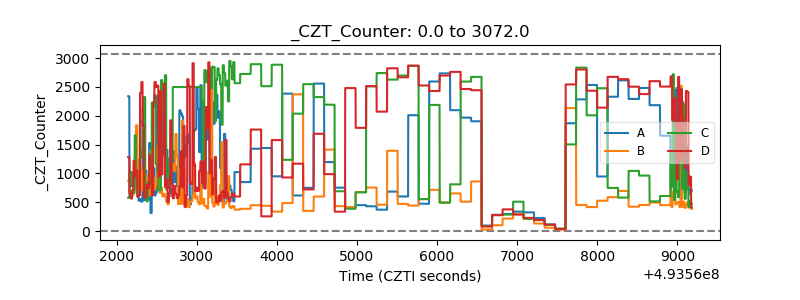 |
| +2.5 Volts monitor |  |
| +5 Volts monitor | 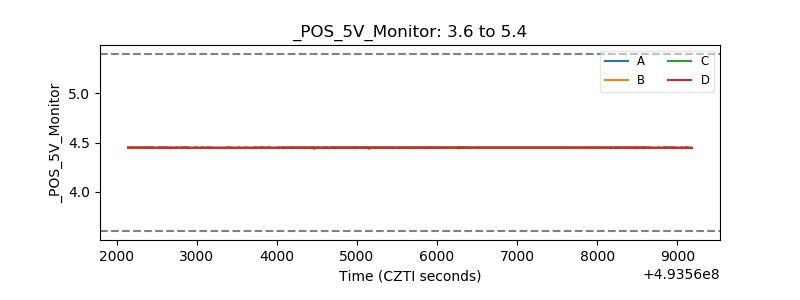 |
| _ROLL_ROT | 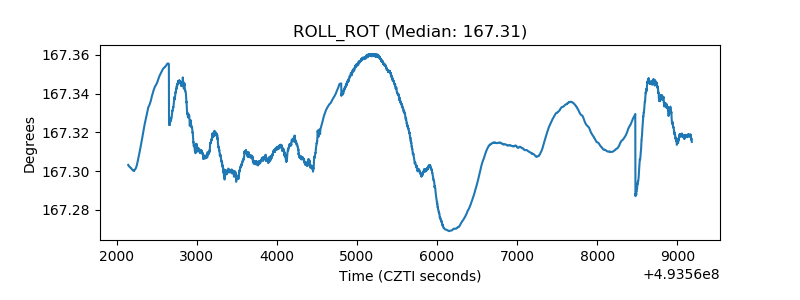 |
| _Roll_DEC | 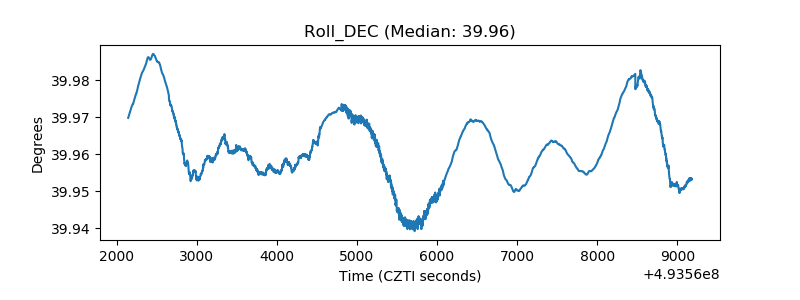 |
| _Roll_RA | 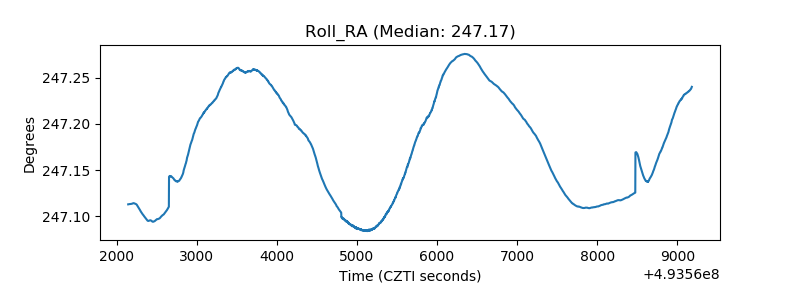 |
| Veto Counter | 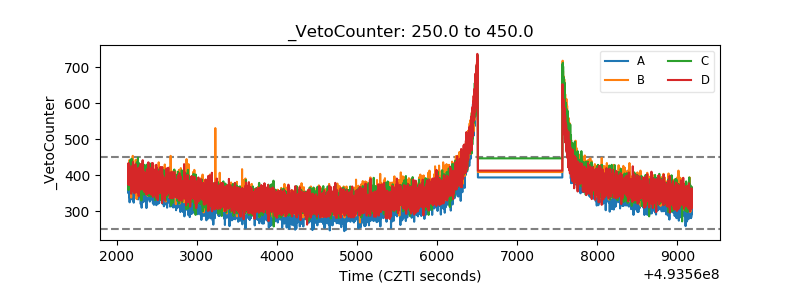 |