| Param | Original file | Final file |
|---|---|---|
| Filename | modeM0/AS1A14_004T05_9000006502_53561cztM0_level2.fits | modeM0/AS1A14_004T05_9000006502_53561cztM0_level2_quad_clean.evt |
| Size (bytes) | 981,204,480 | 90,846,720 |
| Size | 935.7 MB | 86.6 MB |
| Events in quadrant A | 12,967,679 | 406,986 |
| Events in quadrant B | 4,627,743 | 772,958 |
| Events in quadrant C | 9,596,440 | 534,474 |
| Events in quadrant D | 8,537,695 | 503,656 |
| Mode M9 | |||
|---|---|---|---|
| Quadrant | BADHDUFLAG | Total packets | Discarded packets |
| A | 0 | 1 | 0 |
| B | 0 | 1 | 0 |
| C | 0 | 1 | 0 |
| D | 0 | 1 | 0 |
| Mode SS | |||
|---|---|---|---|
| Quadrant | BADHDUFLAG | Total packets | Discarded packets |
| A | 0 | 156 | 0 |
| B | 0 | 156 | 0 |
| C | 0 | 156 | 0 |
| D | 0 | 156 | 0 |
| Mode M0 | |||
|---|---|---|---|
| Quadrant | BADHDUFLAG | Total packets | Discarded packets |
| A | 0 | 43747 | 2 |
| B | 0 | 19122 | 2 |
| C | 0 | 33799 | 2 |
| D | 0 | 30724 | 2 |
| Quadrant | Total seconds | Saturated seconds | Saturation percentage |
|---|---|---|---|
| A | 7644 | 3913 | 51.190476% |
| B | 7644 | 341 | 4.461015% |
| C | 7645 | 2082 | 27.233486% |
| D | 7645 | 2140 | 27.992152% |
Noise dominated data is calculated using 1-second bins in cleaned event files. If a bin has >2000 counts, and if more than 50% of those come from <1% of pixels, then it is considered to be noise-dominated and hence unusable.
| Quadrant | # 1 sec bins | Bins with >0 counts | Bins with >2000 counts | High rate bins dominated by noise | Noise dominated (total time) | Noise dominated (detector-on time) | Marked lightcurve |
|---|---|---|---|---|---|---|---|
| A | 7749 | 7646 | 3374 | 3374 | 43.54% | 44.13% | 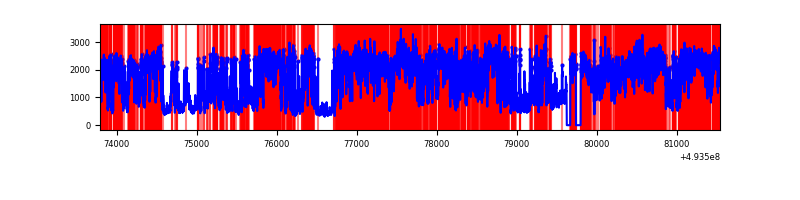 |
| B | 7749 | 7646 | 130 | 130 | 1.68% | 1.70% | 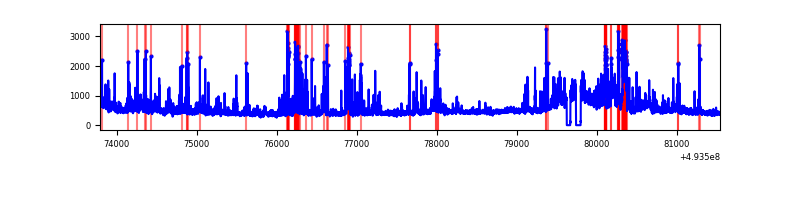 |
| C | 7750 | 7647 | 1757 | 1757 | 22.67% | 22.98% | 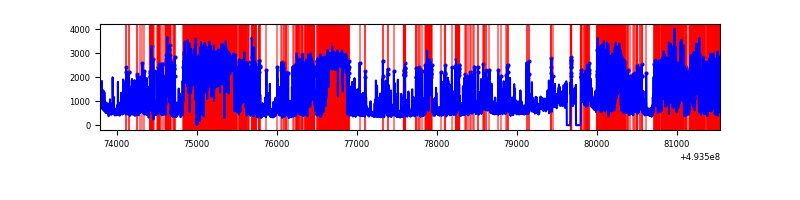 |
| D | 7750 | 7647 | 1556 | 1556 | 20.08% | 20.35% | 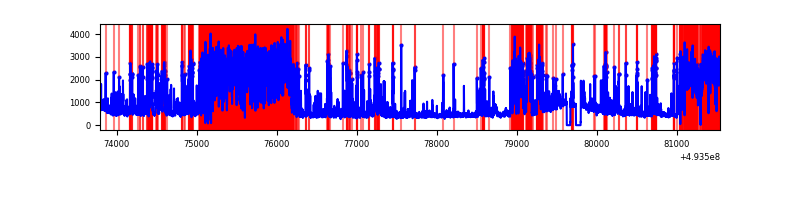 |
Top three noisy pixels from each quadrant. If the there are fewer than three noisy pixels in the level2.evt file, extra rows are filled as -1
| Pixel properties | Quadrant properties | ||||||
|---|---|---|---|---|---|---|---|
| Quadrant | DetID | PixID | Counts | Sigma | Mean | Median | Sigma |
| A | 3 | 63 | 5240892 | 32229.98 | 651 | 633 | 162.6 |
| A | 15 | 174 | 2249913 | 13834.1 | 651 | 633 | 162.6 |
| A | 3 | 62 | 1244263 | 7648.89 | 651 | 633 | 162.6 |
| B | 2 | 249 | 468909 | 2593.52 | 841 | 811 | 180.5 |
| B | 5 | 185 | 202209 | 1115.86 | 841 | 811 | 180.5 |
| B | 0 | 213 | 125488 | 690.78 | 841 | 811 | 180.5 |
| C | 15 | 224 | 3188561 | 15997.62 | 720 | 710 | 199.3 |
| C | 1 | 241 | 1431346 | 7179.37 | 720 | 710 | 199.3 |
| C | 4 | 5 | 1093803 | 5485.48 | 720 | 710 | 199.3 |
| D | 8 | 176 | 3495923 | 17826.04 | 685 | 655 | 196.1 |
| D | 3 | 12 | 1125166 | 5735.06 | 685 | 655 | 196.1 |
| D | 2 | 120 | 199927 | 1016.3 | 685 | 655 | 196.1 |
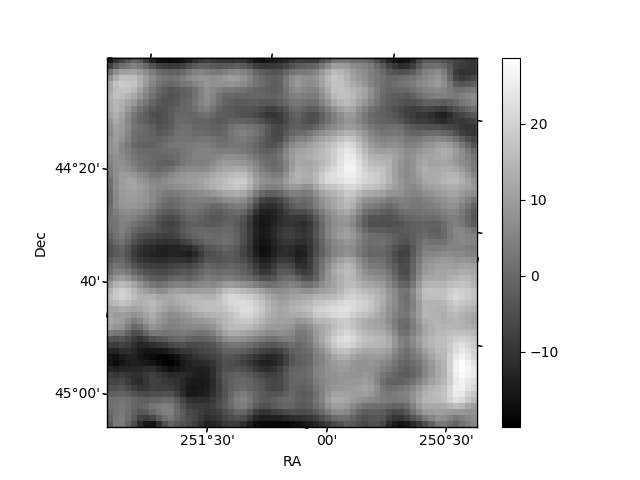
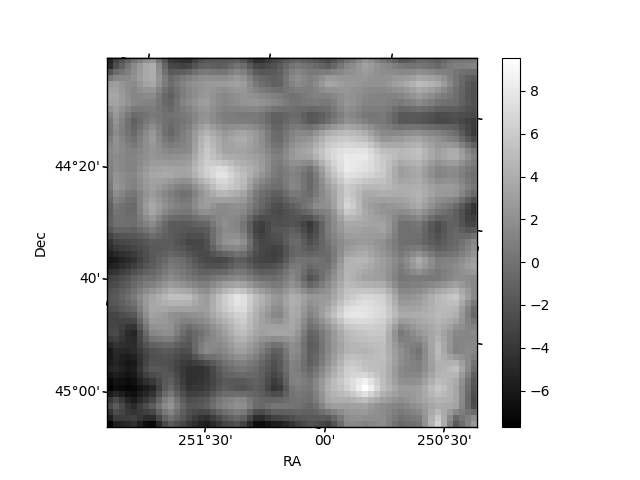
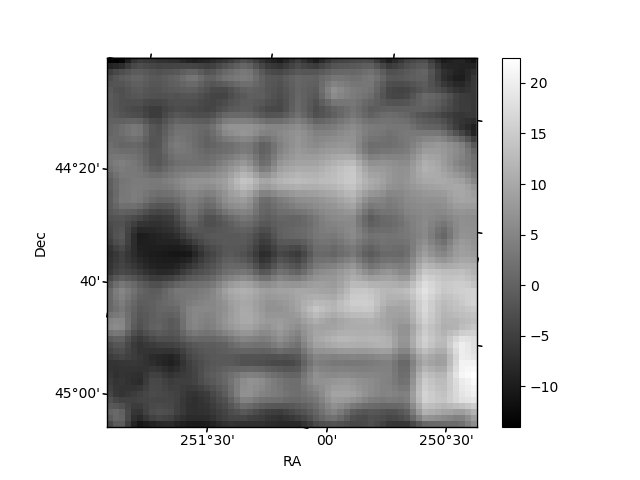
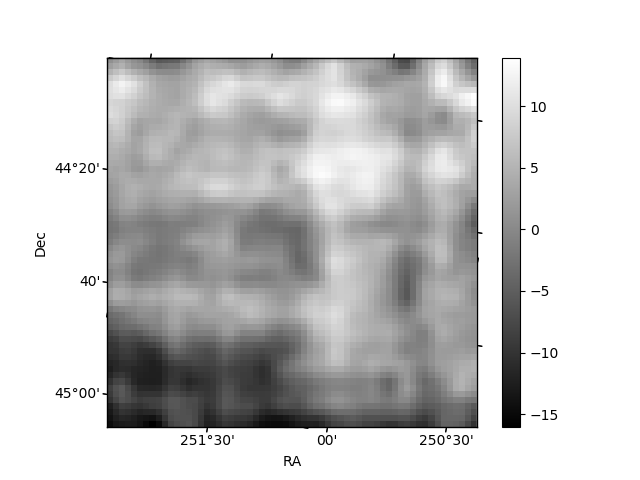
Histogram calculated using DETX and DETY for each event in the final _common_clean file
| Quadrant A | 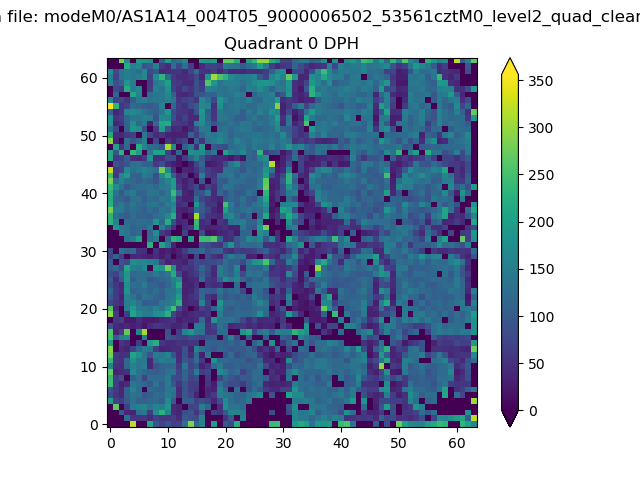 |
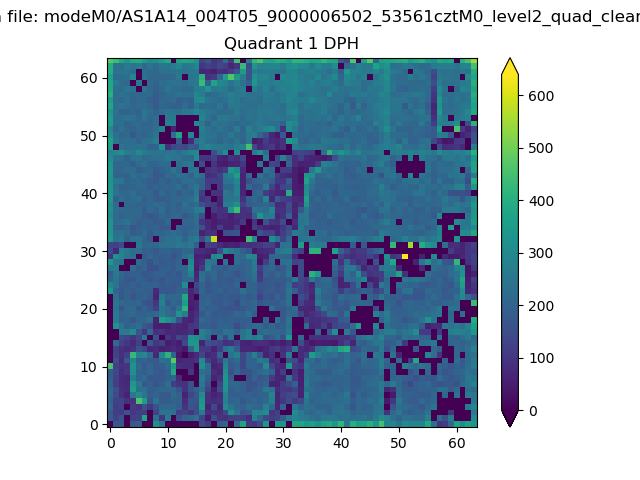 |
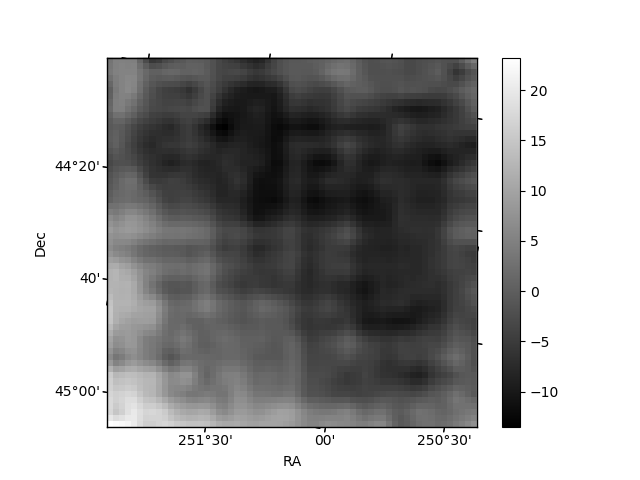
Quadrant B |
|---|---|---|---|
| Quadrant D | 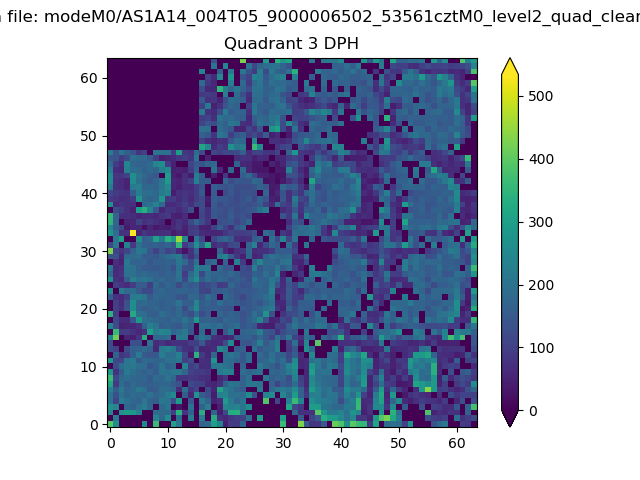 |
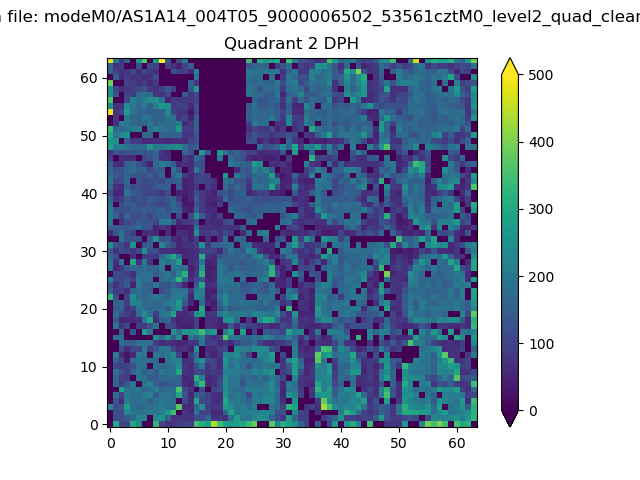 |
Quadrant C |
| Plot type | Count rate plots | Images |
|---|---|---|
| Comparison with Poisson distribution Blue bars denote a histogram of data divided into 1 sec bins. Red curve is a Poisson curve with rate = median count rate of data. |
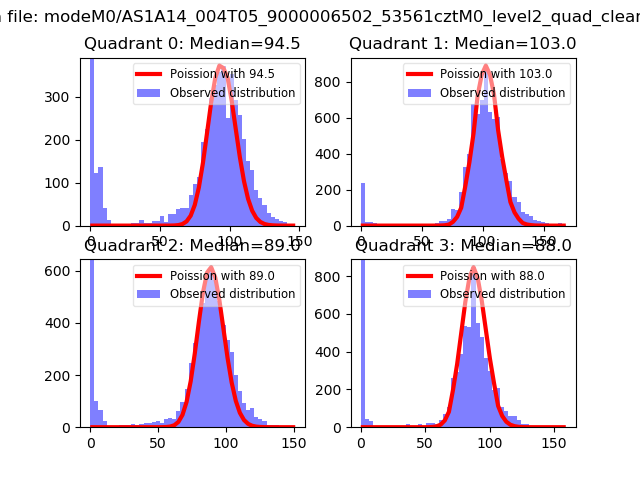 |
 |
| Quadrant-wise count rates Data is divided into 100 sec bins |
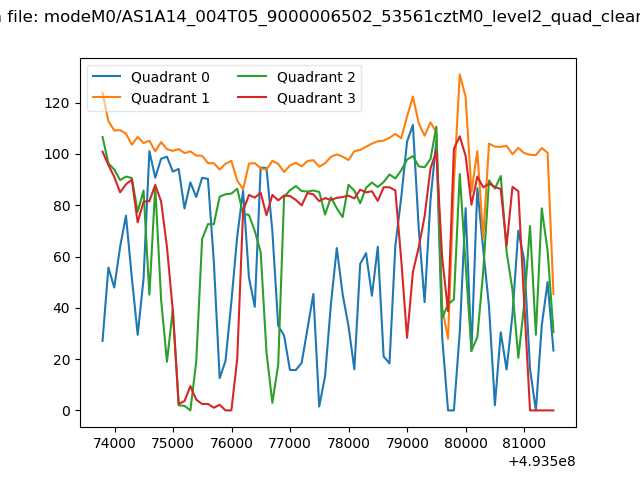 |
|
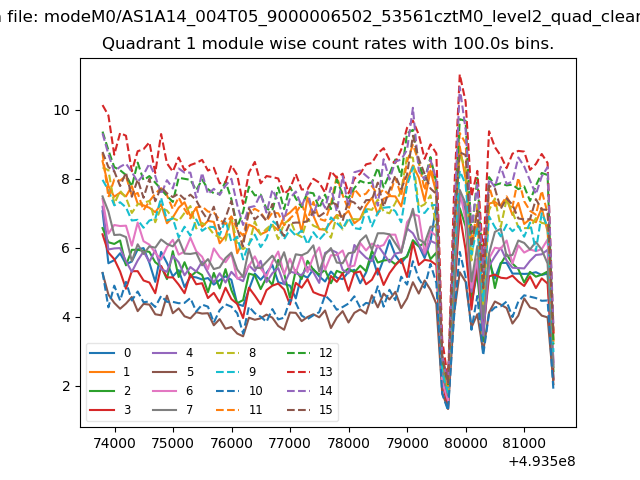
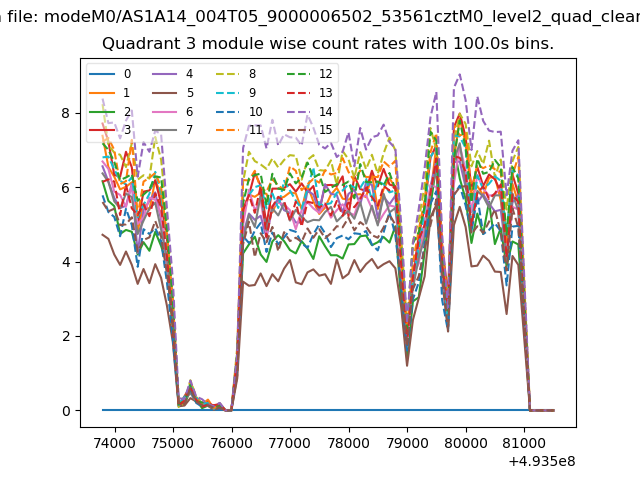
| Module-wise count rates for Quadrant A Data is divided into 100 sec bins |
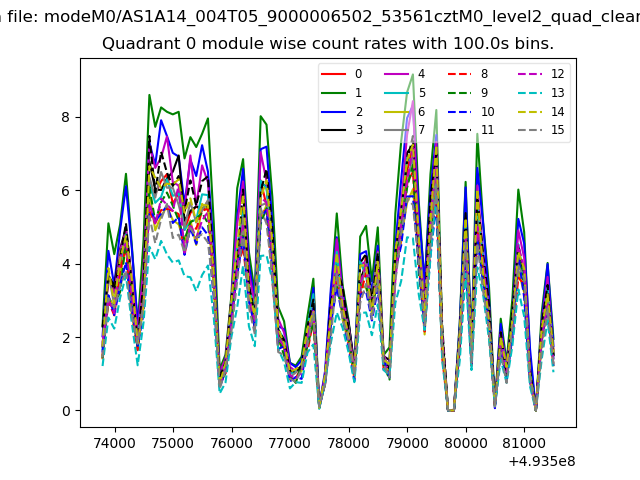 |
 |
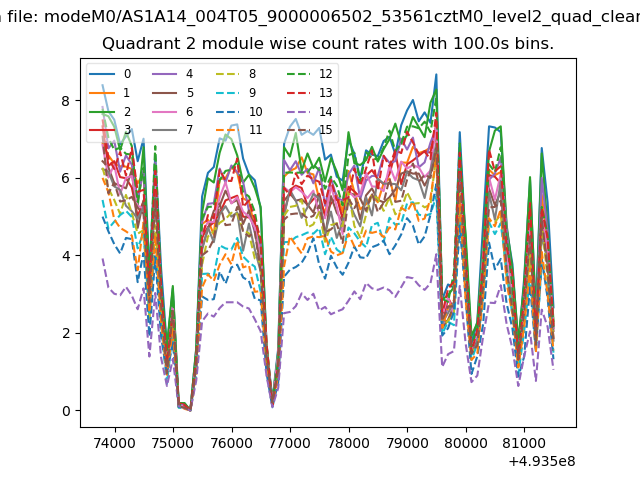
| Module-wise count rates for Quadrant B Data is divided into 100 sec bins |
 |
 |
| Module-wise count rates for Quadrant C Data is divided into 100 sec bins |
 |
 |
| Module-wise count rates for Quadrant D Data is divided into 100 sec bins |
 |
 |
| Parameter | Plot |
|---|---|
| CZT HV Monitor | 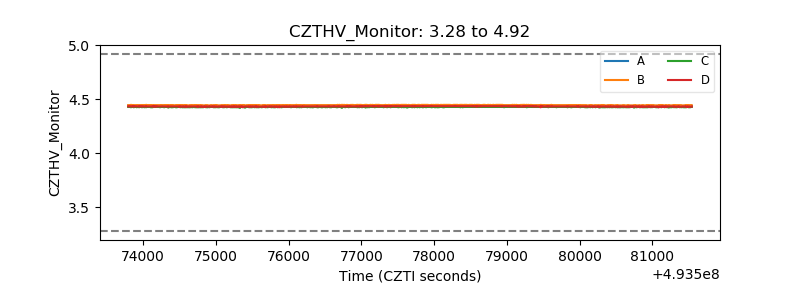 |
| D_VDD | 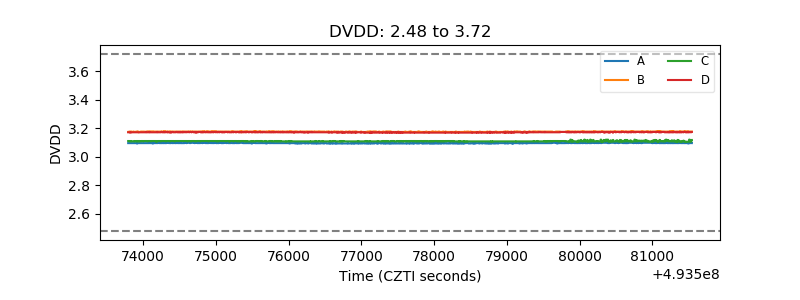 |
| Temperature 1 | 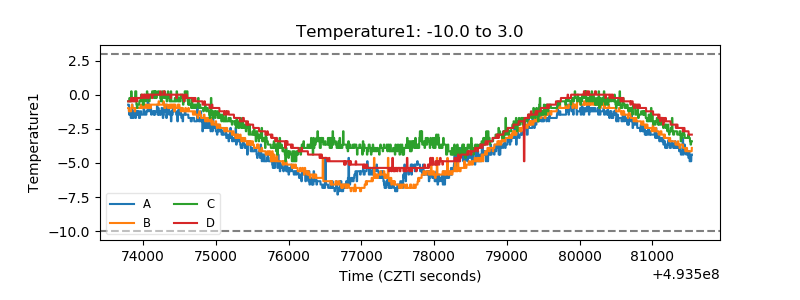 |
| Veto HV Monitor | 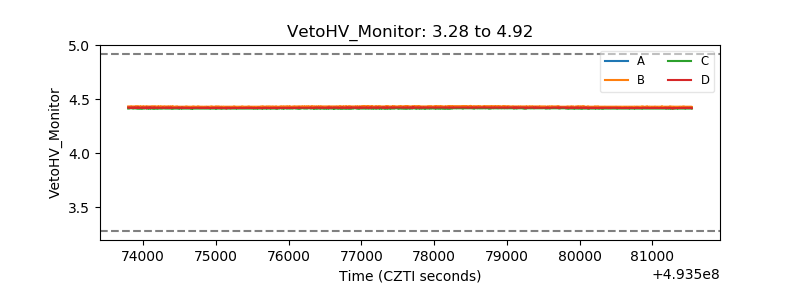 |
| Veto LLD | 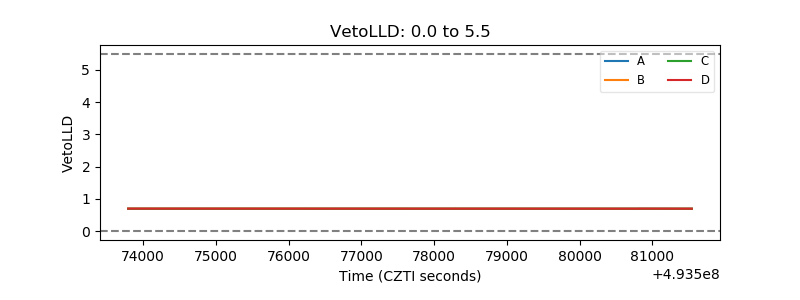 |
| Alpha Counter | 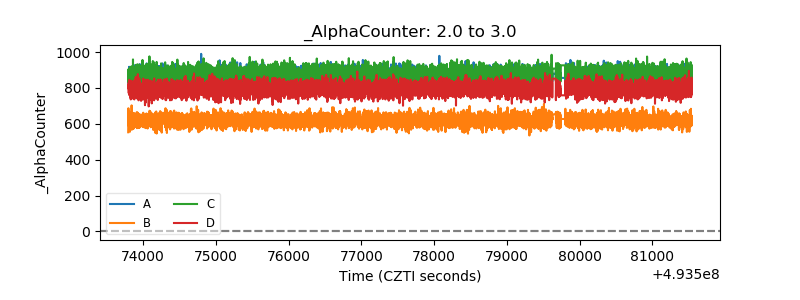 |
| _CPM_Rate | 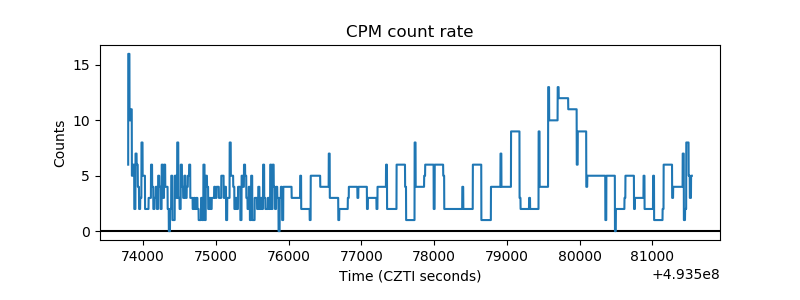 |
| CZT Counter | 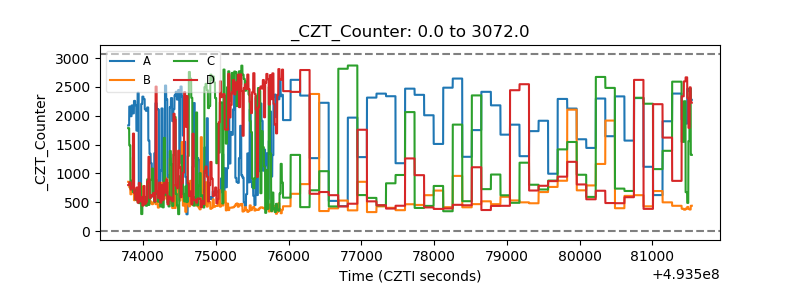 |
| +2.5 Volts monitor | 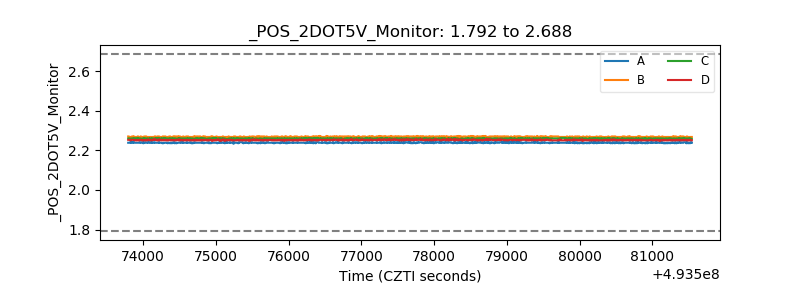 |
| +5 Volts monitor | 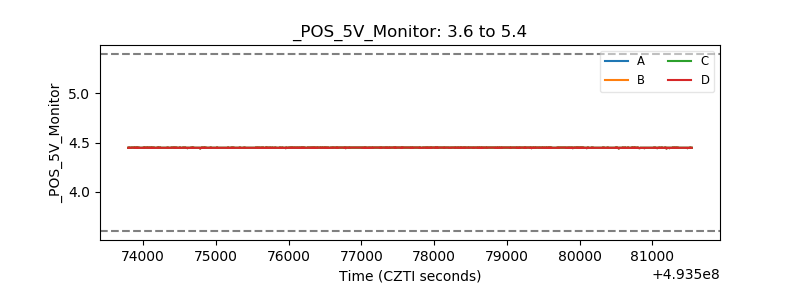 |
| _ROLL_ROT | 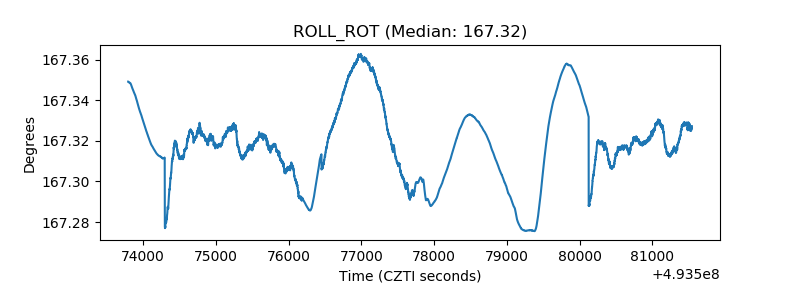 |
| _Roll_DEC | 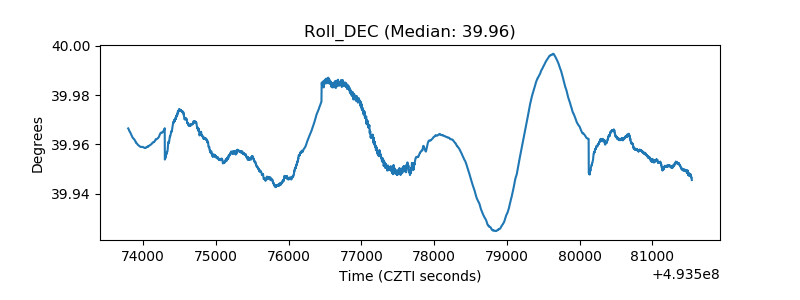 |
| _Roll_RA | 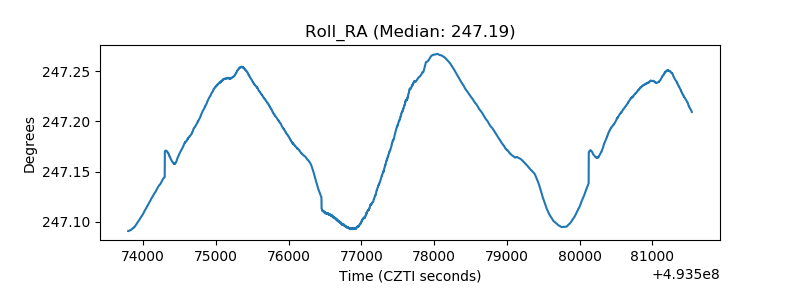 |
| Veto Counter | 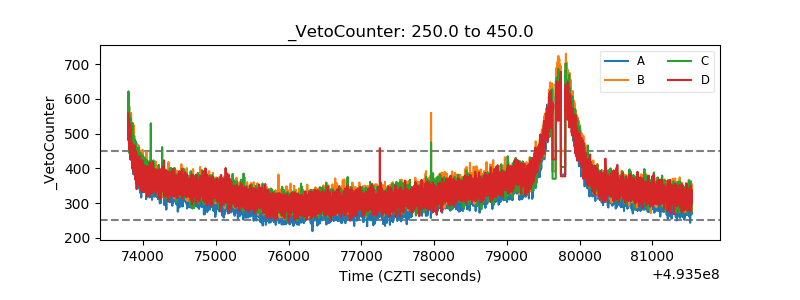 |