| Param | Original file | Final file |
|---|---|---|
| Filename | modeM0/AS1A14_004T05_9000006502_53562cztM0_level2.fits | modeM0/AS1A14_004T05_9000006502_53562cztM0_level2_quad_clean.evt |
| Size (bytes) | 1,066,034,880 | 81,066,240 |
| Size | 1016.7 MB | 77.3 MB |
| Events in quadrant A | 14,772,042 | 250,961 |
| Events in quadrant B | 5,930,177 | 726,485 |
| Events in quadrant C | 8,565,464 | 565,223 |
| Events in quadrant D | 9,611,554 | 387,298 |
| Mode SS | |||
|---|---|---|---|
| Quadrant | BADHDUFLAG | Total packets | Discarded packets |
| A | 0 | 152 | 0 |
| B | 0 | 152 | 0 |
| C | 0 | 152 | 0 |
| D | 0 | 152 | 0 |
| Mode M0 | |||
|---|---|---|---|
| Quadrant | BADHDUFLAG | Total packets | Discarded packets |
| A | 0 | 49071 | 2 |
| B | 0 | 22911 | 0 |
| C | 0 | 30680 | 0 |
| D | 0 | 33806 | 0 |
| Quadrant | Total seconds | Saturated seconds | Saturation percentage |
|---|---|---|---|
| A | 7525 | 5206 | 69.182724% |
| B | 7526 | 549 | 7.294712% |
| C | 7526 | 1556 | 20.674993% |
| D | 7526 | 3140 | 41.722030% |
Noise dominated data is calculated using 1-second bins in cleaned event files. If a bin has >2000 counts, and if more than 50% of those come from <1% of pixels, then it is considered to be noise-dominated and hence unusable.
| Quadrant | # 1 sec bins | Bins with >0 counts | Bins with >2000 counts | High rate bins dominated by noise | Noise dominated (total time) | Noise dominated (detector-on time) | Marked lightcurve |
|---|---|---|---|---|---|---|---|
| A | 7525 | 7525 | 4480 | 4480 | 59.53% | 59.53% | 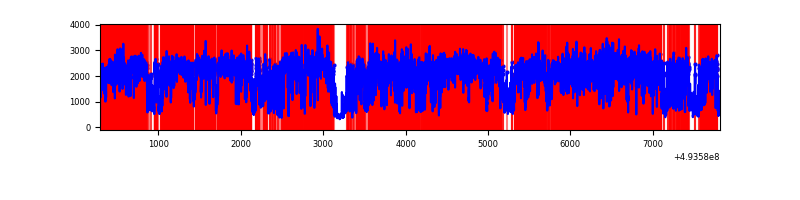 |
| B | 7526 | 7526 | 479 | 479 | 6.36% | 6.36% | 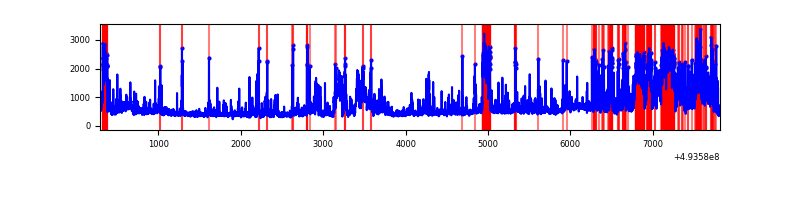 |
| C | 7526 | 7526 | 1283 | 1283 | 17.05% | 17.05% | 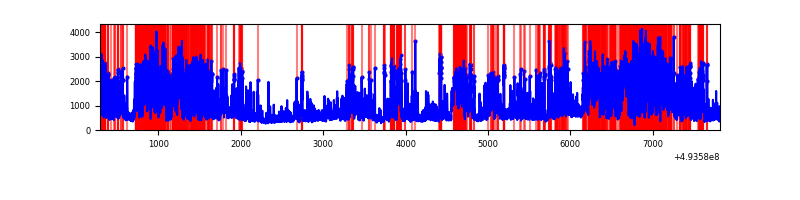 |
| D | 7526 | 7526 | 2162 | 2162 | 28.73% | 28.73% | 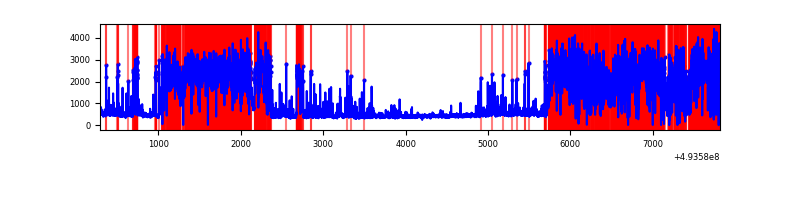 |
Top three noisy pixels from each quadrant. If the there are fewer than three noisy pixels in the level2.evt file, extra rows are filled as -1
| Pixel properties | Quadrant properties | ||||||
|---|---|---|---|---|---|---|---|
| Quadrant | DetID | PixID | Counts | Sigma | Mean | Median | Sigma |
| A | 3 | 63 | 7725307 | 61211.91 | 499 | 486 | 126.2 |
| A | 3 | 62 | 1776338 | 14071.95 | 499 | 486 | 126.2 |
| A | 4 | 239 | 1608578 | 12742.61 | 499 | 486 | 126.2 |
| B | 10 | 254 | 1269896 | 7514.88 | 782 | 756 | 168.9 |
| B | 2 | 249 | 1009627 | 5973.76 | 782 | 756 | 168.9 |
| B | 0 | 213 | 106758 | 627.66 | 782 | 756 | 168.9 |
| C | 15 | 224 | 3710214 | 18723.63 | 715 | 707 | 198.1 |
| C | 15 | 231 | 430240 | 2168.06 | 715 | 707 | 198.1 |
| C | 13 | 3 | 317006 | 1596.51 | 715 | 707 | 198.1 |
| D | 8 | 176 | 6740498 | 44667.03 | 519 | 496 | 150.9 |
| D | 2 | 120 | 136298 | 899.98 | 519 | 496 | 150.9 |
| D | 3 | 12 | 128776 | 850.13 | 519 | 496 | 150.9 |
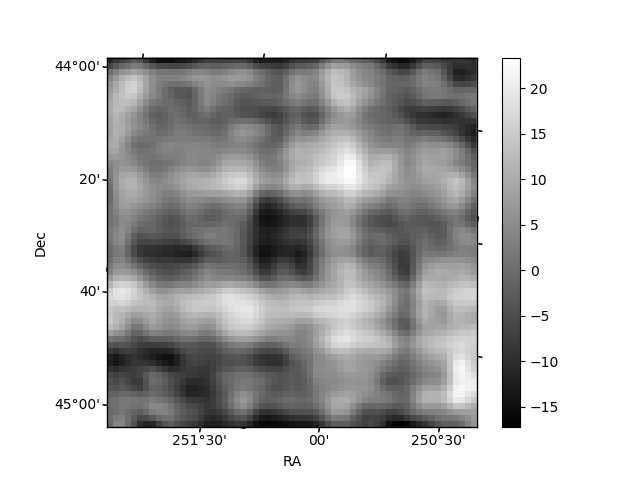
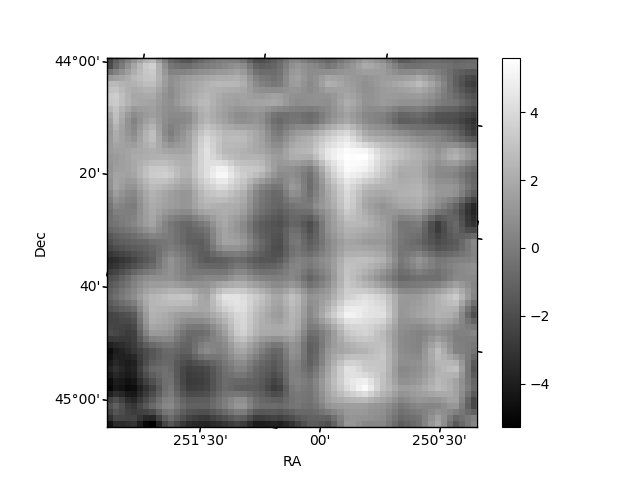
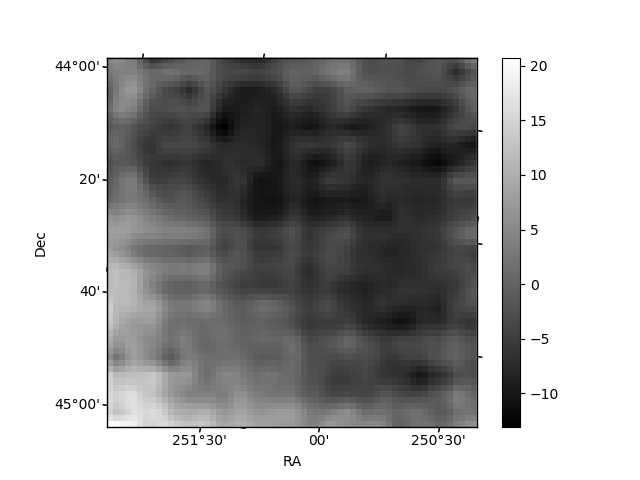
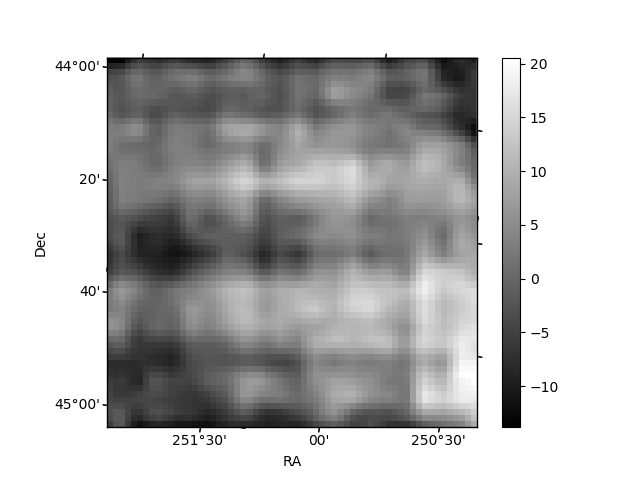
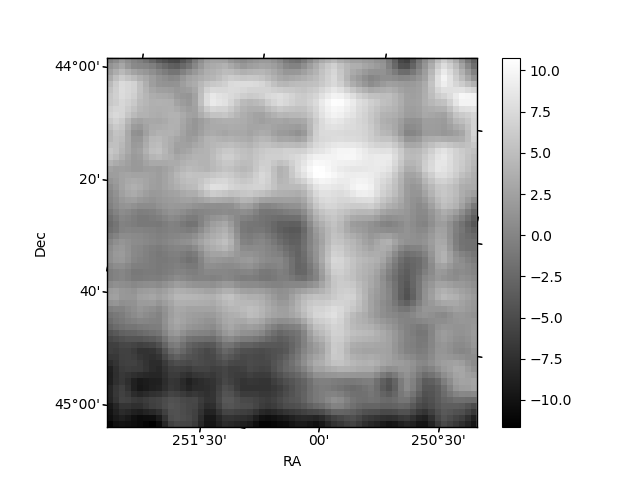
Histogram calculated using DETX and DETY for each event in the final _common_clean file
| Quadrant A | 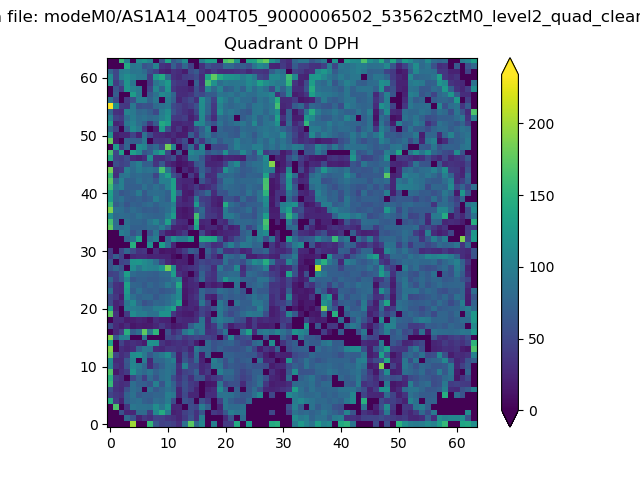 |
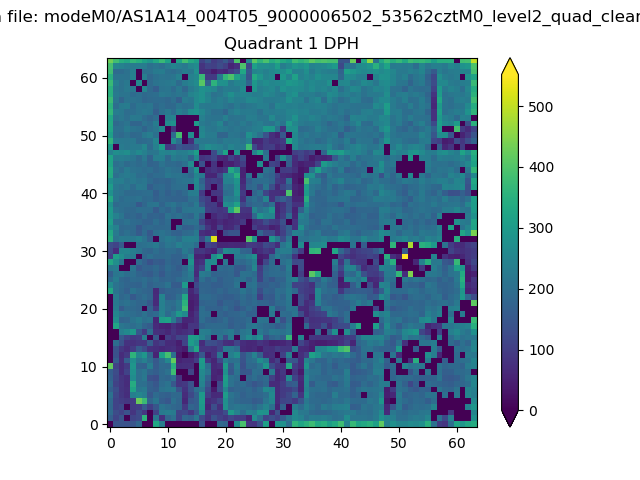 |
Quadrant B |
|---|---|---|---|
| Quadrant D | 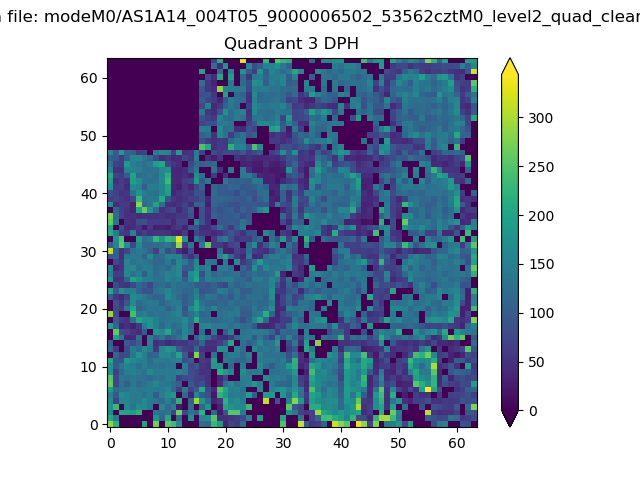 |
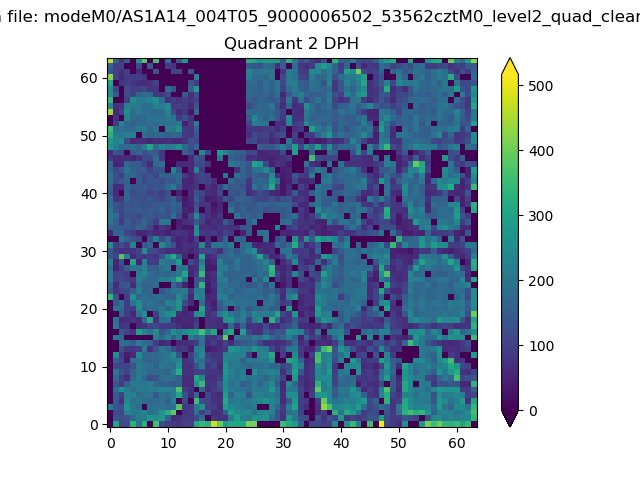 |
Quadrant C |
| Plot type | Count rate plots | Images |
|---|---|---|
| Comparison with Poisson distribution Blue bars denote a histogram of data divided into 1 sec bins. Red curve is a Poisson curve with rate = median count rate of data. |
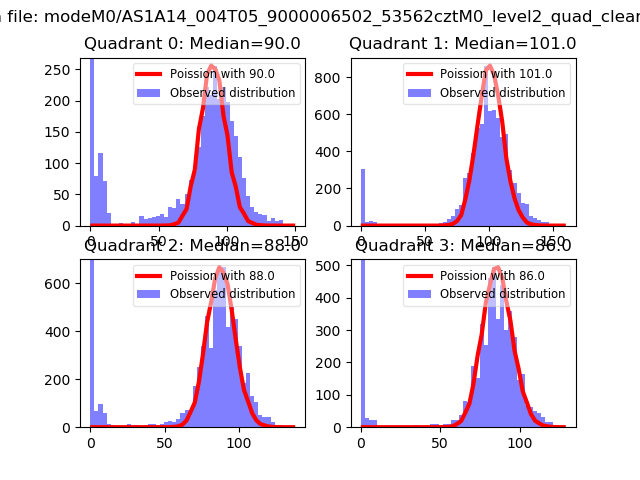 |
 |
| Quadrant-wise count rates Data is divided into 100 sec bins |
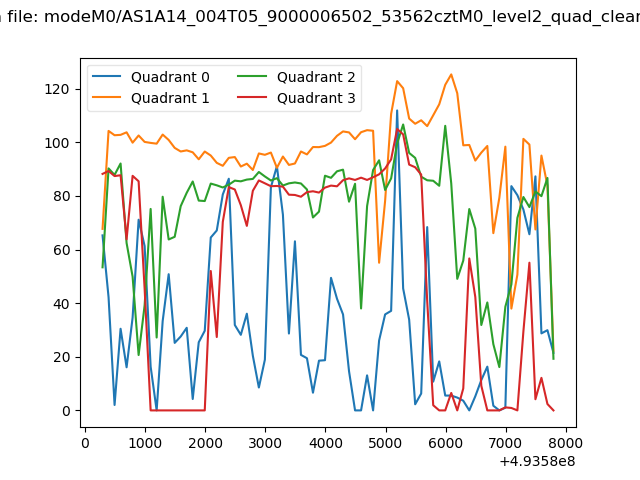 |
|
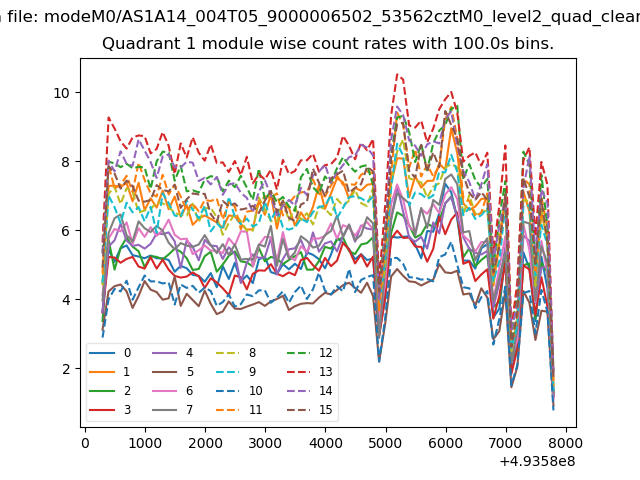
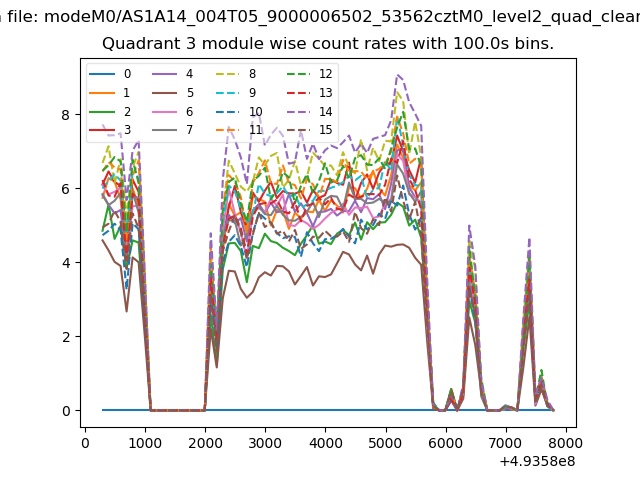
| Module-wise count rates for Quadrant A Data is divided into 100 sec bins |
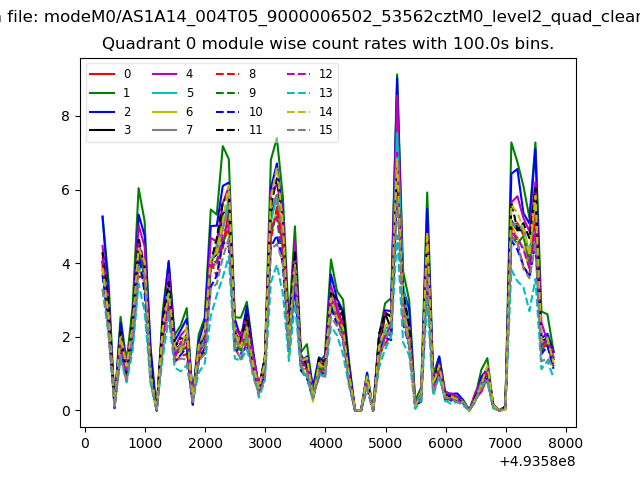 |
 |
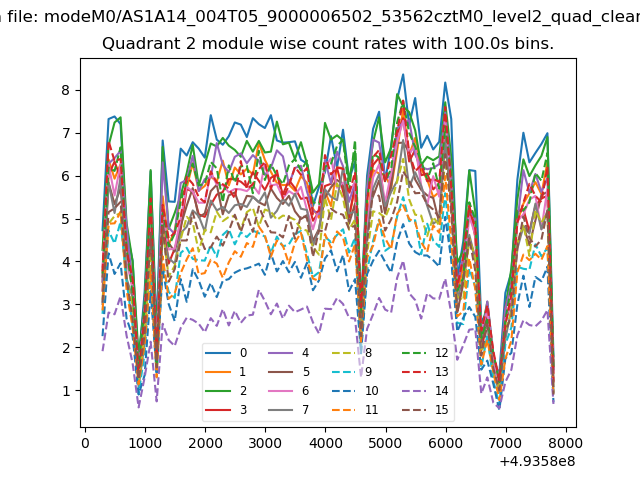
| Module-wise count rates for Quadrant B Data is divided into 100 sec bins |
 |
 |
| Module-wise count rates for Quadrant C Data is divided into 100 sec bins |
 |
 |
| Module-wise count rates for Quadrant D Data is divided into 100 sec bins |
 |
 |
| Parameter | Plot |
|---|---|
| CZT HV Monitor |  |
| D_VDD | 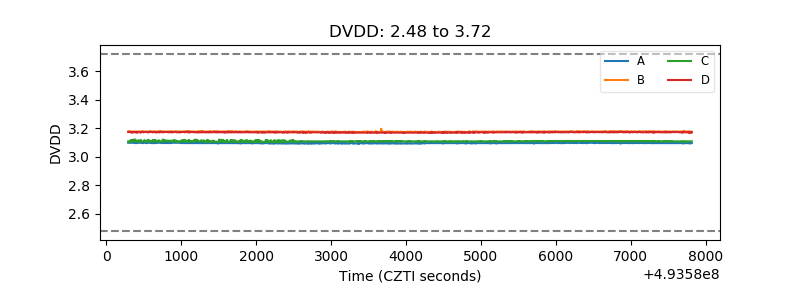 |
| Temperature 1 | 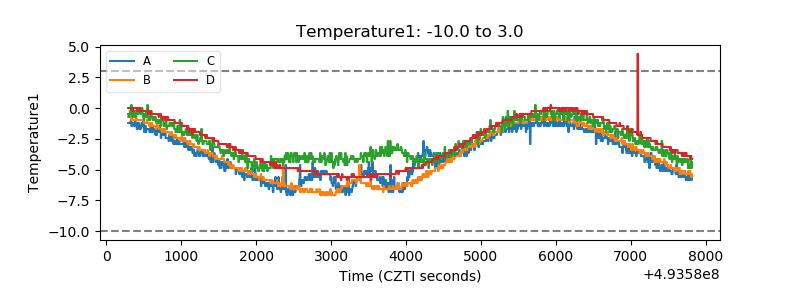 |
| Veto HV Monitor | 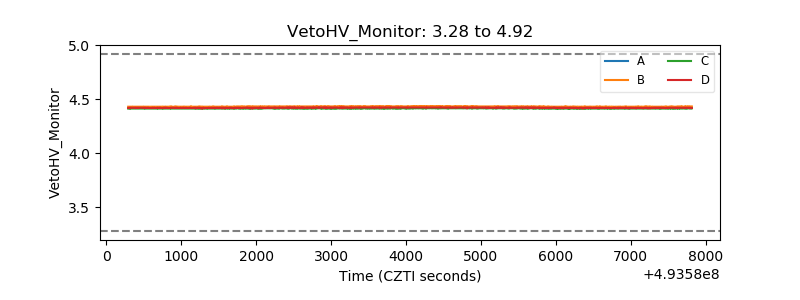 |
| Veto LLD | 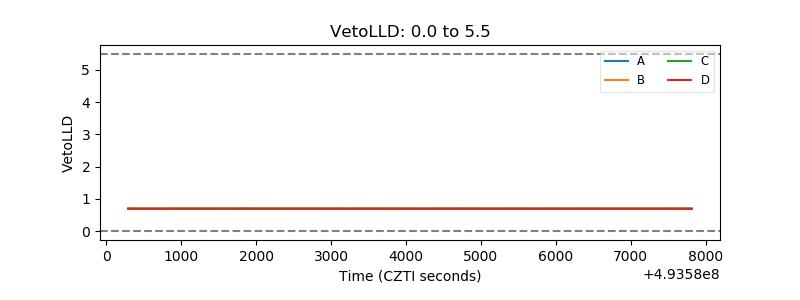 |
| Alpha Counter | 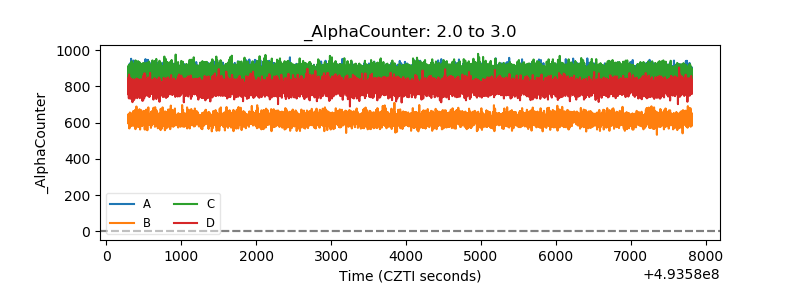 |
| _CPM_Rate | 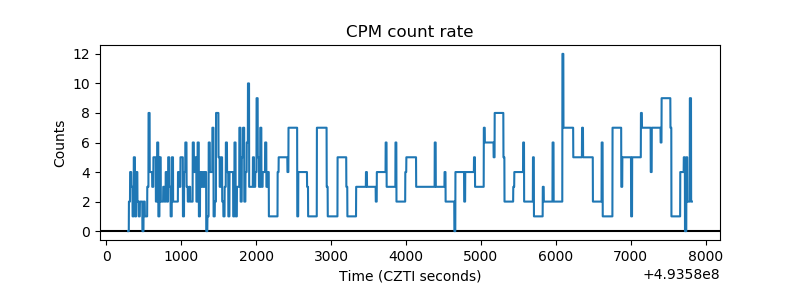 |
| CZT Counter | 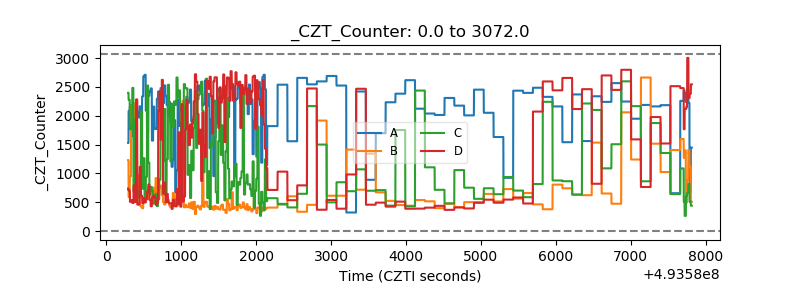 |
| +2.5 Volts monitor |  |
| +5 Volts monitor |  |
| _ROLL_ROT | 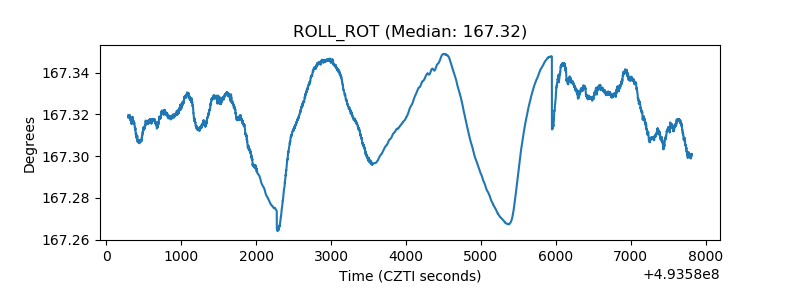 |
| _Roll_DEC | 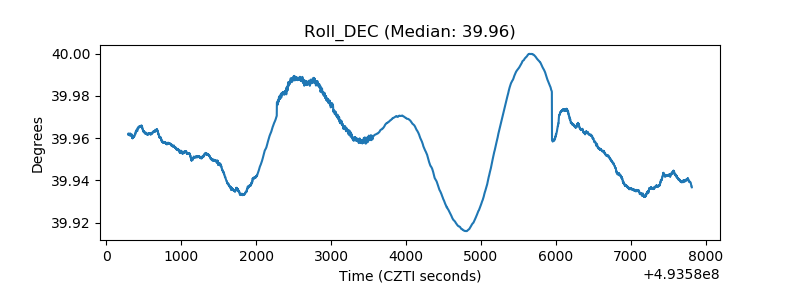 |
| _Roll_RA | 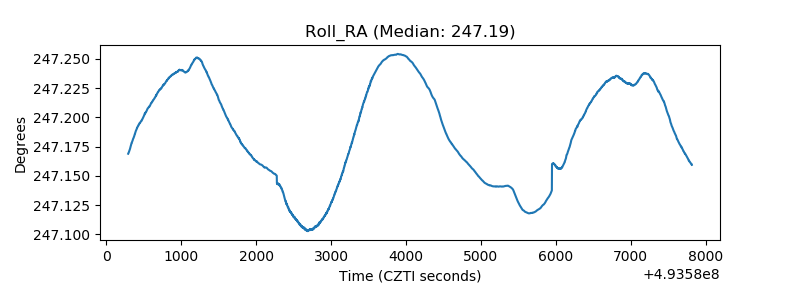 |
| Veto Counter | 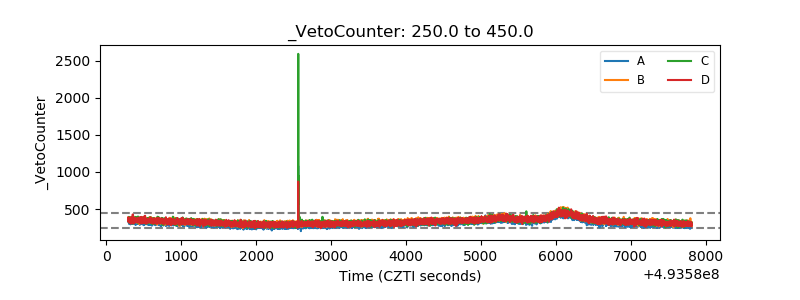 |