| Param | Original file | Final file |
|---|---|---|
| Filename | modeM0/AS1A14_004T05_9000006502_53563cztM0_level2.fits | modeM0/AS1A14_004T05_9000006502_53563cztM0_level2_quad_clean.evt |
| Size (bytes) | 1,080,889,920 | 83,062,080 |
| Size | 1.0 GB | 79.2 MB |
| Events in quadrant A | 9,727,897 | 528,896 |
| Events in quadrant B | 7,308,838 | 678,526 |
| Events in quadrant C | 8,946,535 | 554,176 |
| Events in quadrant D | 13,442,715 | 226,070 |
| Mode SS | |||
|---|---|---|---|
| Quadrant | BADHDUFLAG | Total packets | Discarded packets |
| A | 0 | 150 | 0 |
| B | 0 | 150 | 0 |
| C | 0 | 150 | 0 |
| D | 0 | 150 | 0 |
| Mode M0 | |||
|---|---|---|---|
| Quadrant | BADHDUFLAG | Total packets | Discarded packets |
| A | 0 | 34099 | 0 |
| B | 0 | 27010 | 0 |
| C | 0 | 31882 | 0 |
| D | 0 | 45156 | 1 |
| Quadrant | Total seconds | Saturated seconds | Saturation percentage |
|---|---|---|---|
| A | 7576 | 2242 | 29.593453% |
| B | 7577 | 1080 | 14.253662% |
| C | 7577 | 1696 | 22.383529% |
| D | 7576 | 5010 | 66.129884% |
Noise dominated data is calculated using 1-second bins in cleaned event files. If a bin has >2000 counts, and if more than 50% of those come from <1% of pixels, then it is considered to be noise-dominated and hence unusable.
| Quadrant | # 1 sec bins | Bins with >0 counts | Bins with >2000 counts | High rate bins dominated by noise | Noise dominated (total time) | Noise dominated (detector-on time) | Marked lightcurve |
|---|---|---|---|---|---|---|---|
| A | 7576 | 7576 | 1769 | 1769 | 23.35% | 23.35% | 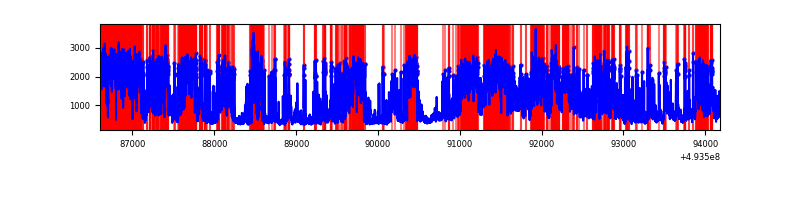 |
| B | 7577 | 7577 | 895 | 895 | 11.81% | 11.81% | 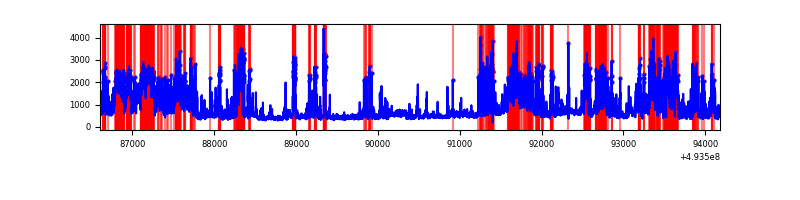 |
| C | 7577 | 7577 | 1480 | 1480 | 19.53% | 19.53% | 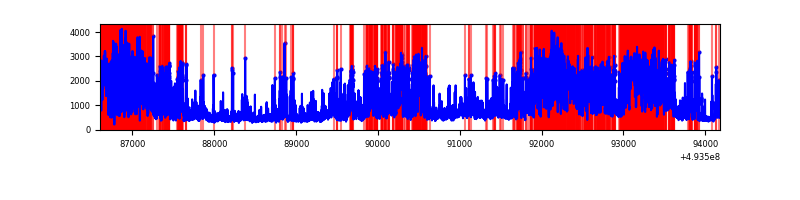 |
| D | 7576 | 7575 | 3497 | 3497 | 46.16% | 46.17% | 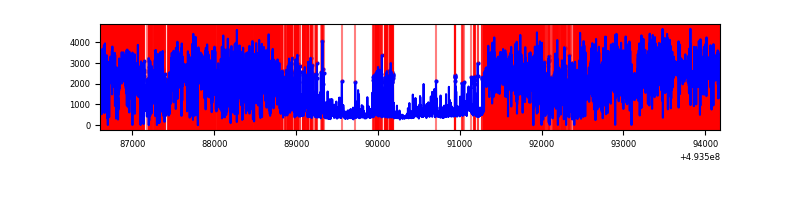 |
Top three noisy pixels from each quadrant. If the there are fewer than three noisy pixels in the level2.evt file, extra rows are filled as -1
| Pixel properties | Quadrant properties | ||||||
|---|---|---|---|---|---|---|---|
| Quadrant | DetID | PixID | Counts | Sigma | Mean | Median | Sigma |
| A | 3 | 63 | 3407930 | 19446.3 | 695 | 678 | 175.2 |
| A | 3 | 62 | 1865297 | 10641.99 | 695 | 678 | 175.2 |
| A | 4 | 239 | 616581 | 3515.16 | 695 | 678 | 175.2 |
| B | 2 | 249 | 2676048 | 16559.48 | 755 | 730 | 161.6 |
| B | 10 | 254 | 1091845 | 6753.7 | 755 | 730 | 161.6 |
| B | 7 | 0 | 218402 | 1347.33 | 755 | 730 | 161.6 |
| C | 15 | 224 | 3710468 | 18650.04 | 709 | 703 | 198.9 |
| C | 7 | 64 | 1299228 | 6528.05 | 709 | 703 | 198.9 |
| C | 7 | 80 | 524712 | 2634.34 | 709 | 703 | 198.9 |
| D | 8 | 176 | 10380556 | 94420.67 | 374 | 357 | 109.9 |
| D | 2 | 172 | 402954 | 3662.11 | 374 | 357 | 109.9 |
| D | 4 | 238 | 337313 | 3065.03 | 374 | 357 | 109.9 |
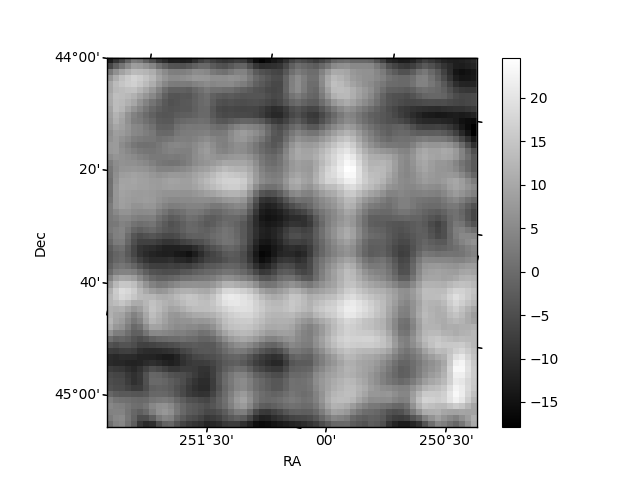
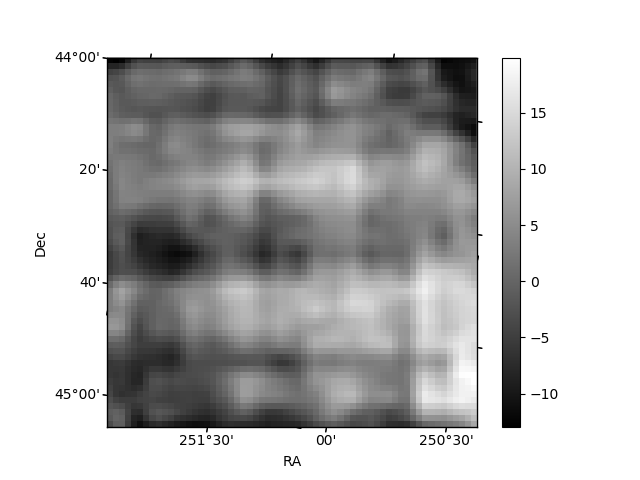
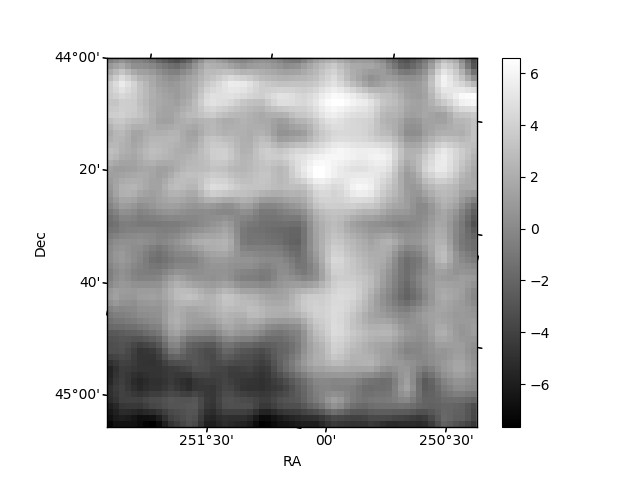
Histogram calculated using DETX and DETY for each event in the final _common_clean file
| Quadrant A | 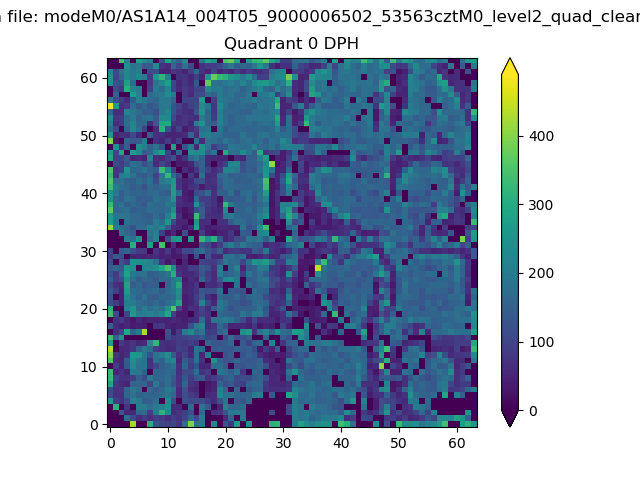 |
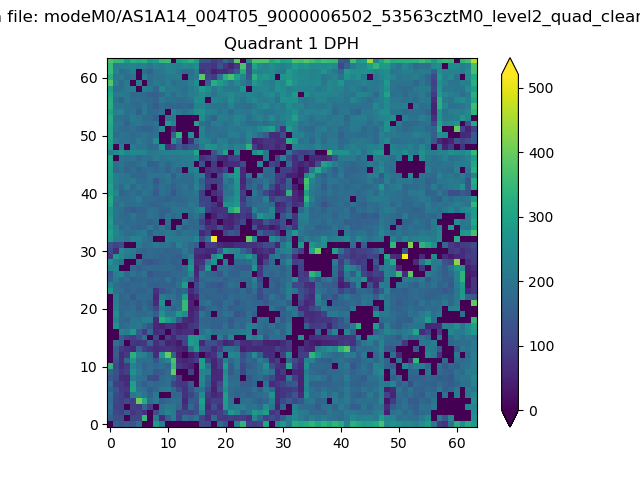 |
Quadrant B |
|---|---|---|---|
| Quadrant D | 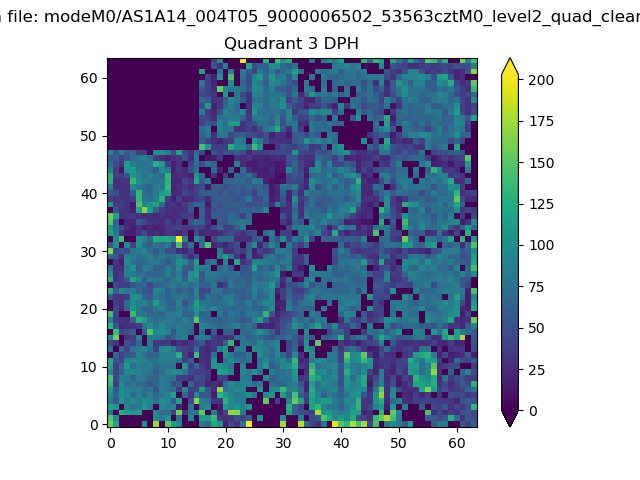 |
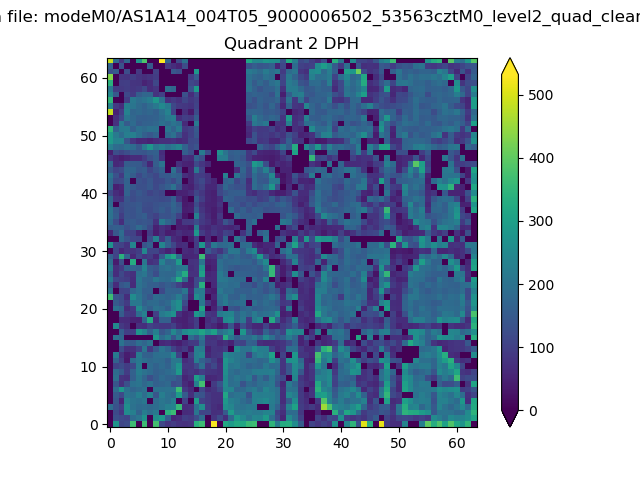 |
Quadrant C |
| Plot type | Count rate plots | Images |
|---|---|---|
| Comparison with Poisson distribution Blue bars denote a histogram of data divided into 1 sec bins. Red curve is a Poisson curve with rate = median count rate of data. |
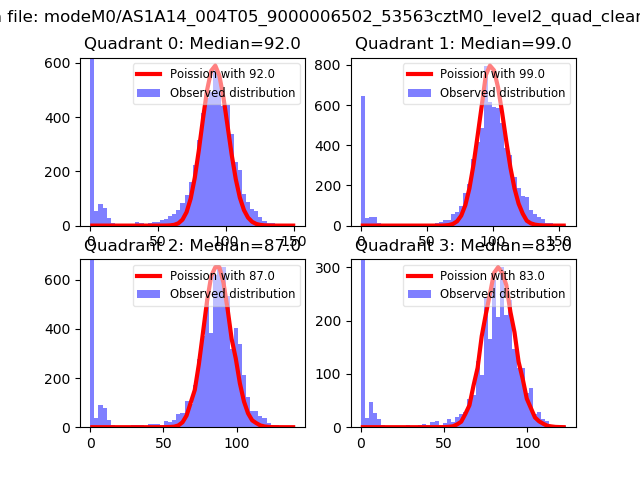 |
 |
| Quadrant-wise count rates Data is divided into 100 sec bins |
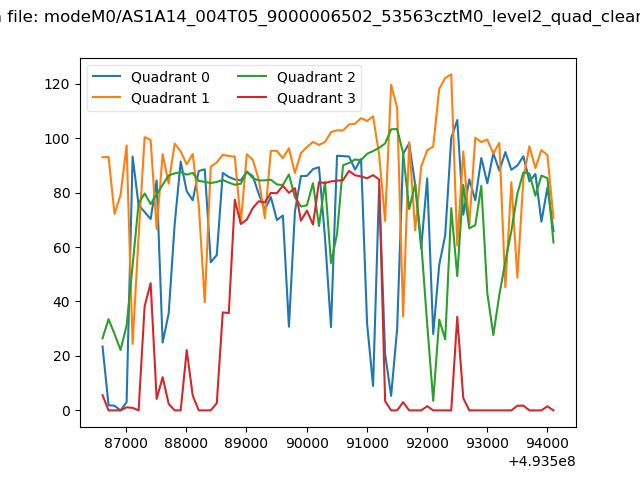 |
|
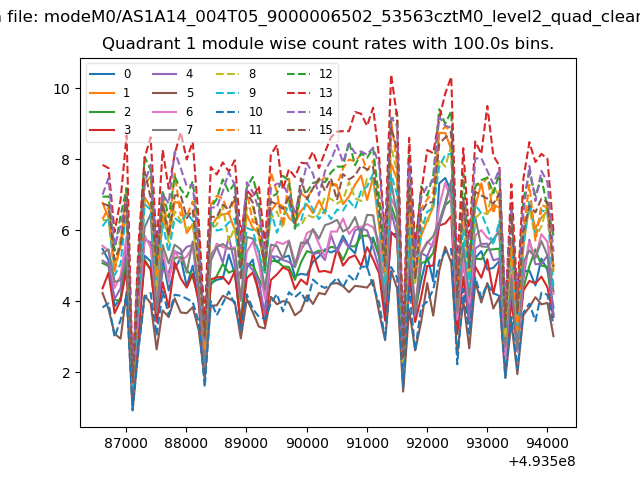
| Module-wise count rates for Quadrant A Data is divided into 100 sec bins |
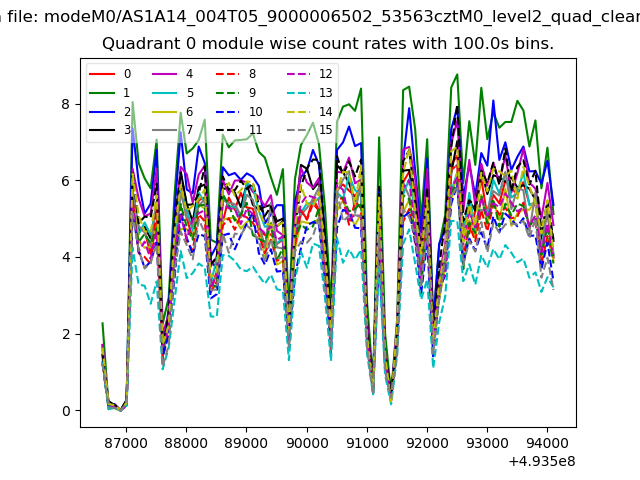 |
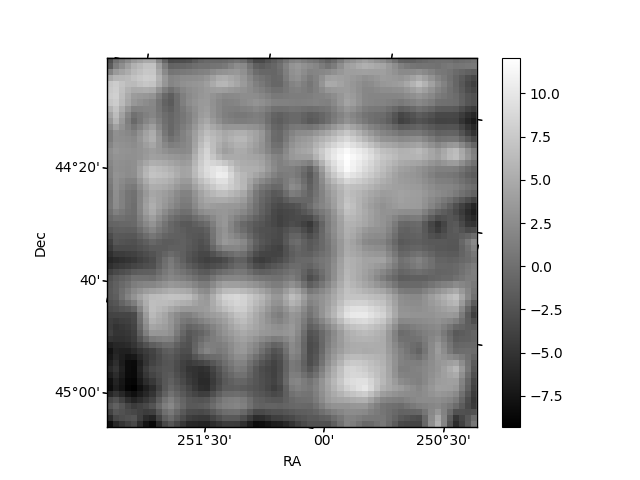 |
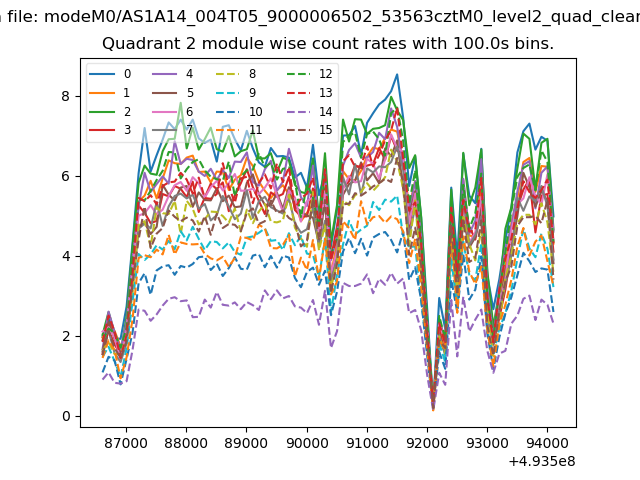
| Module-wise count rates for Quadrant B Data is divided into 100 sec bins |
 |
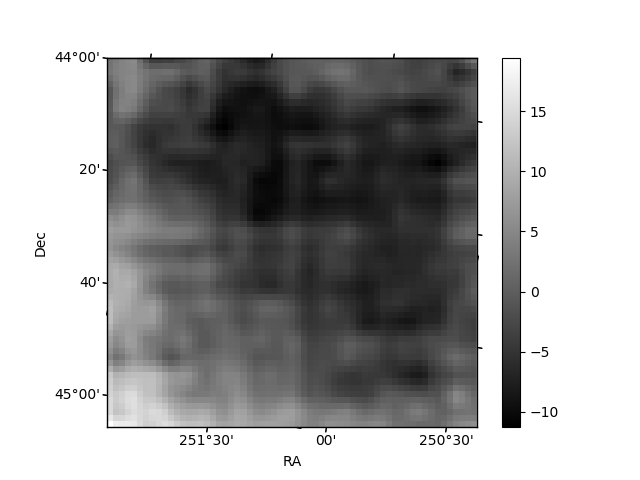 |
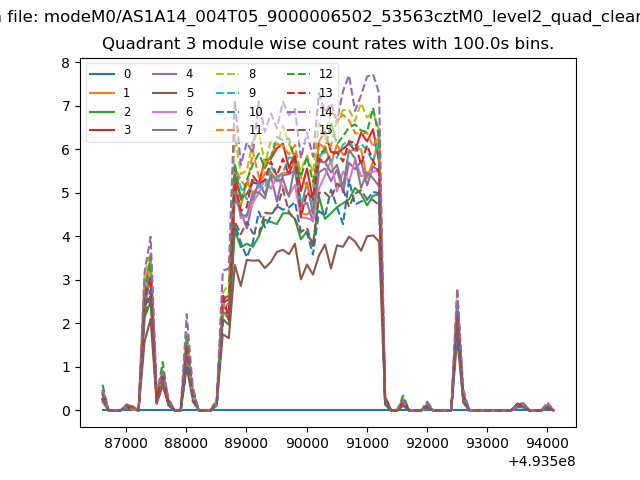
| Module-wise count rates for Quadrant C Data is divided into 100 sec bins |
 |
 |
| Module-wise count rates for Quadrant D Data is divided into 100 sec bins |
 |
 |
| Parameter | Plot |
|---|---|
| CZT HV Monitor |  |
| D_VDD | 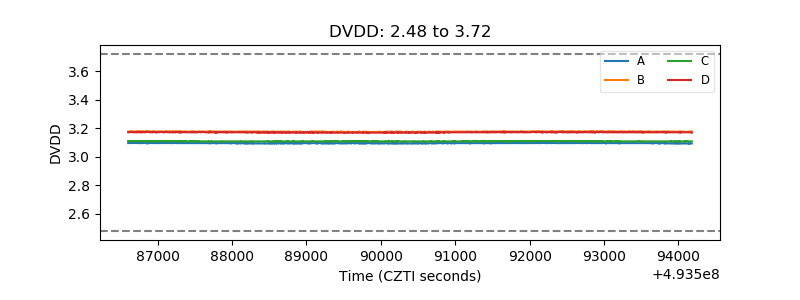 |
| Temperature 1 | 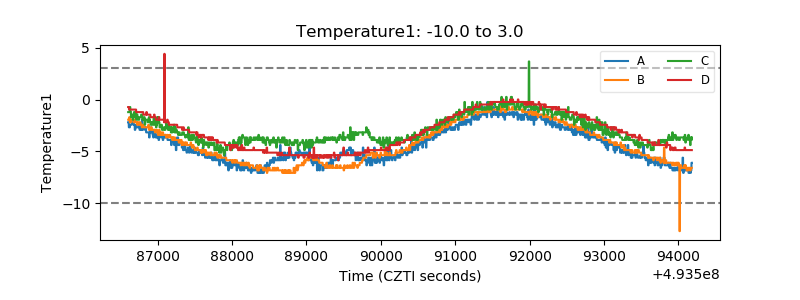 |
| Veto HV Monitor | 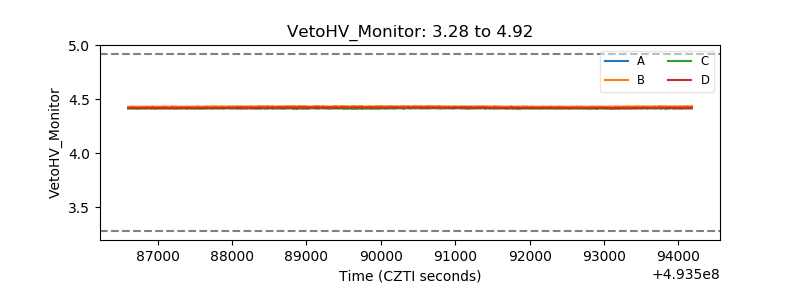 |
| Veto LLD | 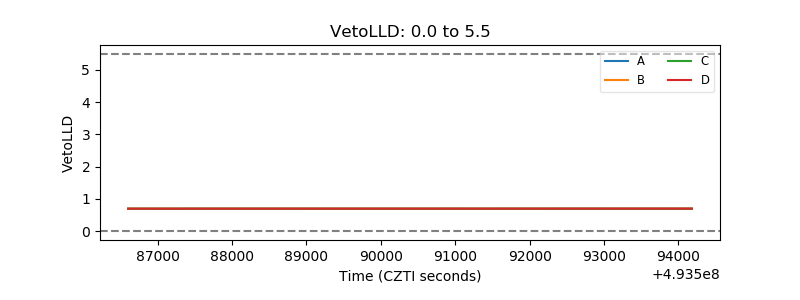 |
| Alpha Counter | 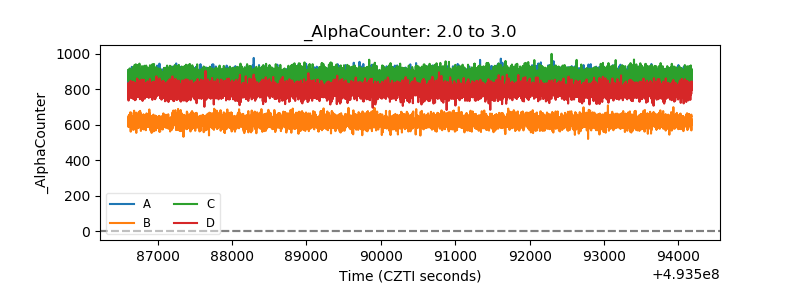 |
| _CPM_Rate | 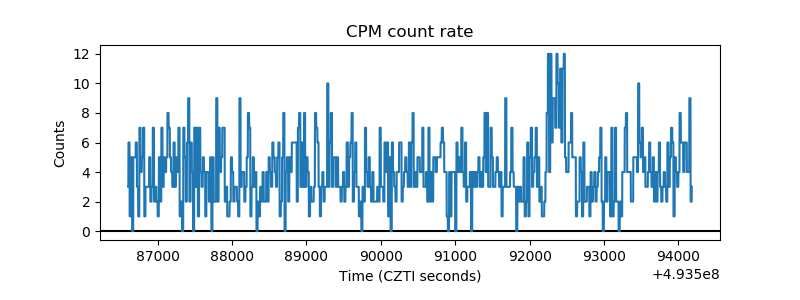 |
| CZT Counter | 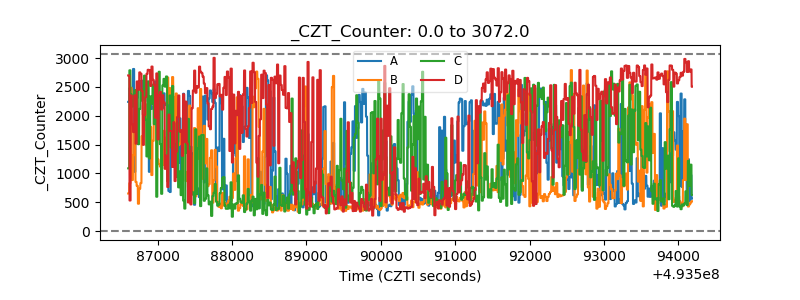 |
| +2.5 Volts monitor |  |
| +5 Volts monitor |  |
| _ROLL_ROT | 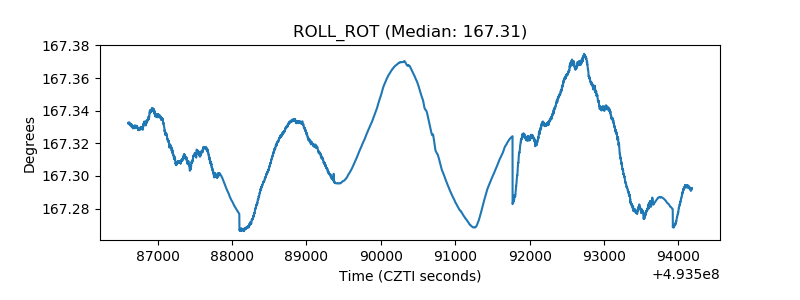 |
| _Roll_DEC | 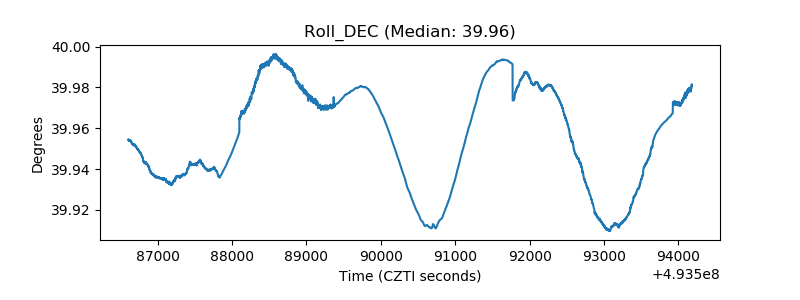 |
| _Roll_RA | 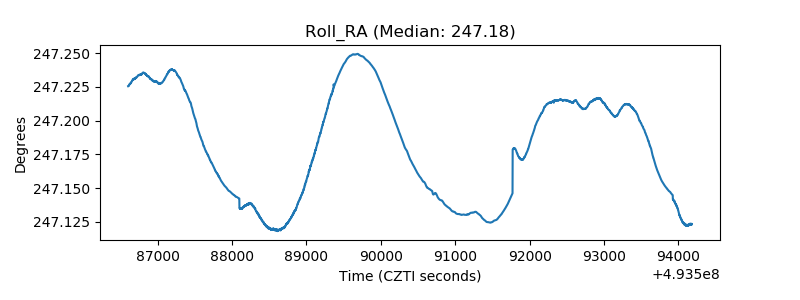 |
| Veto Counter | 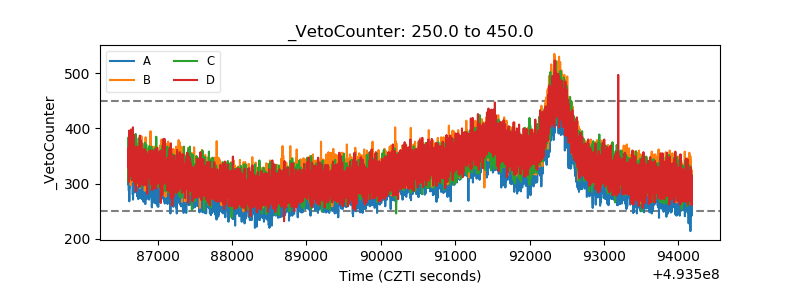 |