| Param | Original file | Final file |
|---|---|---|
| Filename | modeM0/AS1A14_004T05_9000006502_53566cztM0_level2.fits | modeM0/AS1A14_004T05_9000006502_53566cztM0_level2_quad_clean.evt |
| Size (bytes) | 2,870,426,880 | 185,904,000 |
| Size | 2.7 GB | 177.3 MB |
| Events in quadrant A | 29,272,088 | 980,790 |
| Events in quadrant B | 11,997,034 | 1,771,936 |
| Events in quadrant C | 24,769,818 | 1,168,923 |
| Events in quadrant D | 38,794,234 | 431,481 |
| Mode M9 | |||
|---|---|---|---|
| Quadrant | BADHDUFLAG | Total packets | Discarded packets |
| A | 0 | 13 | 0 |
| B | 0 | 13 | 0 |
| C | 0 | 13 | 0 |
| D | 0 | 13 | 0 |
| Mode SS | |||
|---|---|---|---|
| Quadrant | BADHDUFLAG | Total packets | Discarded packets |
| A | 0 | 376 | 0 |
| B | 0 | 376 | 0 |
| C | 0 | 376 | 0 |
| D | 0 | 376 | 0 |
| Mode M0 | |||
|---|---|---|---|
| Quadrant | BADHDUFLAG | Total packets | Discarded packets |
| A | 0 | 99711 | 3 |
| B | 0 | 48766 | 3 |
| C | 0 | 86292 | 3 |
| D | 0 | 127911 | 3 |
| Quadrant | Total seconds | Saturated seconds | Saturation percentage |
|---|---|---|---|
| A | 18481 | 8216 | 44.456469% |
| B | 18481 | 1014 | 5.486716% |
| C | 18481 | 5371 | 29.062280% |
| D | 18481 | 13581 | 73.486283% |
Noise dominated data is calculated using 1-second bins in cleaned event files. If a bin has >2000 counts, and if more than 50% of those come from <1% of pixels, then it is considered to be noise-dominated and hence unusable.
| Quadrant | # 1 sec bins | Bins with >0 counts | Bins with >2000 counts | High rate bins dominated by noise | Noise dominated (total time) | Noise dominated (detector-on time) | Marked lightcurve |
|---|---|---|---|---|---|---|---|
| A | 19861 | 18484 | 6822 | 6822 | 34.35% | 36.91% | 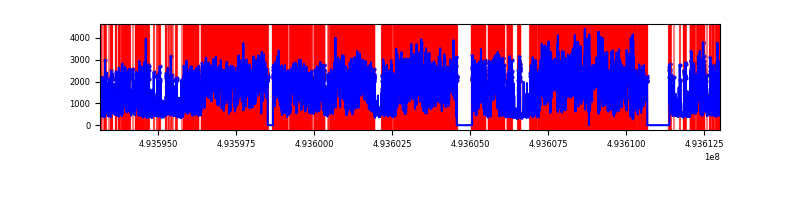 |
| B | 19861 | 18483 | 622 | 622 | 3.13% | 3.37% | 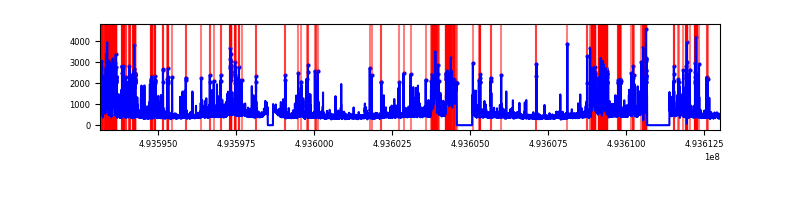 |
| C | 19861 | 18483 | 4959 | 4959 | 24.97% | 26.83% | 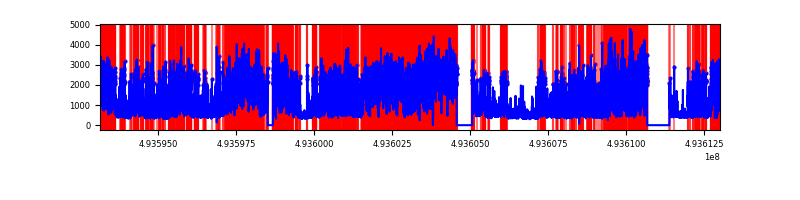 |
| D | 19861 | 18482 | 10745 | 10745 | 54.10% | 58.14% | 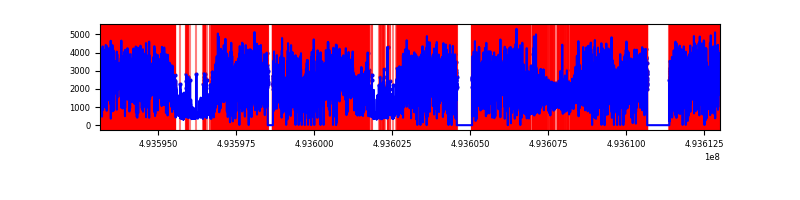 |
Top three noisy pixels from each quadrant. If the there are fewer than three noisy pixels in the level2.evt file, extra rows are filled as -1
| Pixel properties | Quadrant properties | ||||||
|---|---|---|---|---|---|---|---|
| Quadrant | DetID | PixID | Counts | Sigma | Mean | Median | Sigma |
| A | 3 | 62 | 9841904 | 25124.2 | 1579 | 1539 | 391.7 |
| A | 3 | 63 | 8338192 | 21284.96 | 1579 | 1539 | 391.7 |
| A | 4 | 239 | 2426197 | 6190.58 | 1579 | 1539 | 391.7 |
| B | 2 | 249 | 1042830 | 2539.47 | 1928 | 1855 | 409.9 |
| B | 10 | 254 | 860376 | 2094.37 | 1928 | 1855 | 409.9 |
| B | 5 | 185 | 849756 | 2068.46 | 1928 | 1855 | 409.9 |
| C | 7 | 64 | 9831636 | 21410.29 | 1652 | 1635 | 459.1 |
| C | 15 | 224 | 5756204 | 12533.77 | 1652 | 1635 | 459.1 |
| C | 12 | 252 | 1024965 | 2228.87 | 1652 | 1635 | 459.1 |
| D | 8 | 176 | 28963419 | 114816.32 | 872 | 834 | 252.3 |
| D | 2 | 172 | 4622188 | 18320.42 | 872 | 834 | 252.3 |
| D | 3 | 12 | 431697 | 1708.07 | 872 | 834 | 252.3 |
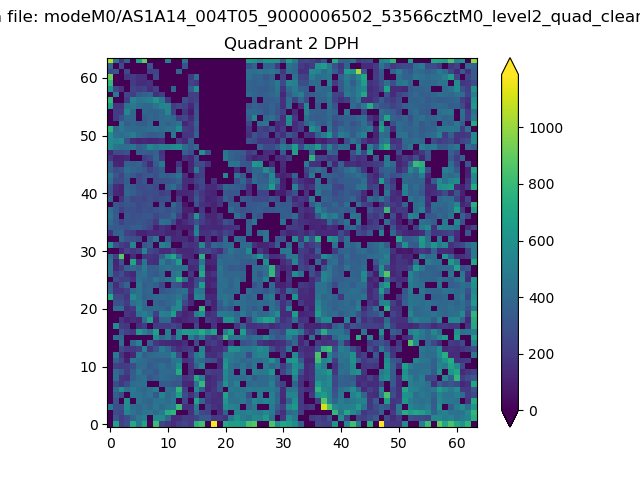
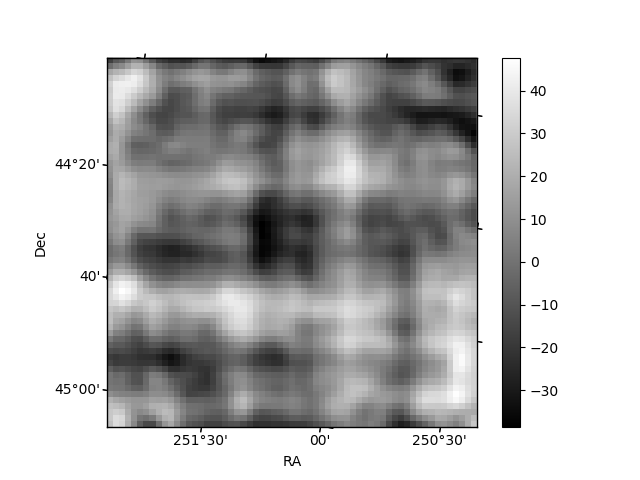
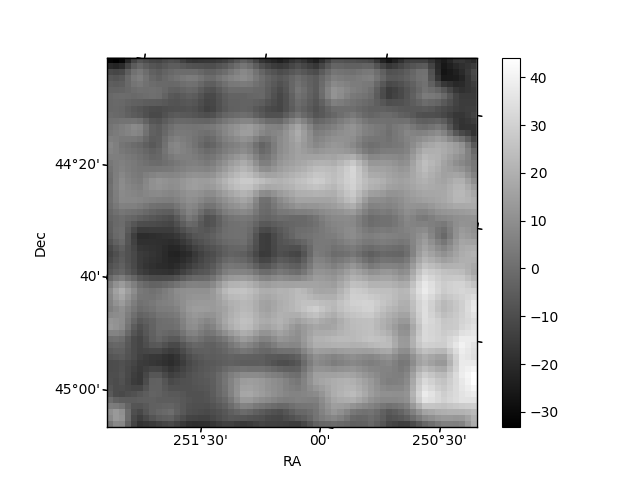
Histogram calculated using DETX and DETY for each event in the final _common_clean file
| Quadrant A | 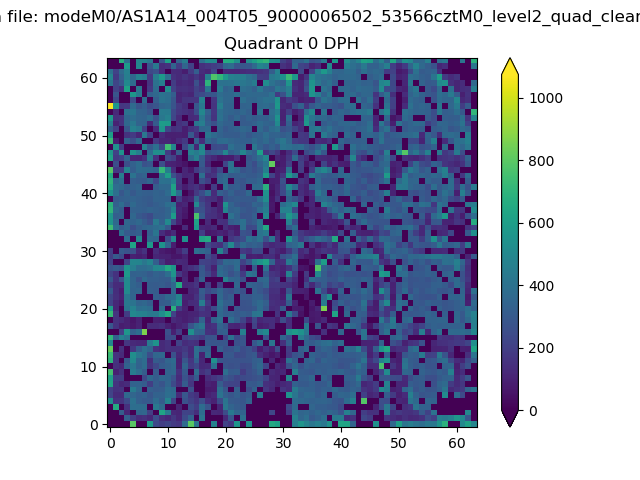 |
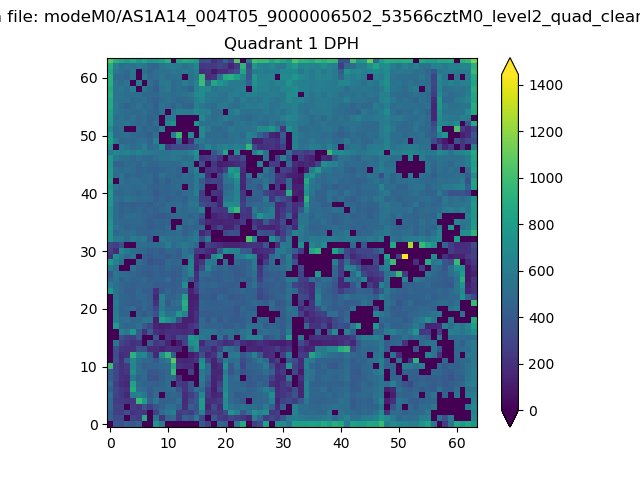 |
Quadrant B |
|---|---|---|---|
| Quadrant D | 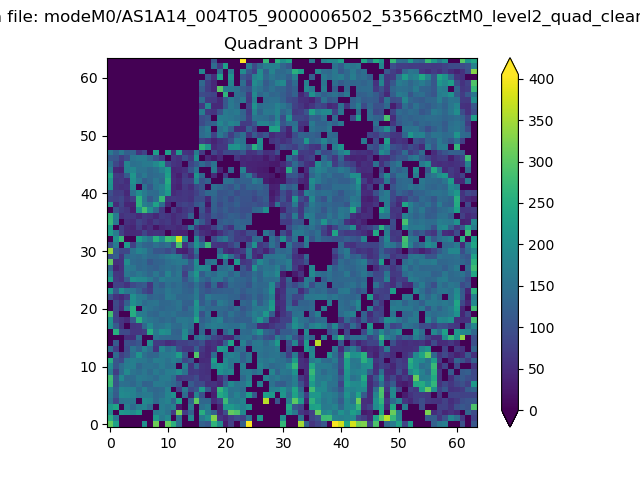 |
 |
Quadrant C |
| Plot type | Count rate plots | Images |
|---|---|---|
| Comparison with Poisson distribution Blue bars denote a histogram of data divided into 1 sec bins. Red curve is a Poisson curve with rate = median count rate of data. |
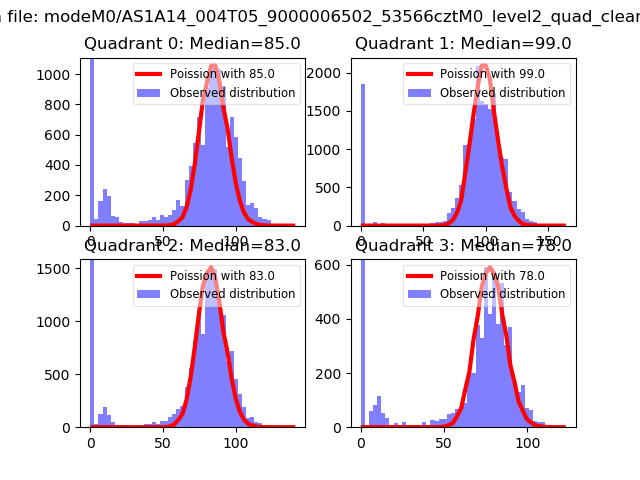 |
 |
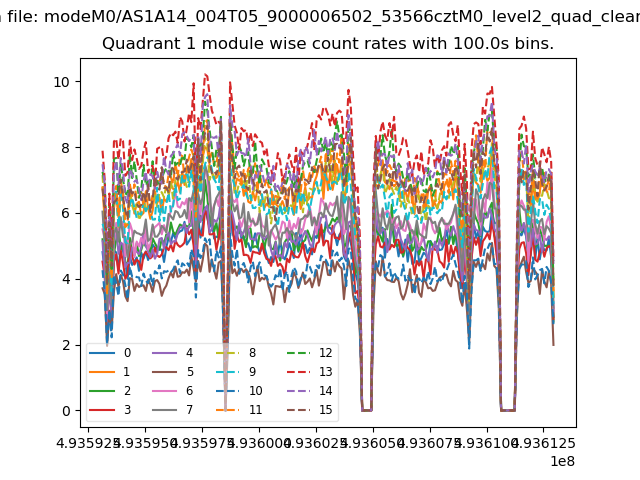
| Quadrant-wise count rates Data is divided into 100 sec bins |
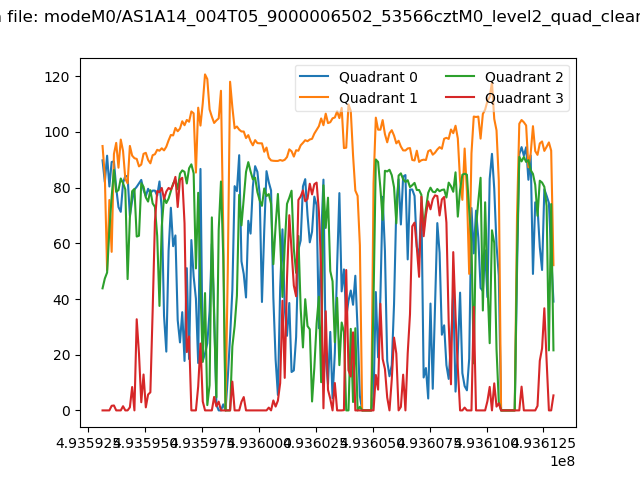 |
|
| Module-wise count rates for Quadrant A Data is divided into 100 sec bins |
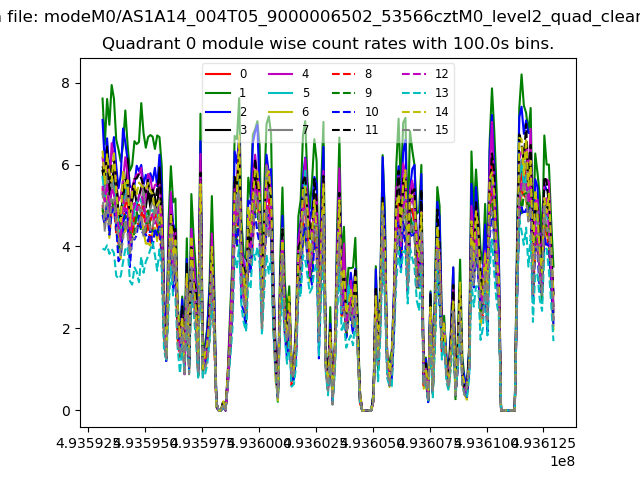 |
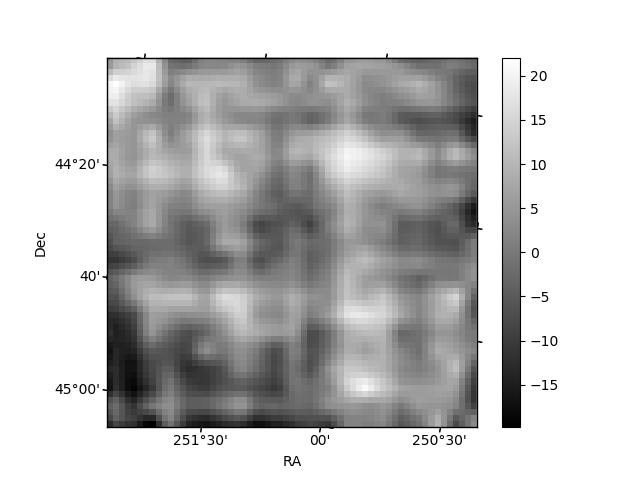 |
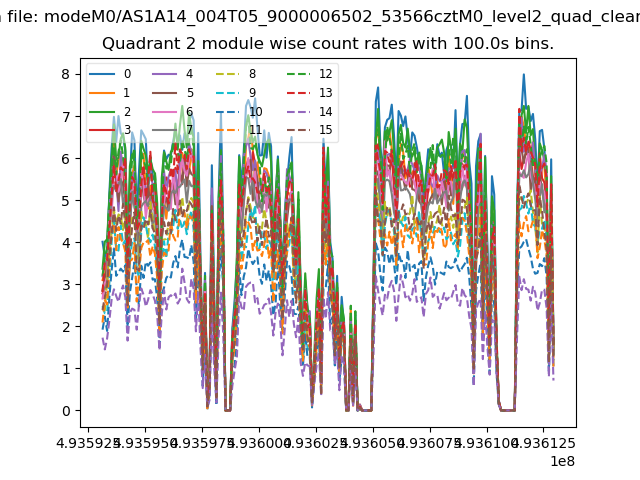
| Module-wise count rates for Quadrant B Data is divided into 100 sec bins |
 |
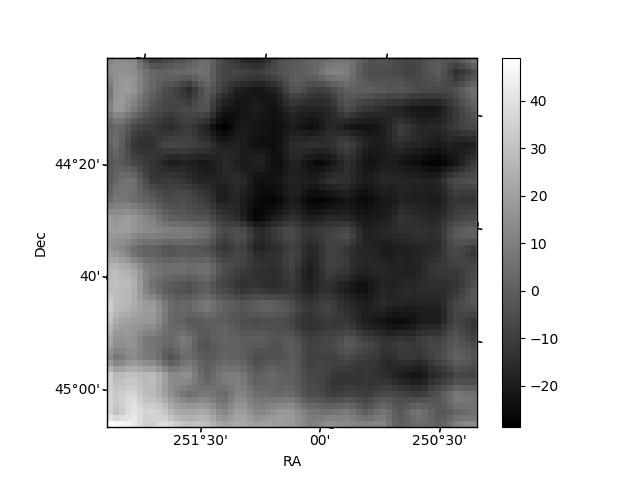 |
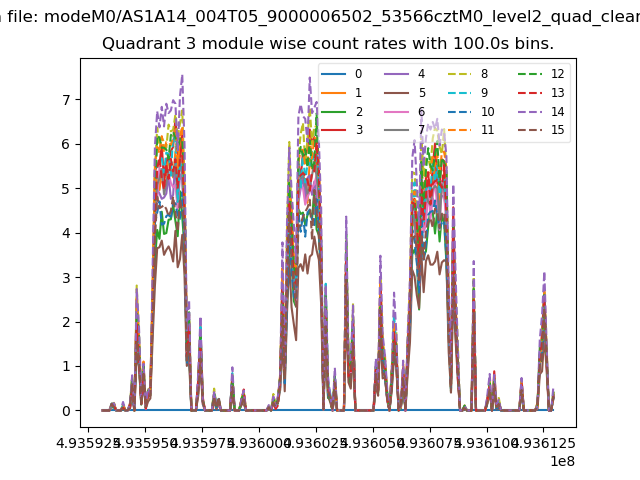
| Module-wise count rates for Quadrant C Data is divided into 100 sec bins |
 |
 |
| Module-wise count rates for Quadrant D Data is divided into 100 sec bins |
 |
 |
| Parameter | Plot |
|---|---|
| CZT HV Monitor | 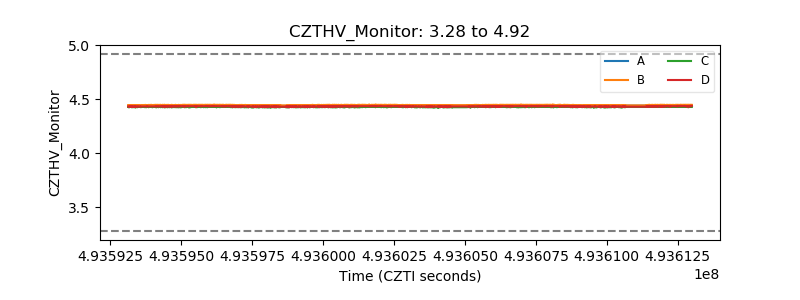 |
| D_VDD | 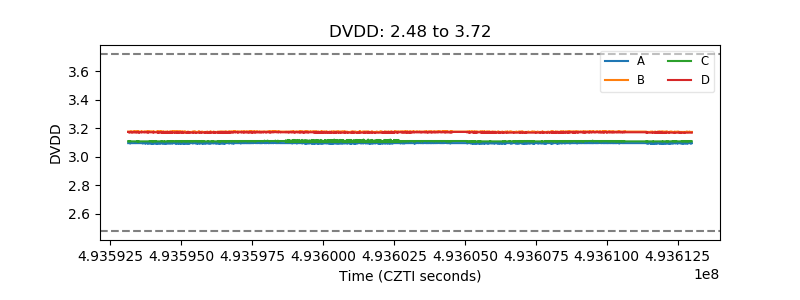 |
| Temperature 1 | 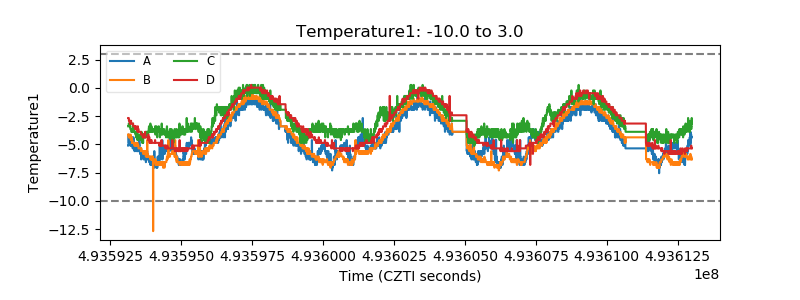 |
| Veto HV Monitor | 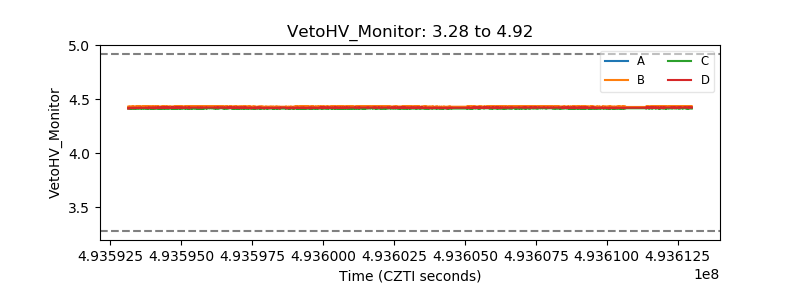 |
| Veto LLD | 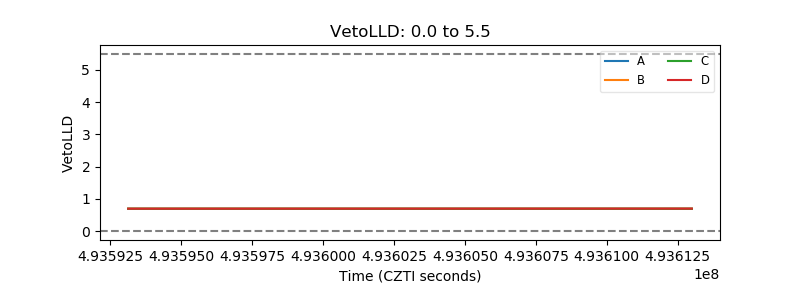 |
| Alpha Counter | 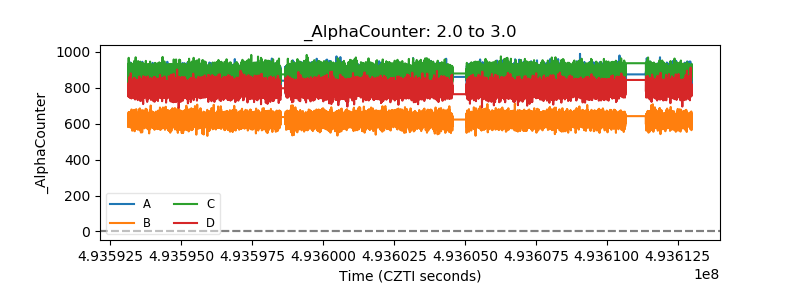 |
| _CPM_Rate | 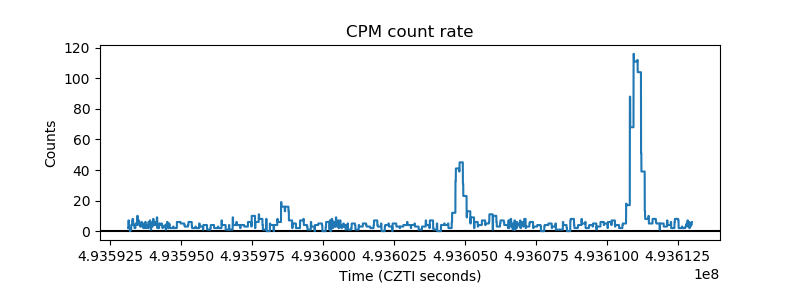 |
| CZT Counter | 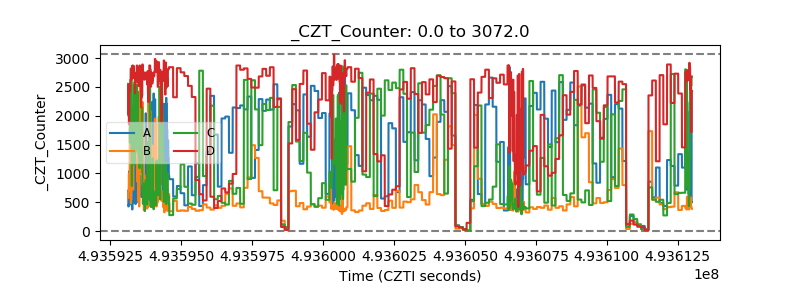 |
| +2.5 Volts monitor |  |
| +5 Volts monitor |  |
| _ROLL_ROT | 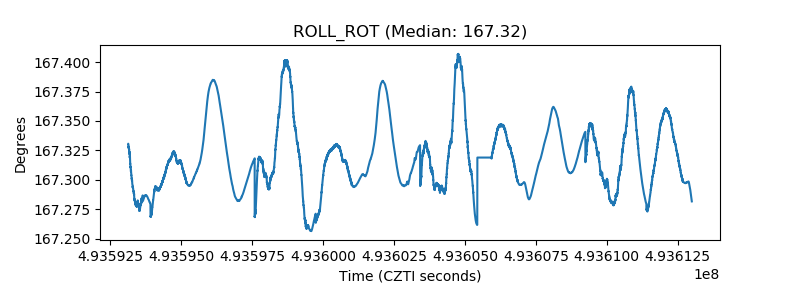 |
| _Roll_DEC | 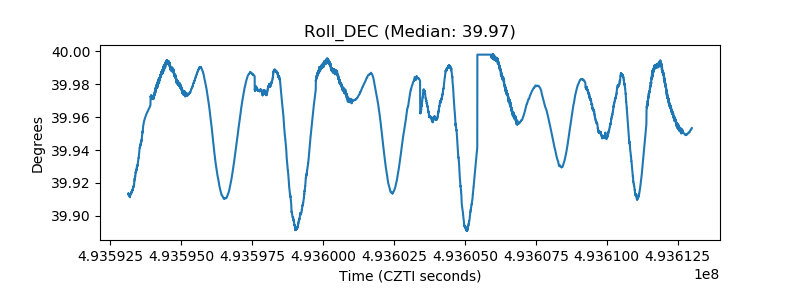 |
| _Roll_RA | 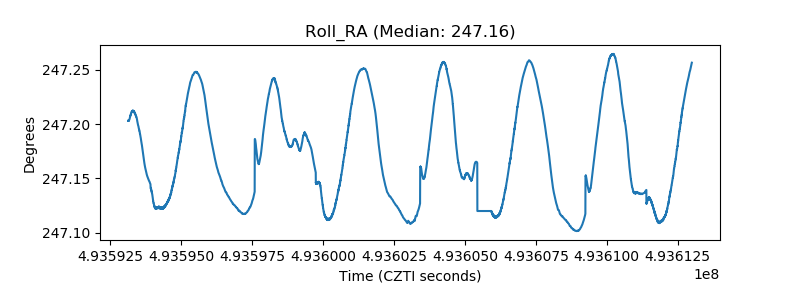 |
| Veto Counter | 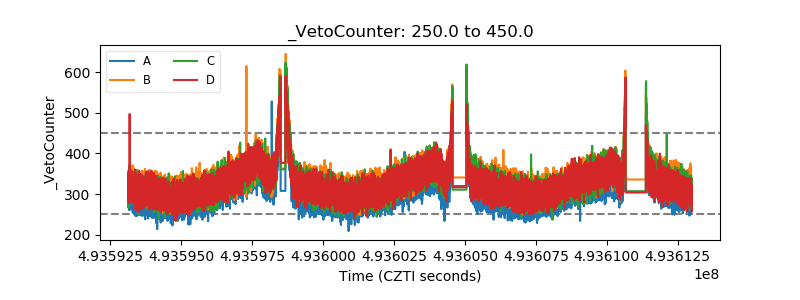 |