| Param | Original file | Final file |
|---|---|---|
| Filename | modeM0/AS1A14_004T05_9000006502_53567cztM0_level2.fits | modeM0/AS1A14_004T05_9000006502_53567cztM0_level2_quad_clean.evt |
| Size (bytes) | 917,962,560 | 79,223,040 |
| Size | 875.4 MB | 75.6 MB |
| Events in quadrant A | 9,662,703 | 462,330 |
| Events in quadrant B | 3,525,736 | 687,198 |
| Events in quadrant C | 6,245,510 | 580,376 |
| Events in quadrant D | 14,017,482 | 192,205 |
| Mode M9 | |||
|---|---|---|---|
| Quadrant | BADHDUFLAG | Total packets | Discarded packets |
| A | 0 | 12 | 0 |
| B | 0 | 13 | 0 |
| C | 0 | 13 | 0 |
| D | 0 | 13 | 0 |
| Mode SS | |||
|---|---|---|---|
| Quadrant | BADHDUFLAG | Total packets | Discarded packets |
| A | 0 | 138 | 0 |
| B | 0 | 138 | 0 |
| C | 0 | 138 | 0 |
| D | 0 | 138 | 0 |
| Mode M0 | |||
|---|---|---|---|
| Quadrant | BADHDUFLAG | Total packets | Discarded packets |
| A | 0 | 33424 | 2 |
| B | 0 | 15222 | 2 |
| C | 0 | 23203 | 2 |
| D | 0 | 46399 | 2 |
| Quadrant | Total seconds | Saturated seconds | Saturation percentage |
|---|---|---|---|
| A | 6834 | 2269 | 33.201639% |
| B | 6834 | 138 | 2.019315% |
| C | 6834 | 662 | 9.686860% |
| D | 6834 | 4762 | 69.681007% |
Noise dominated data is calculated using 1-second bins in cleaned event files. If a bin has >2000 counts, and if more than 50% of those come from <1% of pixels, then it is considered to be noise-dominated and hence unusable.
| Quadrant | # 1 sec bins | Bins with >0 counts | Bins with >2000 counts | High rate bins dominated by noise | Noise dominated (total time) | Noise dominated (detector-on time) | Marked lightcurve |
|---|---|---|---|---|---|---|---|
| A | 7699 | 6836 | 1901 | 1901 | 24.69% | 27.81% | 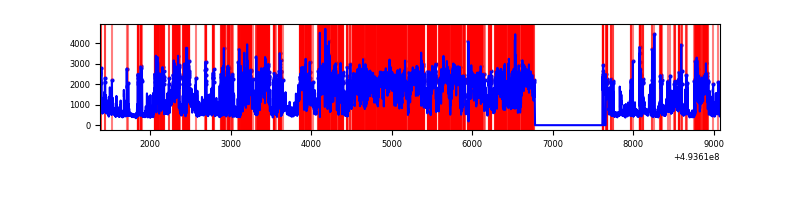 |
| B | 7699 | 6836 | 52 | 52 | 0.68% | 0.76% | 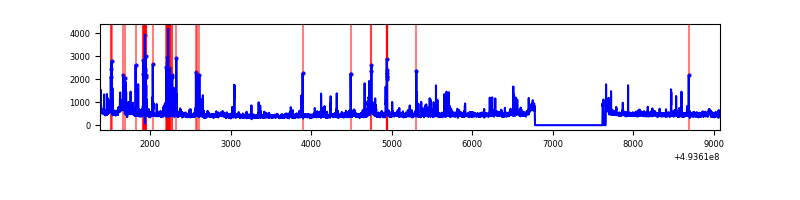 |
| C | 7699 | 6836 | 630 | 630 | 8.18% | 9.22% | 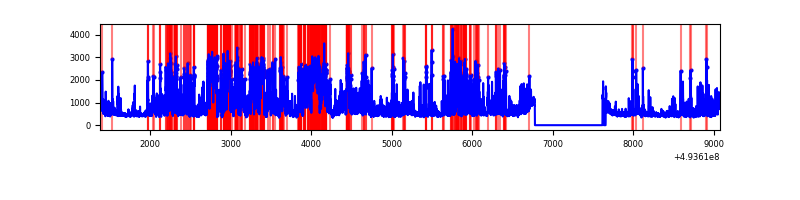 |
| D | 7699 | 6835 | 3708 | 3708 | 48.16% | 54.25% | 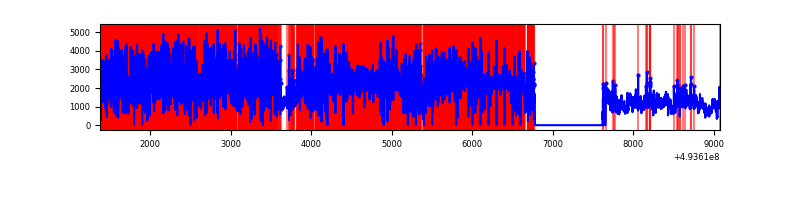 |
Top three noisy pixels from each quadrant. If the there are fewer than three noisy pixels in the level2.evt file, extra rows are filled as -1
| Pixel properties | Quadrant properties | ||||||
|---|---|---|---|---|---|---|---|
| Quadrant | DetID | PixID | Counts | Sigma | Mean | Median | Sigma |
| A | 3 | 62 | 3956025 | 24981.97 | 644 | 629 | 158.3 |
| A | 3 | 63 | 1119631 | 7067.53 | 644 | 629 | 158.3 |
| A | 15 | 174 | 884629 | 5583.28 | 644 | 629 | 158.3 |
| B | 4 | 170 | 142322 | 890.0 | 733 | 707 | 159.1 |
| B | 5 | 185 | 78759 | 490.53 | 733 | 707 | 159.1 |
| B | 10 | 28 | 67185 | 417.79 | 733 | 707 | 159.1 |
| C | 7 | 64 | 1877558 | 9696.03 | 704 | 699 | 193.6 |
| C | 15 | 224 | 1020714 | 5269.49 | 704 | 699 | 193.6 |
| C | 4 | 5 | 81397 | 416.89 | 704 | 699 | 193.6 |
| D | 8 | 176 | 9435948 | 91914.93 | 358 | 343 | 102.7 |
| D | 2 | 172 | 2814258 | 27411.15 | 358 | 343 | 102.7 |
| D | 3 | 12 | 79742 | 773.45 | 358 | 343 | 102.7 |
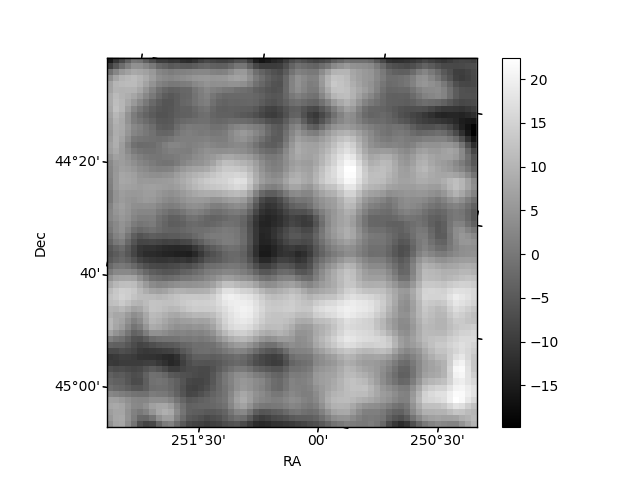
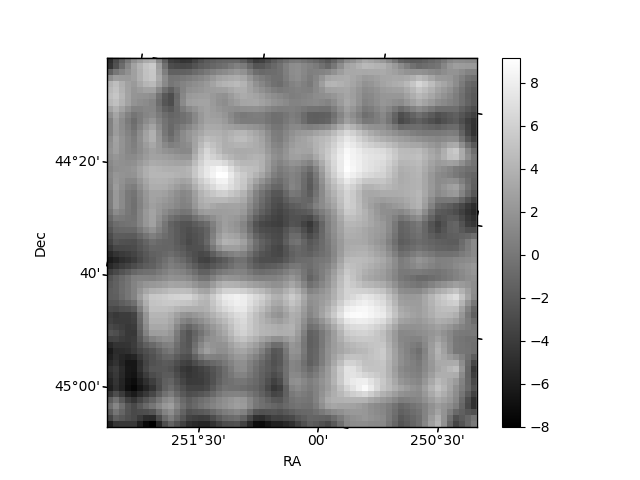
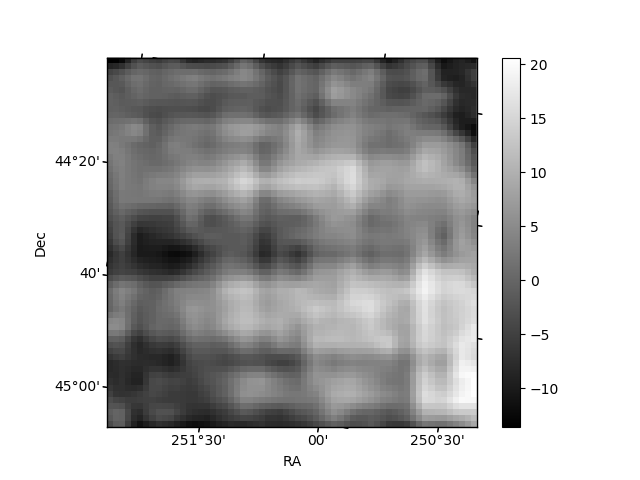
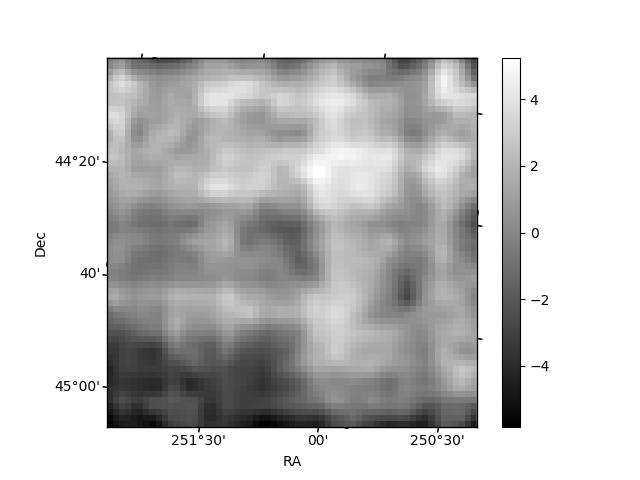
Histogram calculated using DETX and DETY for each event in the final _common_clean file
| Quadrant A | 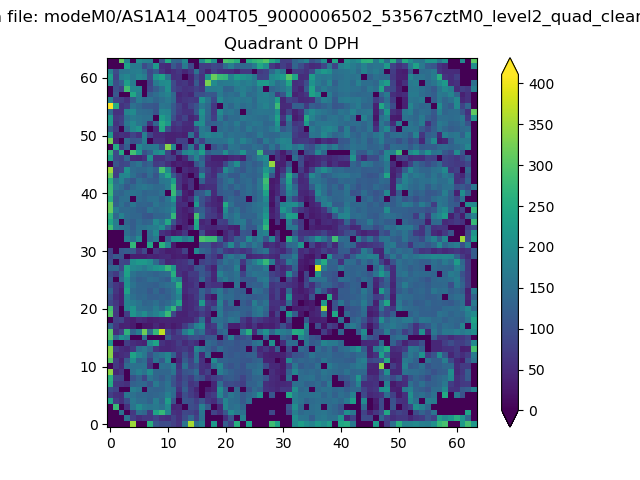 |
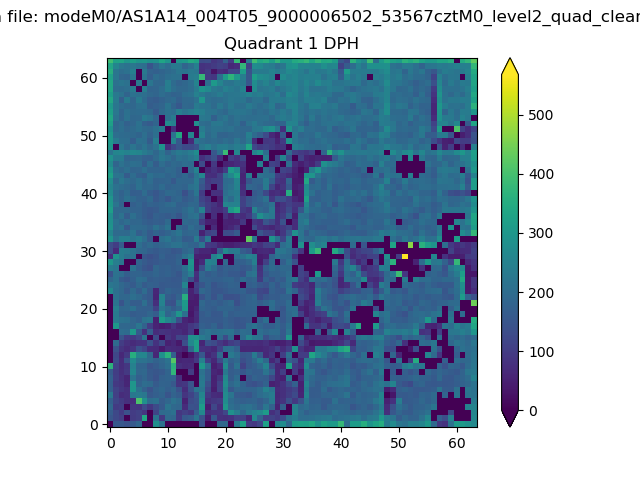 |
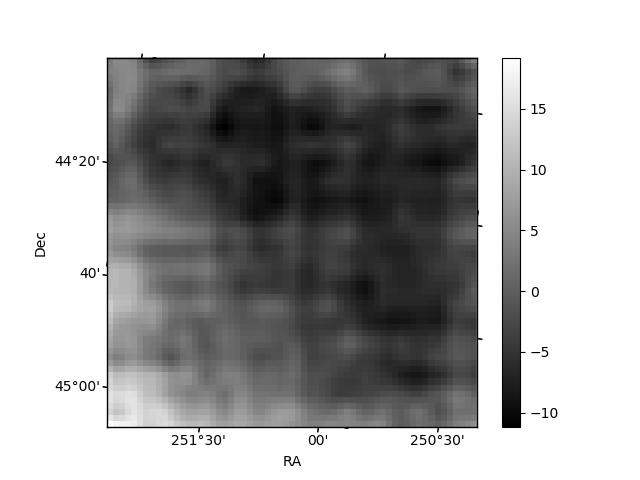
Quadrant B |
|---|---|---|---|
| Quadrant D | 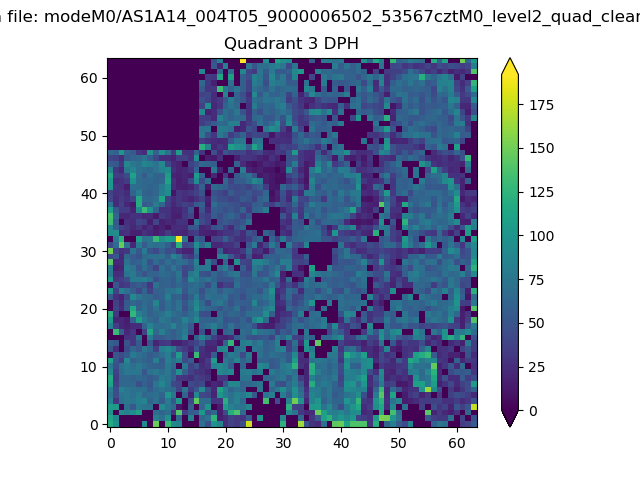 |
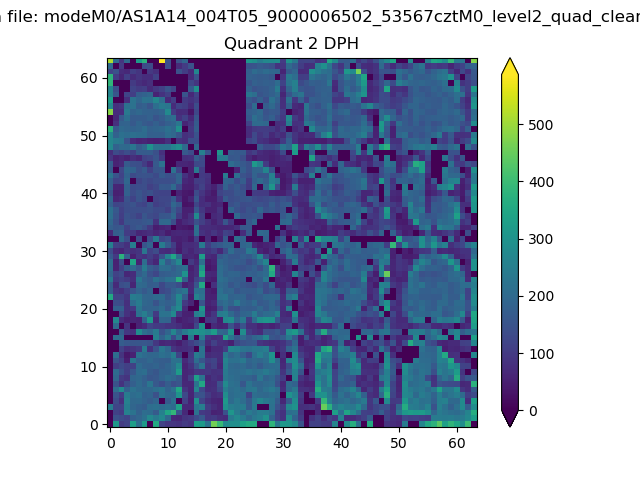 |
Quadrant C |
| Plot type | Count rate plots | Images |
|---|---|---|
| Comparison with Poisson distribution Blue bars denote a histogram of data divided into 1 sec bins. Red curve is a Poisson curve with rate = median count rate of data. |
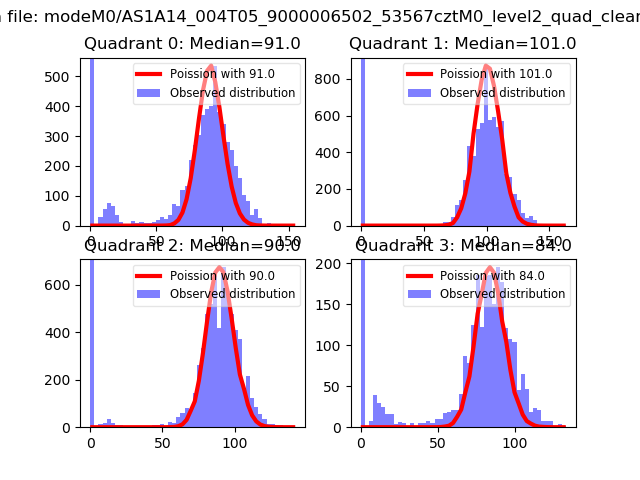 |
 |
| Quadrant-wise count rates Data is divided into 100 sec bins |
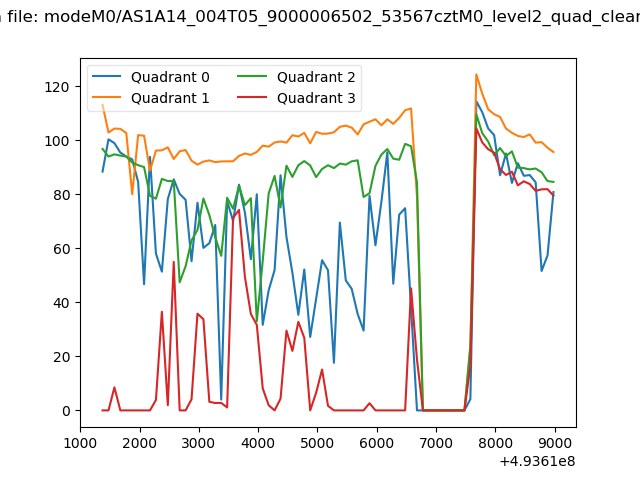 |
|
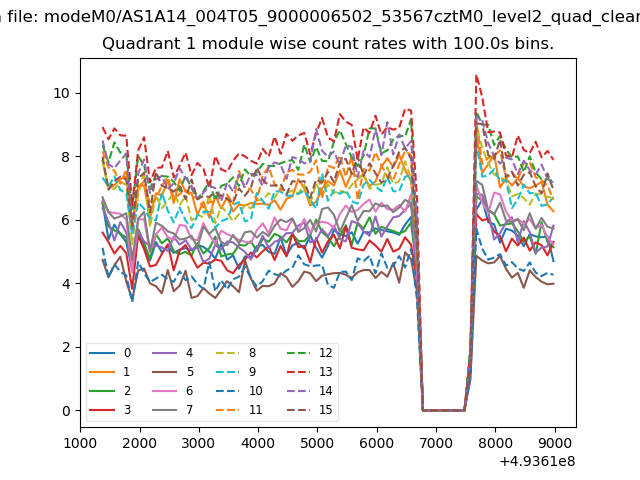
| Module-wise count rates for Quadrant A Data is divided into 100 sec bins |
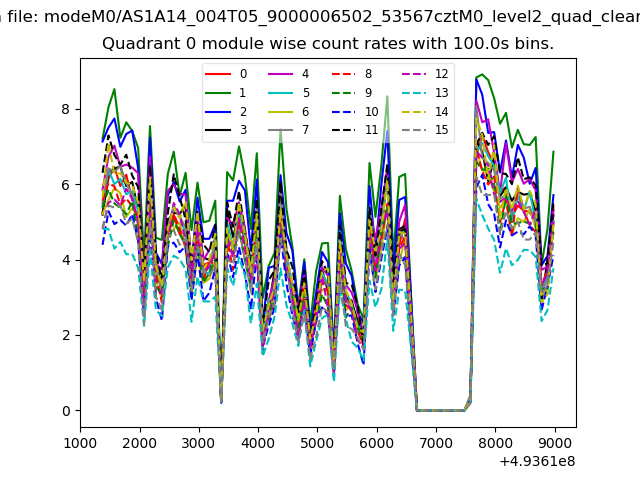 |
 |
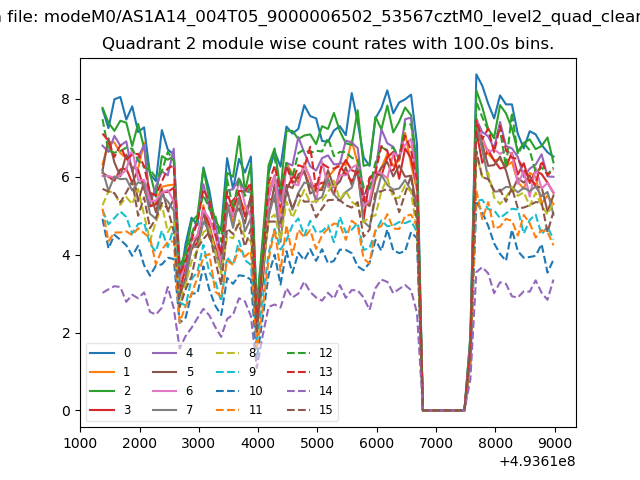
| Module-wise count rates for Quadrant B Data is divided into 100 sec bins |
 |
 |
| Module-wise count rates for Quadrant C Data is divided into 100 sec bins |
 |
 |
| Module-wise count rates for Quadrant D Data is divided into 100 sec bins |
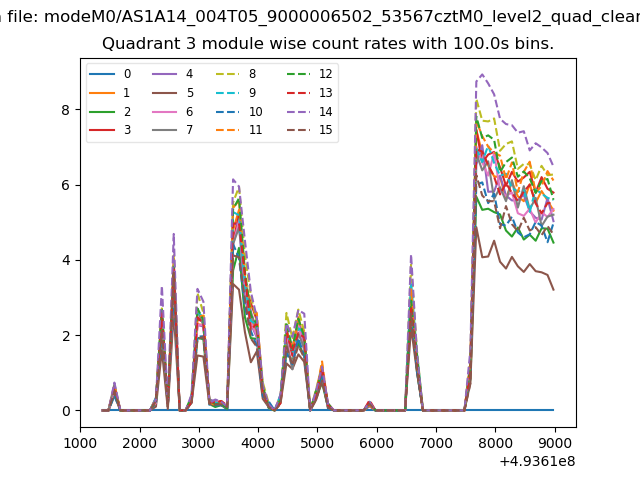 |
 |
| Parameter | Plot |
|---|---|
| CZT HV Monitor | 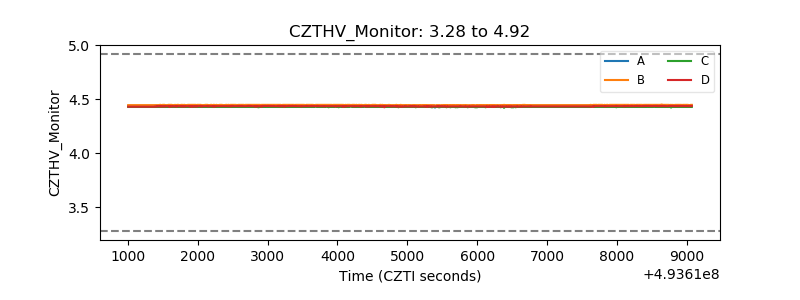 |
| D_VDD | 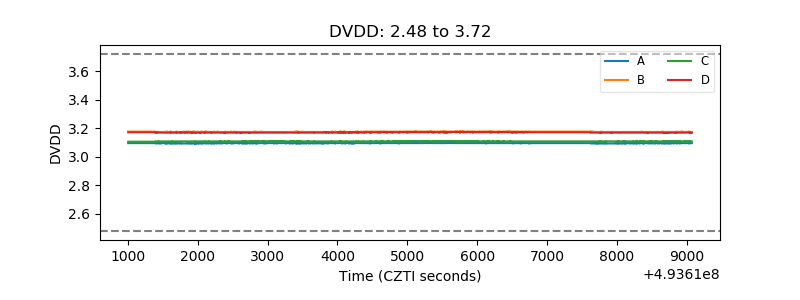 |
| Temperature 1 | 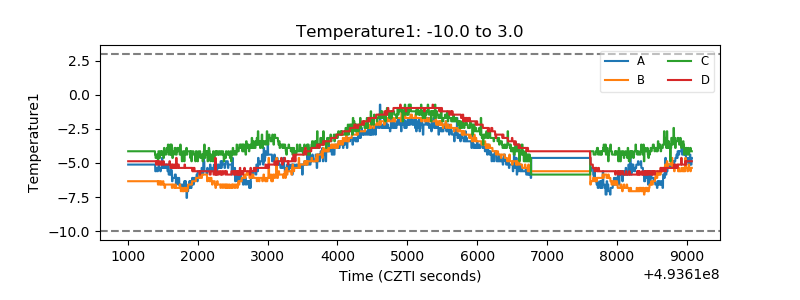 |
| Veto HV Monitor | 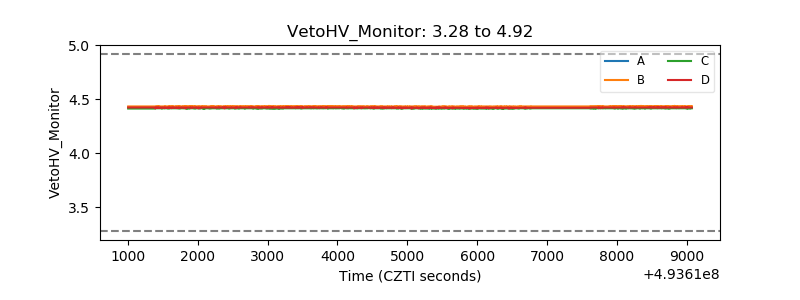 |
| Veto LLD | 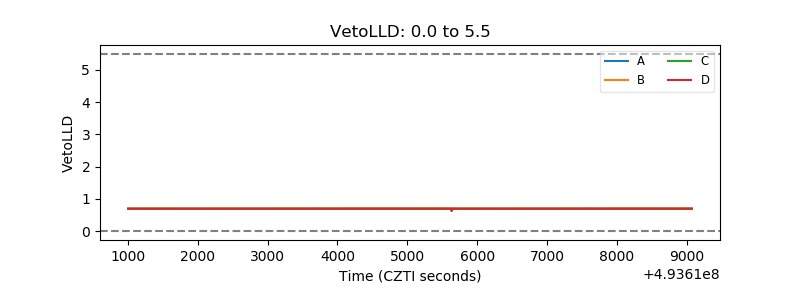 |
| Alpha Counter |  |
| _CPM_Rate | 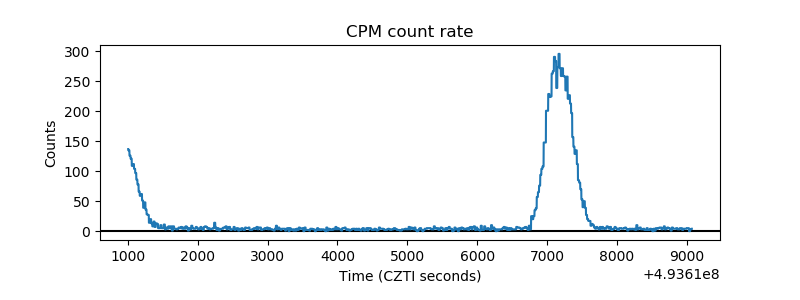 |
| CZT Counter | 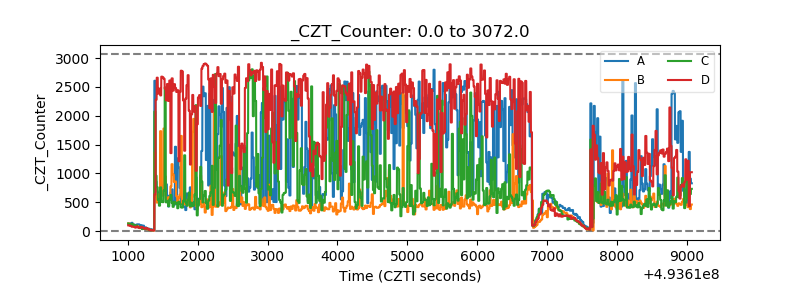 |
| +2.5 Volts monitor | 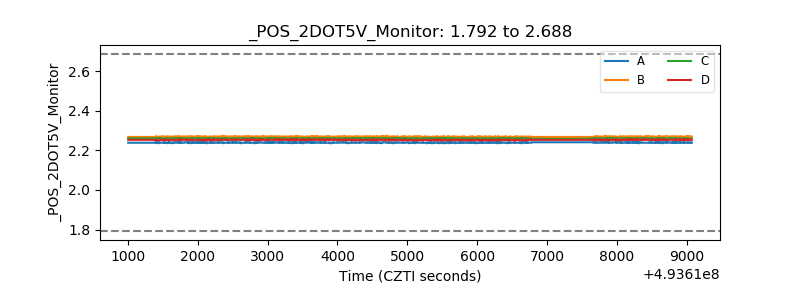 |
| +5 Volts monitor | 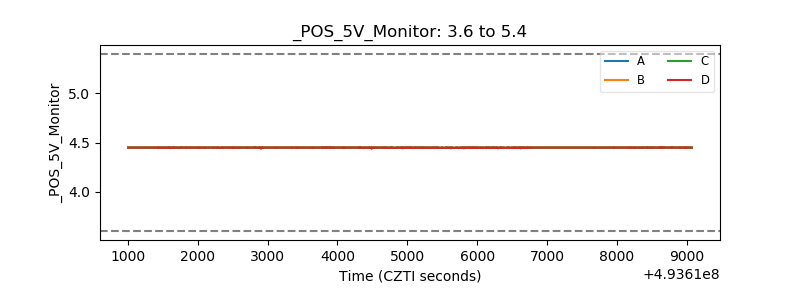 |
| _ROLL_ROT | 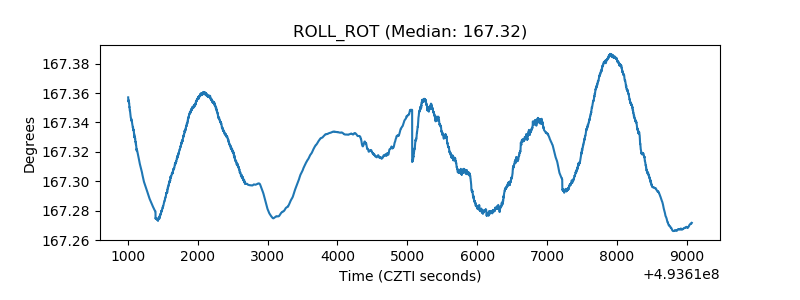 |
| _Roll_DEC | 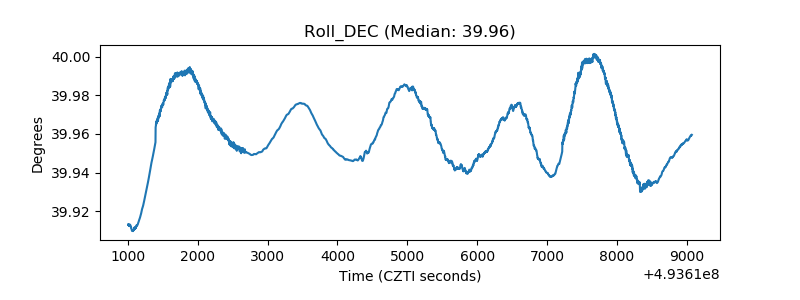 |
| _Roll_RA | 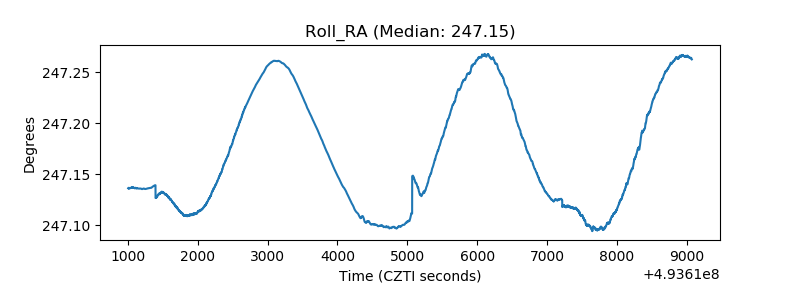 |
| Veto Counter | 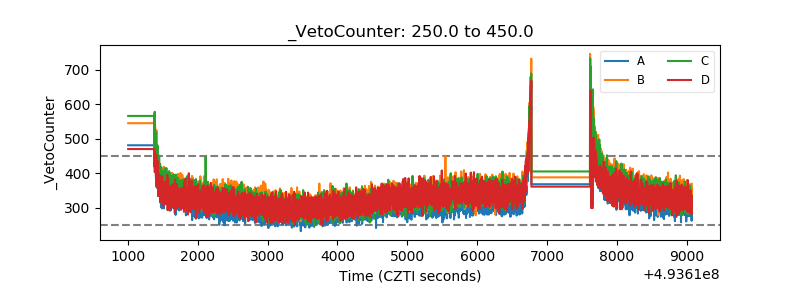 |