| Param | Original file | Final file |
|---|---|---|
| Filename | modeM0/AS1A14_004T05_9000006502_53570cztM0_level2.fits | modeM0/AS1A14_004T05_9000006502_53570cztM0_level2_quad_clean.evt |
| Size (bytes) | 861,753,600 | 85,368,960 |
| Size | 821.8 MB | 81.4 MB |
| Events in quadrant A | 7,731,775 | 537,009 |
| Events in quadrant B | 4,480,900 | 710,071 |
| Events in quadrant C | 7,439,657 | 569,685 |
| Events in quadrant D | 11,720,717 | 293,940 |
| Mode M9 | |||
|---|---|---|---|
| Quadrant | BADHDUFLAG | Total packets | Discarded packets |
| A | 0 | 21 | 0 |
| B | 0 | 21 | 0 |
| C | 0 | 21 | 0 |
| D | 0 | 21 | 0 |
| Mode SS | |||
|---|---|---|---|
| Quadrant | BADHDUFLAG | Total packets | Discarded packets |
| A | 0 | 140 | 0 |
| B | 0 | 140 | 0 |
| C | 0 | 140 | 0 |
| D | 0 | 140 | 0 |
| Mode M0 | |||
|---|---|---|---|
| Quadrant | BADHDUFLAG | Total packets | Discarded packets |
| A | 0 | 27667 | 4 |
| B | 0 | 17797 | 2 |
| C | 0 | 26769 | 2 |
| D | 0 | 39581 | 2 |
| Quadrant | Total seconds | Saturated seconds | Saturation percentage |
|---|---|---|---|
| A | 6796 | 1715 | 25.235433% |
| B | 6798 | 419 | 6.163578% |
| C | 6798 | 1124 | 16.534275% |
| D | 6798 | 3858 | 56.751986% |
Noise dominated data is calculated using 1-second bins in cleaned event files. If a bin has >2000 counts, and if more than 50% of those come from <1% of pixels, then it is considered to be noise-dominated and hence unusable.
| Quadrant | # 1 sec bins | Bins with >0 counts | Bins with >2000 counts | High rate bins dominated by noise | Noise dominated (total time) | Noise dominated (detector-on time) | Marked lightcurve |
|---|---|---|---|---|---|---|---|
| A | 8892 | 6798 | 1250 | 1250 | 14.06% | 18.39% | 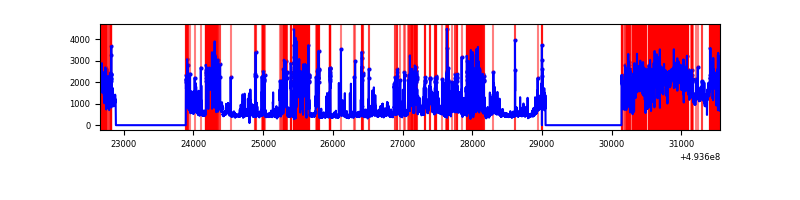 |
| B | 8893 | 6800 | 199 | 199 | 2.24% | 2.93% | 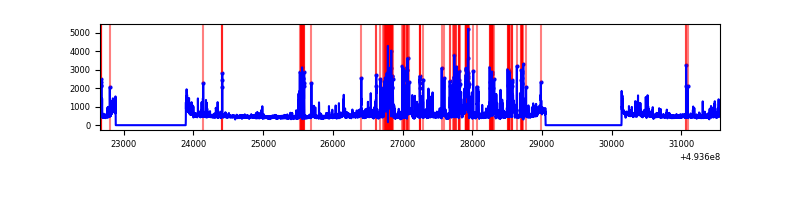 |
| C | 8893 | 6800 | 912 | 912 | 10.26% | 13.41% | 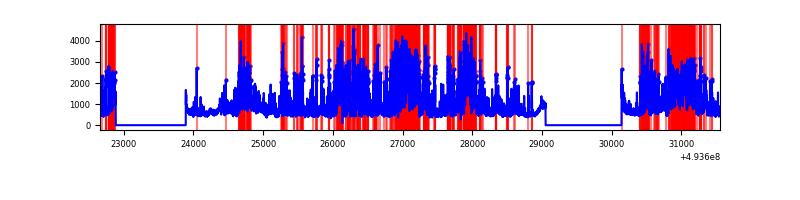 |
| D | 8893 | 6797 | 2294 | 2294 | 25.80% | 33.75% | 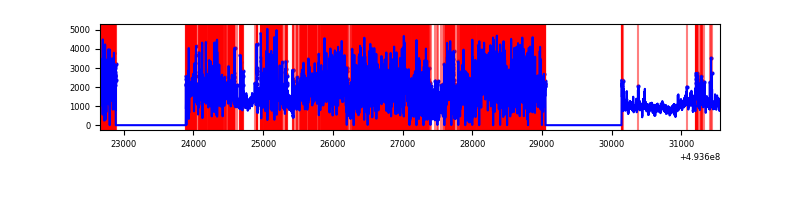 |
Top three noisy pixels from each quadrant. If the there are fewer than three noisy pixels in the level2.evt file, extra rows are filled as -1
| Pixel properties | Quadrant properties | ||||||
|---|---|---|---|---|---|---|---|
| Quadrant | DetID | PixID | Counts | Sigma | Mean | Median | Sigma |
| A | 3 | 63 | 1924160 | 11129.73 | 702 | 685 | 172.8 |
| A | 12 | 115 | 1505872 | 8709.4 | 702 | 685 | 172.8 |
| A | 3 | 62 | 932630 | 5392.48 | 702 | 685 | 172.8 |
| B | 2 | 249 | 518646 | 3183.64 | 762 | 738 | 162.7 |
| B | 5 | 185 | 253739 | 1555.23 | 762 | 738 | 162.7 |
| B | 7 | 129 | 229626 | 1407.0 | 762 | 738 | 162.7 |
| C | 15 | 224 | 2034435 | 10348.77 | 711 | 706 | 196.5 |
| C | 1 | 241 | 636229 | 3233.9 | 711 | 706 | 196.5 |
| C | 15 | 178 | 608378 | 3092.18 | 711 | 706 | 196.5 |
| D | 8 | 176 | 6086265 | 48104.93 | 448 | 429 | 126.5 |
| D | 2 | 172 | 3274394 | 25878.75 | 448 | 429 | 126.5 |
| D | 3 | 12 | 137880 | 1086.47 | 448 | 429 | 126.5 |
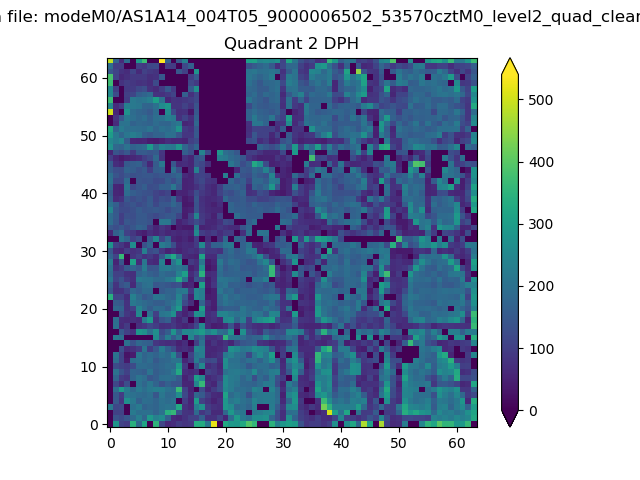
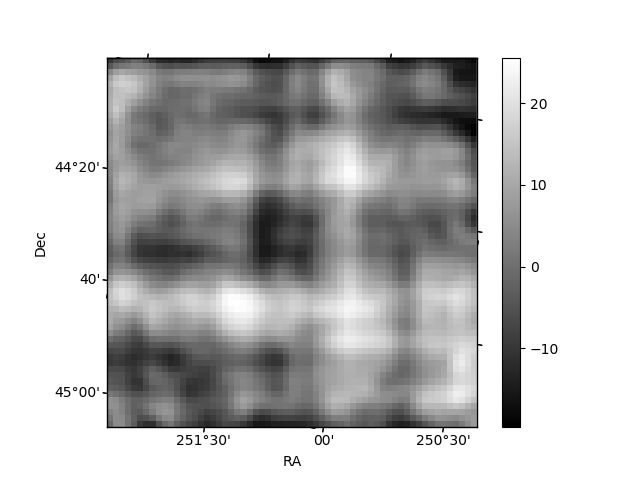
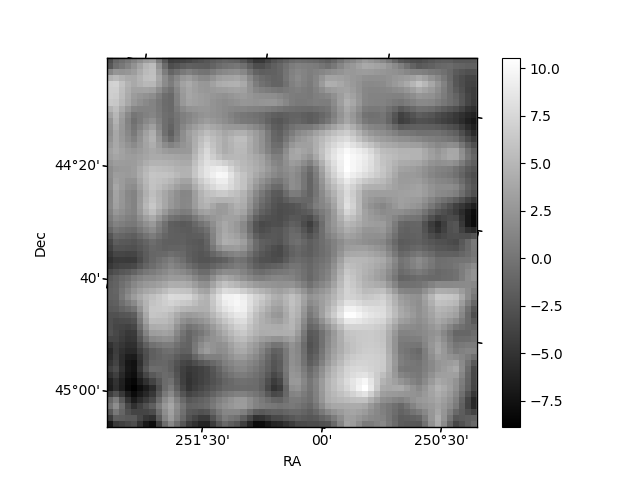
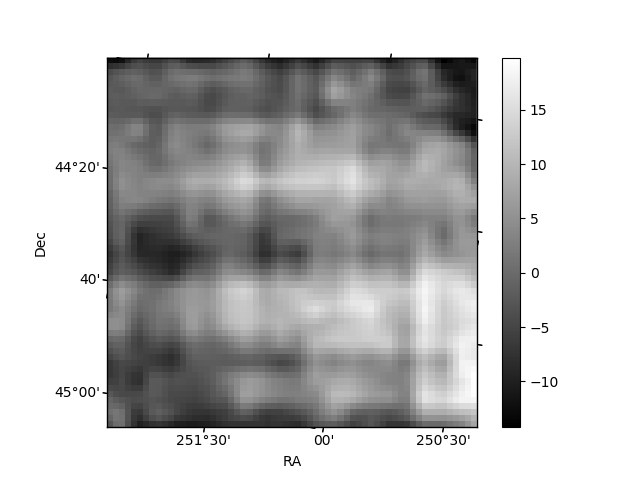
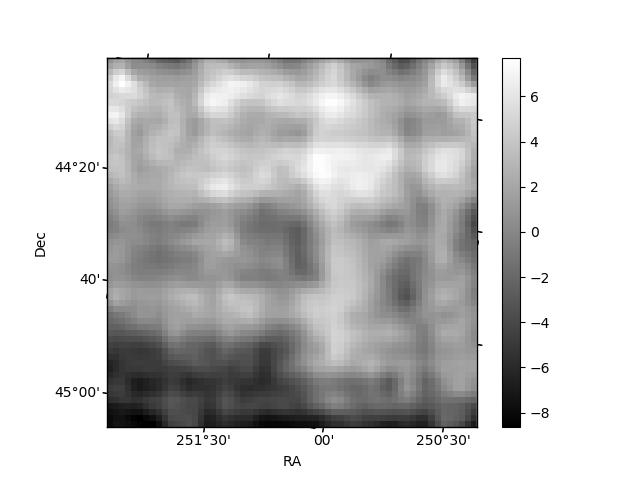
Histogram calculated using DETX and DETY for each event in the final _common_clean file
| Quadrant A | 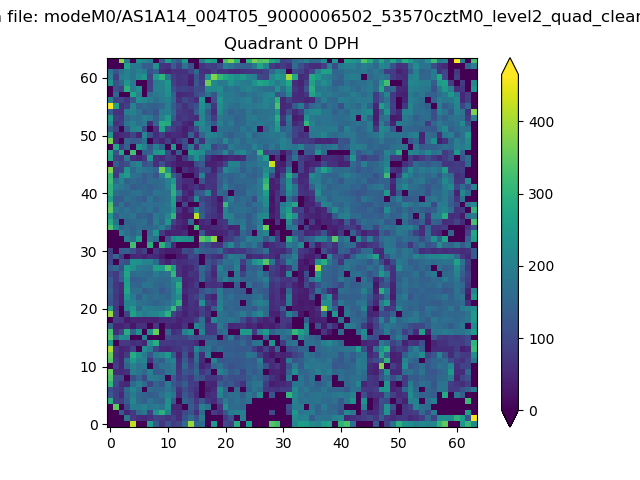 |
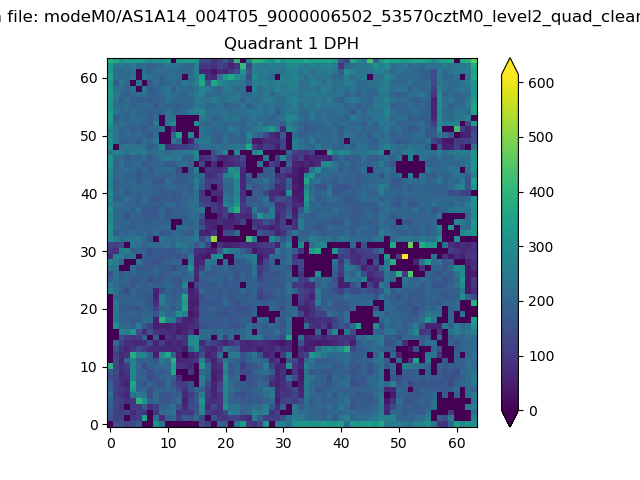 |
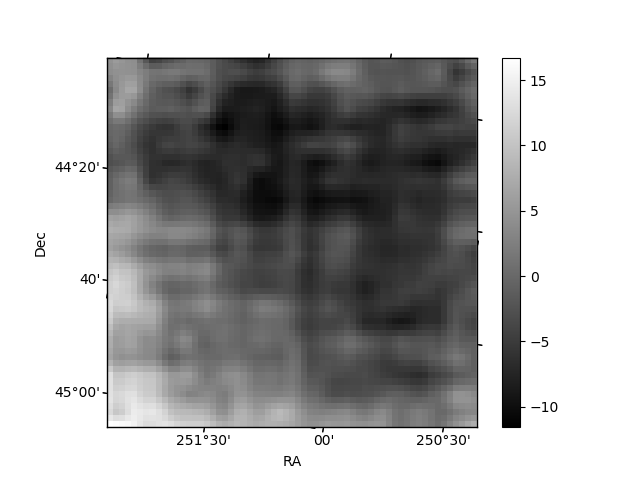
Quadrant B |
|---|---|---|---|
| Quadrant D | 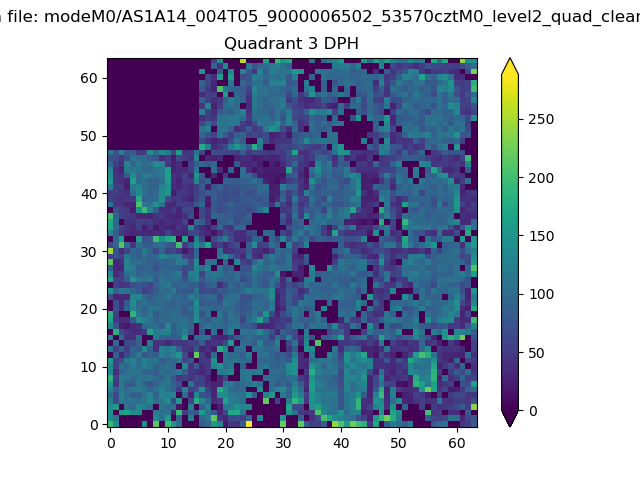 |
 |
Quadrant C |
| Plot type | Count rate plots | Images |
|---|---|---|
| Comparison with Poisson distribution Blue bars denote a histogram of data divided into 1 sec bins. Red curve is a Poisson curve with rate = median count rate of data. |
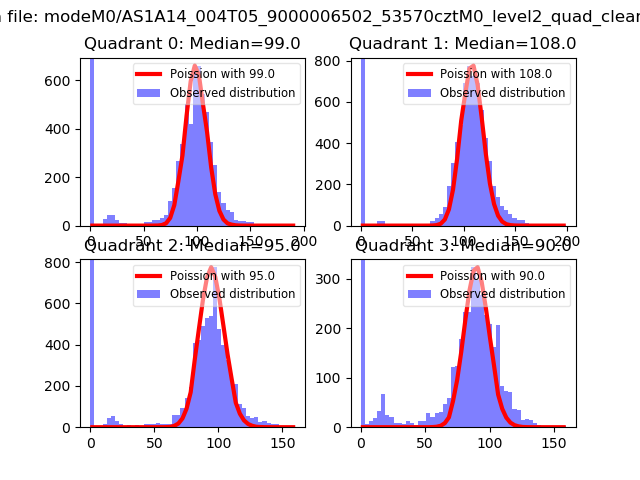 |
 |
| Quadrant-wise count rates Data is divided into 100 sec bins |
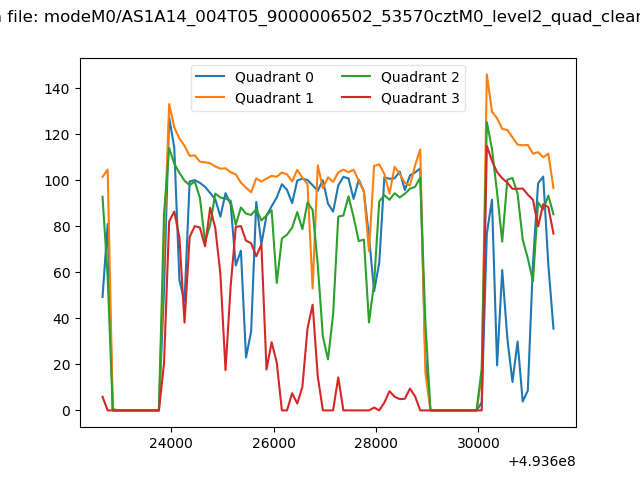 |
|
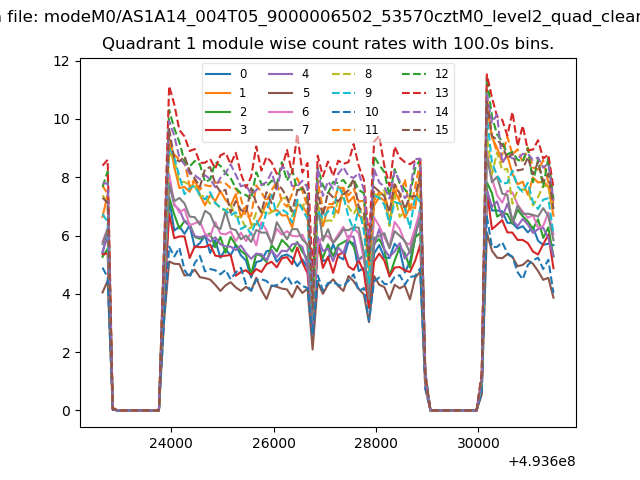
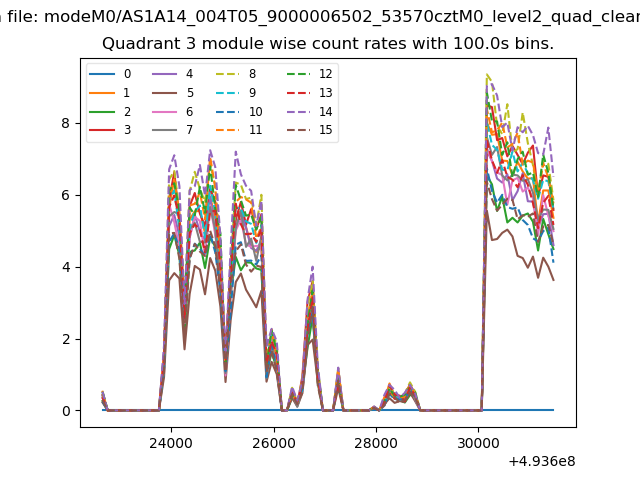
| Module-wise count rates for Quadrant A Data is divided into 100 sec bins |
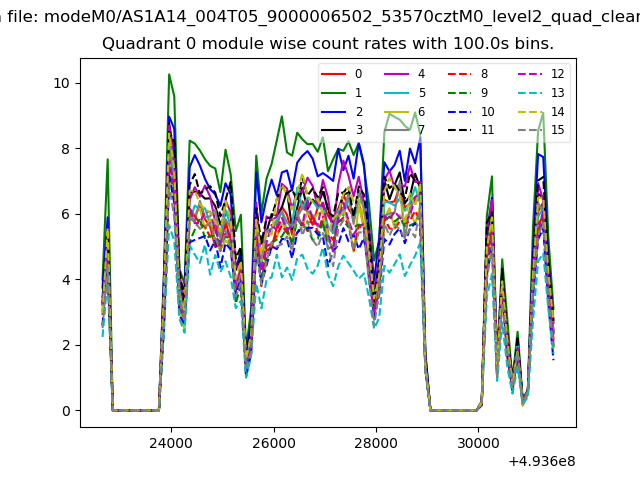 |
 |
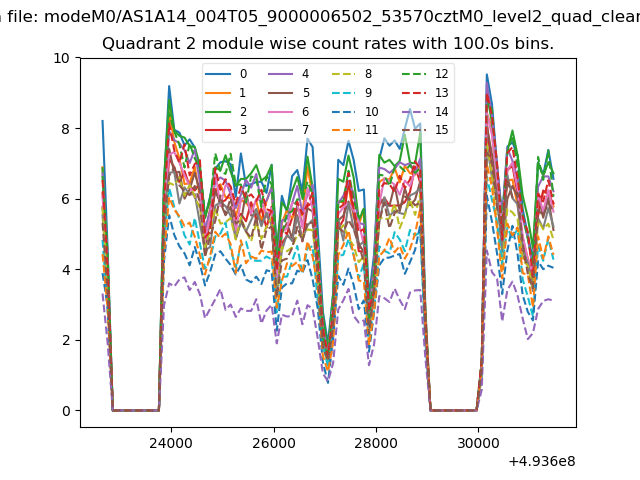
| Module-wise count rates for Quadrant B Data is divided into 100 sec bins |
 |
 |
| Module-wise count rates for Quadrant C Data is divided into 100 sec bins |
 |
 |
| Module-wise count rates for Quadrant D Data is divided into 100 sec bins |
 |
 |
| Parameter | Plot |
|---|---|
| CZT HV Monitor | 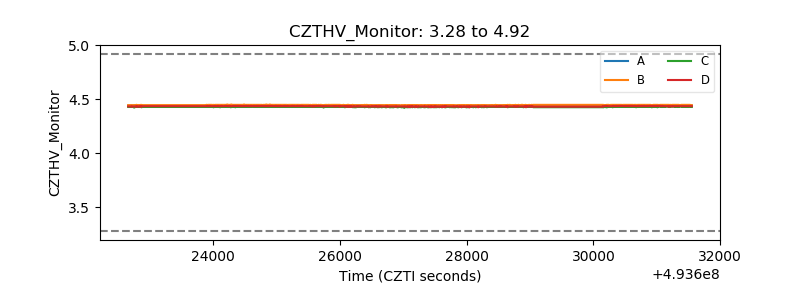 |
| D_VDD | 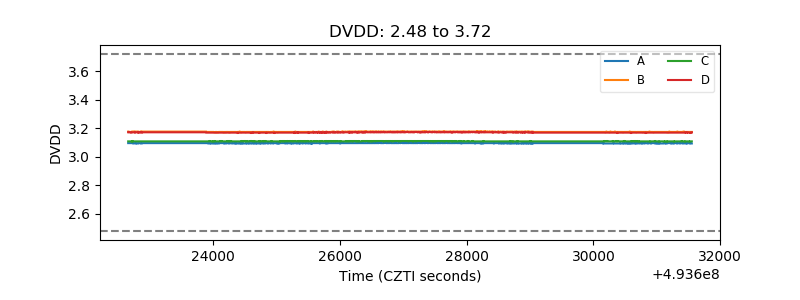 |
| Temperature 1 | 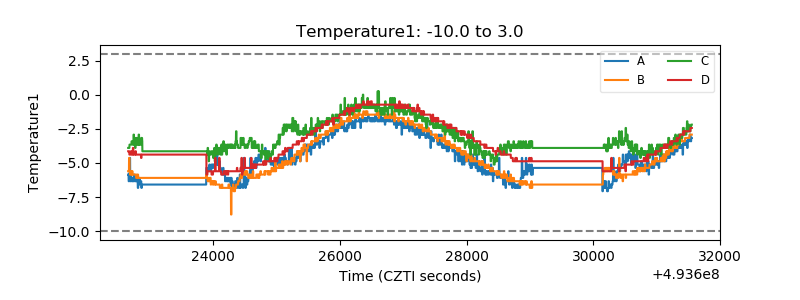 |
| Veto HV Monitor | 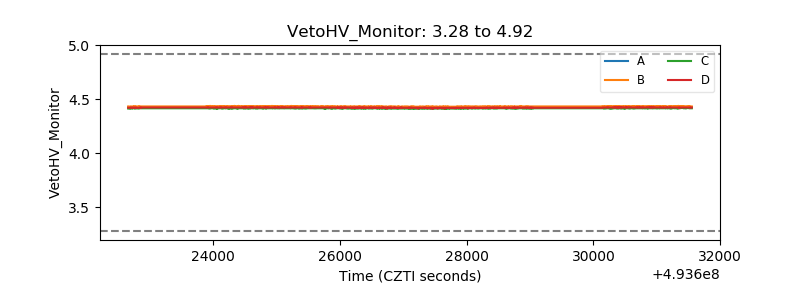 |
| Veto LLD | 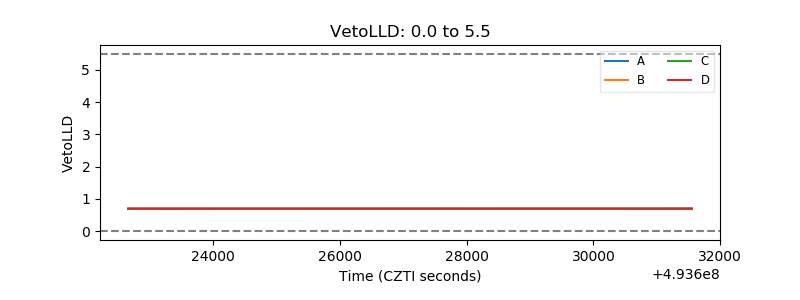 |
| Alpha Counter | 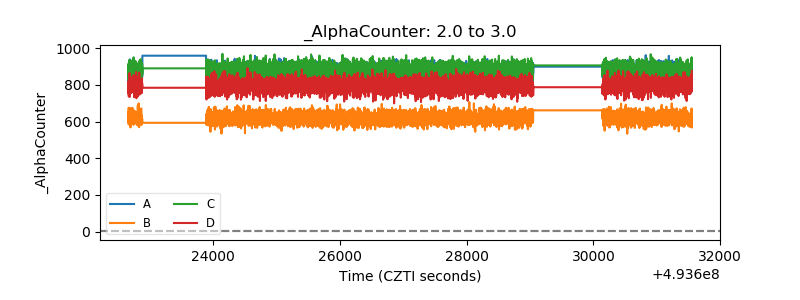 |
| _CPM_Rate | 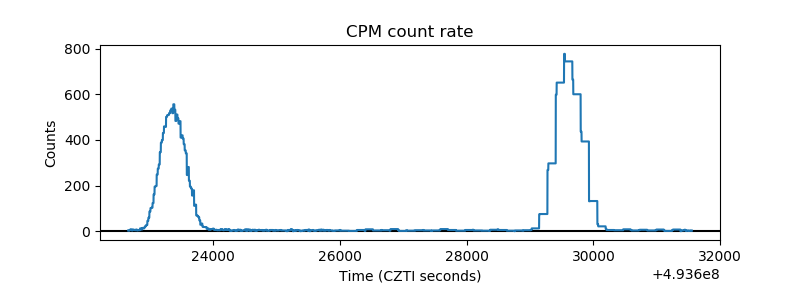 |
| CZT Counter | 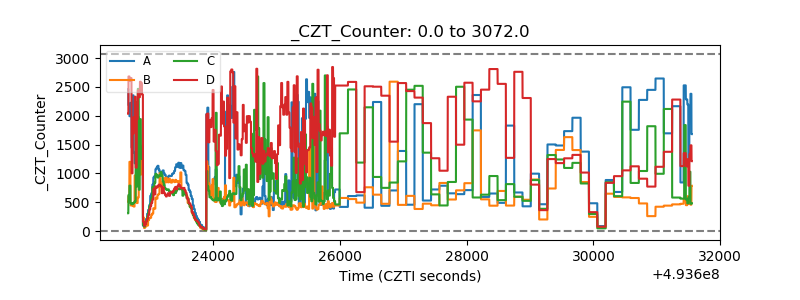 |
| +2.5 Volts monitor |  |
| +5 Volts monitor |  |
| _ROLL_ROT | 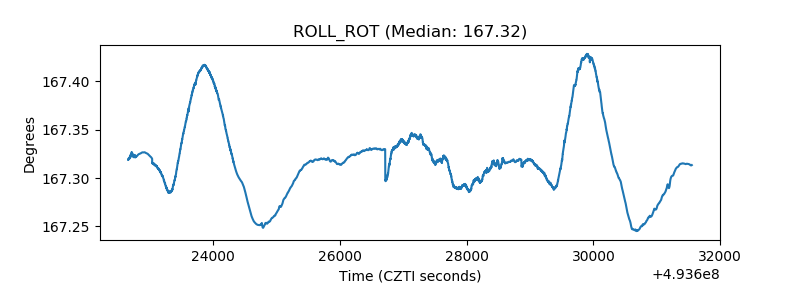 |
| _Roll_DEC | 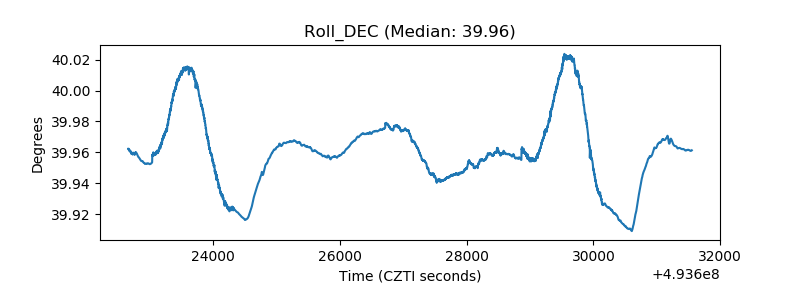 |
| _Roll_RA | 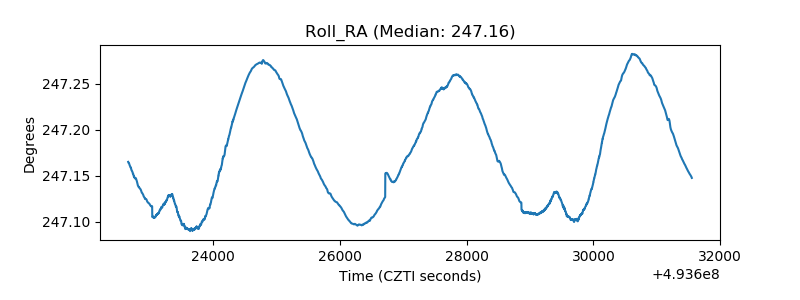 |
| Veto Counter | 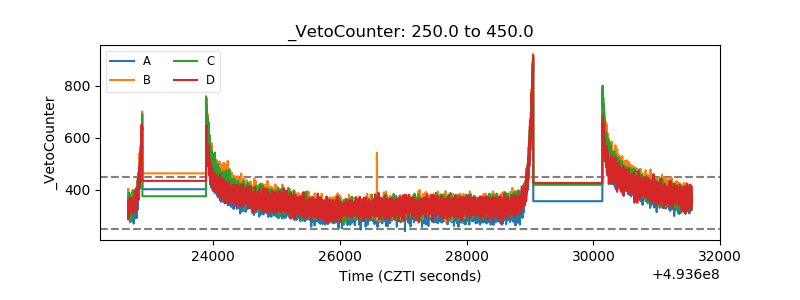 |