| Param | Original file | Final file |
|---|---|---|
| Filename | modeM0/AS1A14_004T05_9000006502_53571cztM0_level2.fits | modeM0/AS1A14_004T05_9000006502_53571cztM0_level2_quad_clean.evt |
| Size (bytes) | 916,269,120 | 80,703,360 |
| Size | 873.8 MB | 77.0 MB |
| Events in quadrant A | 10,583,332 | 354,529 |
| Events in quadrant B | 4,002,328 | 709,424 |
| Events in quadrant C | 8,610,975 | 486,773 |
| Events in quadrant D | 10,224,186 | 443,516 |
| Mode M9 | |||
|---|---|---|---|
| Quadrant | BADHDUFLAG | Total packets | Discarded packets |
| A | 0 | 11 | 0 |
| B | 0 | 11 | 0 |
| C | 0 | 11 | 0 |
| D | 0 | 11 | 0 |
| Mode SS | |||
|---|---|---|---|
| Quadrant | BADHDUFLAG | Total packets | Discarded packets |
| A | 0 | 132 | 0 |
| B | 0 | 132 | 0 |
| C | 0 | 132 | 0 |
| D | 0 | 132 | 0 |
| Mode M0 | |||
|---|---|---|---|
| Quadrant | BADHDUFLAG | Total packets | Discarded packets |
| A | 0 | 35879 | 2 |
| B | 0 | 16039 | 2 |
| C | 0 | 29993 | 2 |
| D | 0 | 34854 | 2 |
| Quadrant | Total seconds | Saturated seconds | Saturation percentage |
|---|---|---|---|
| A | 6435 | 3335 | 51.825952% |
| B | 6435 | 251 | 3.900544% |
| C | 6435 | 1815 | 28.205128% |
| D | 6435 | 1880 | 29.215229% |
Noise dominated data is calculated using 1-second bins in cleaned event files. If a bin has >2000 counts, and if more than 50% of those come from <1% of pixels, then it is considered to be noise-dominated and hence unusable.
| Quadrant | # 1 sec bins | Bins with >0 counts | Bins with >2000 counts | High rate bins dominated by noise | Noise dominated (total time) | Noise dominated (detector-on time) | Marked lightcurve |
|---|---|---|---|---|---|---|---|
| A | 7600 | 6436 | 2382 | 2382 | 31.34% | 37.01% | 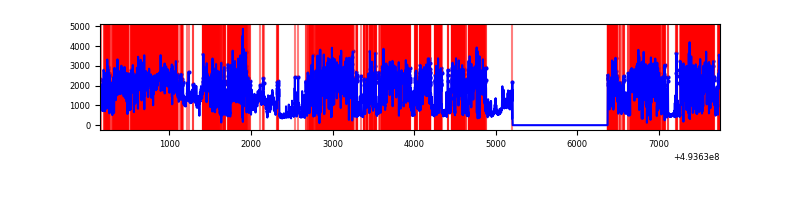 |
| B | 7600 | 6436 | 112 | 112 | 1.47% | 1.74% | 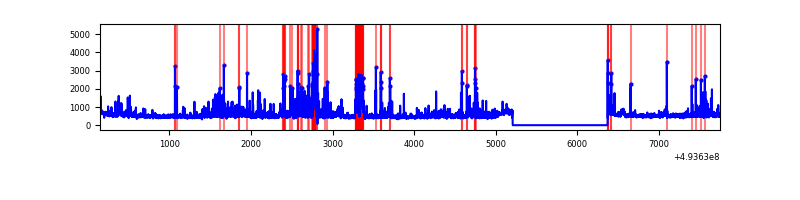 |
| C | 7600 | 6436 | 1510 | 1510 | 19.87% | 23.46% | 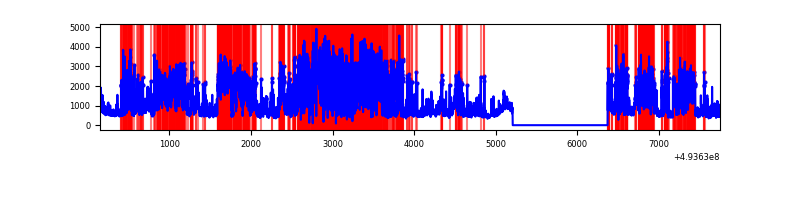 |
| D | 7600 | 6436 | 1585 | 1585 | 20.86% | 24.63% | 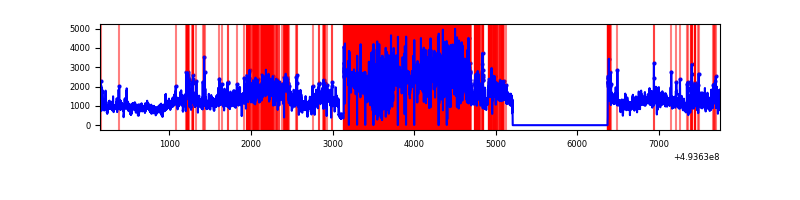 |
Top three noisy pixels from each quadrant. If the there are fewer than three noisy pixels in the level2.evt file, extra rows are filled as -1
| Pixel properties | Quadrant properties | ||||||
|---|---|---|---|---|---|---|---|
| Quadrant | DetID | PixID | Counts | Sigma | Mean | Median | Sigma |
| A | 3 | 63 | 4559533 | 32654.53 | 565 | 550 | 139.6 |
| A | 12 | 115 | 1996127 | 14293.67 | 565 | 550 | 139.6 |
| A | 3 | 62 | 1092347 | 7820.19 | 565 | 550 | 139.6 |
| B | 2 | 249 | 331828 | 2111.76 | 731 | 708 | 156.8 |
| B | 0 | 213 | 173752 | 1103.61 | 731 | 708 | 156.8 |
| B | 10 | 247 | 98461 | 623.43 | 731 | 708 | 156.8 |
| C | 15 | 224 | 2503377 | 14075.47 | 641 | 636 | 177.8 |
| C | 15 | 178 | 2450314 | 13777.04 | 641 | 636 | 177.8 |
| C | 1 | 241 | 565124 | 3174.69 | 641 | 636 | 177.8 |
| D | 2 | 172 | 4067687 | 24096.87 | 594 | 567 | 168.8 |
| D | 8 | 176 | 3282122 | 19442.55 | 594 | 567 | 168.8 |
| D | 13 | 153 | 127233 | 750.47 | 594 | 567 | 168.8 |
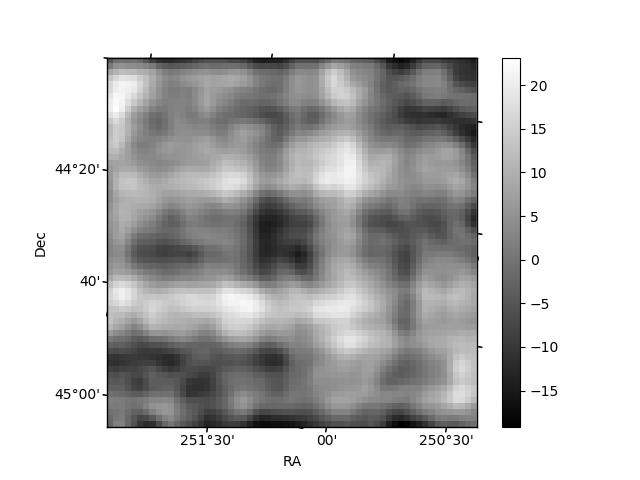
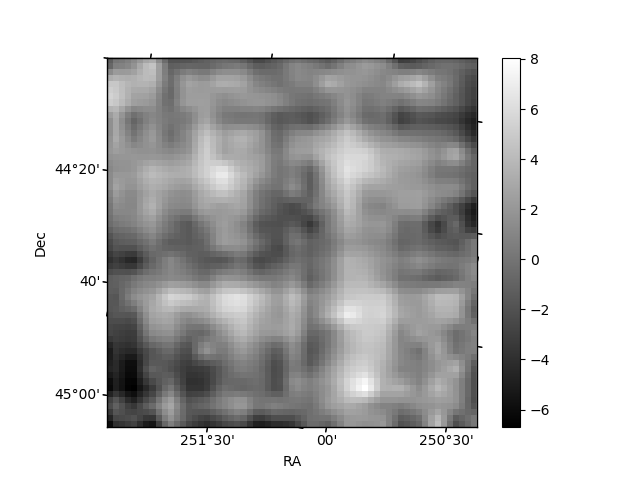
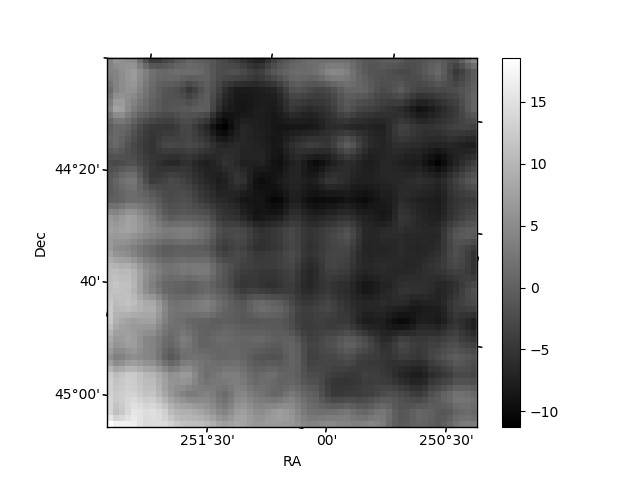
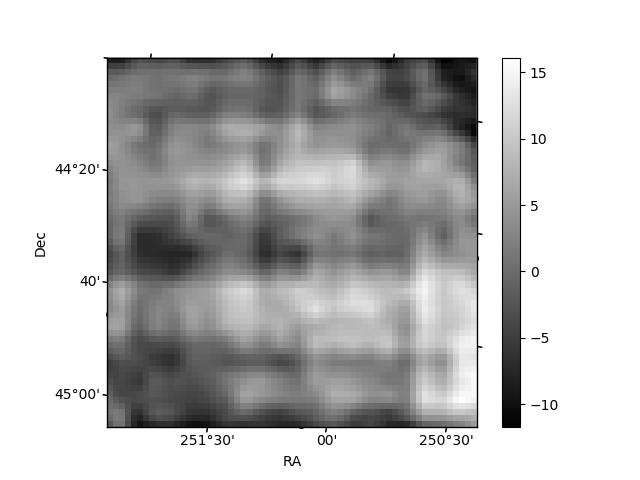
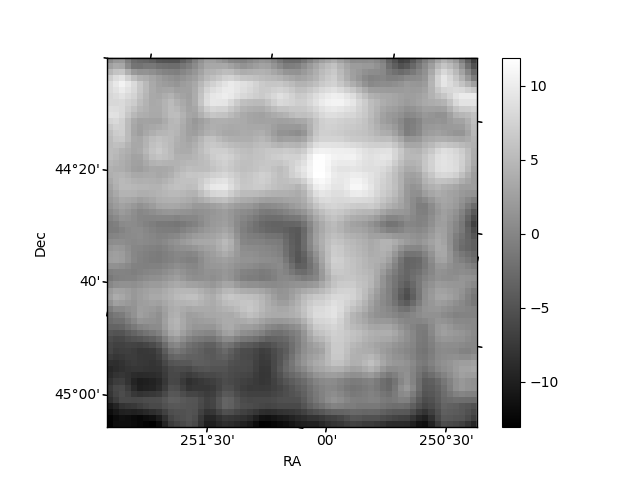
Histogram calculated using DETX and DETY for each event in the final _common_clean file
| Quadrant A | 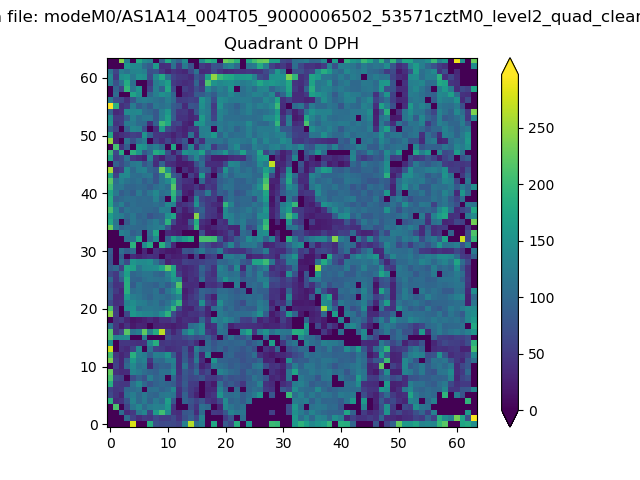 |
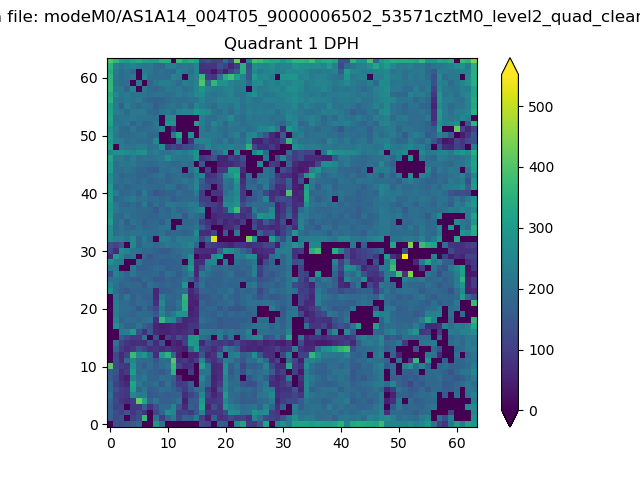 |
Quadrant B |
|---|---|---|---|
| Quadrant D | 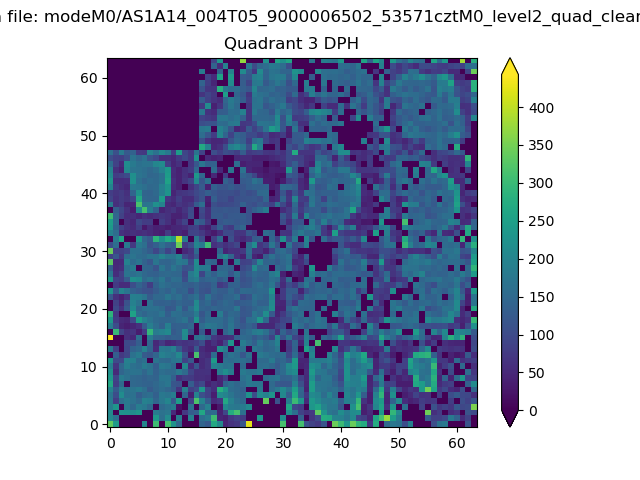 |
 |
Quadrant C |
| Plot type | Count rate plots | Images |
|---|---|---|
| Comparison with Poisson distribution Blue bars denote a histogram of data divided into 1 sec bins. Red curve is a Poisson curve with rate = median count rate of data. |
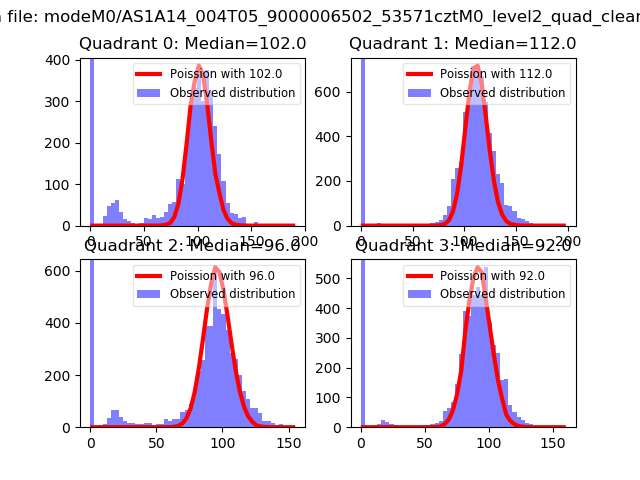 |
 |
| Quadrant-wise count rates Data is divided into 100 sec bins |
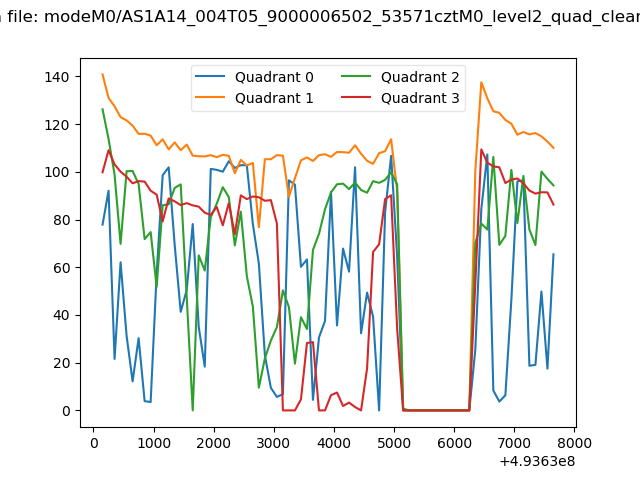 |
|
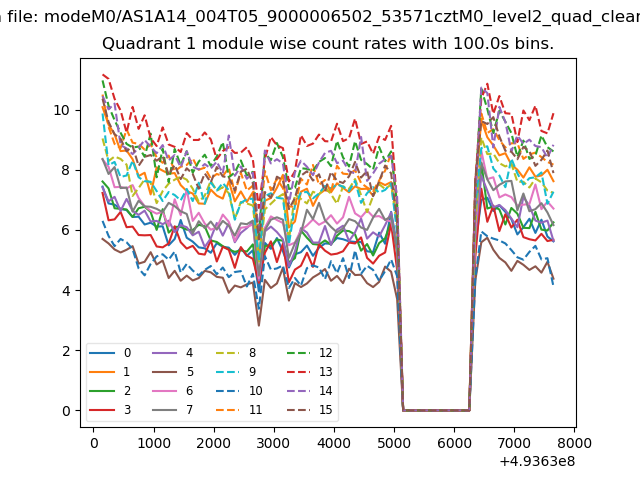
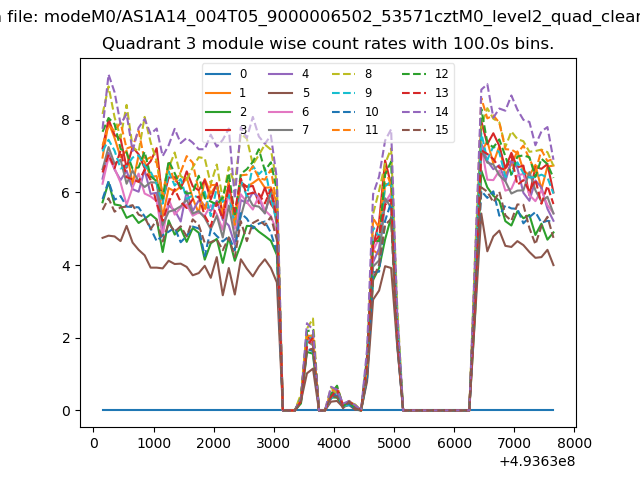
| Module-wise count rates for Quadrant A Data is divided into 100 sec bins |
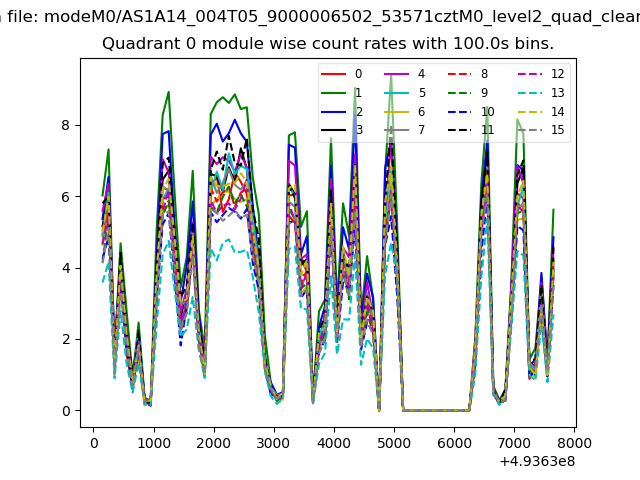 |
 |
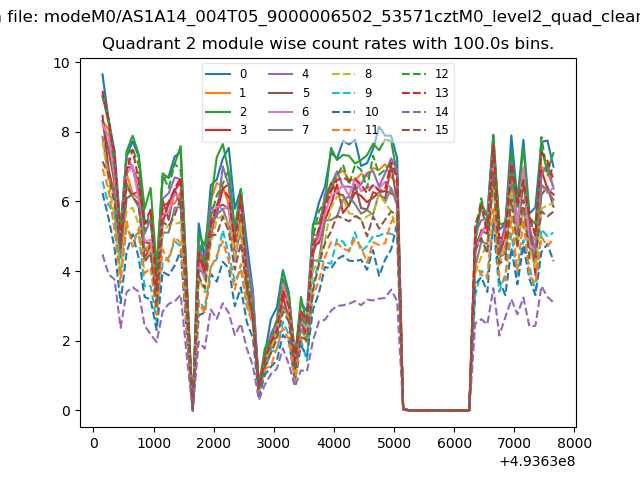
| Module-wise count rates for Quadrant B Data is divided into 100 sec bins |
 |
 |
| Module-wise count rates for Quadrant C Data is divided into 100 sec bins |
 |
 |
| Module-wise count rates for Quadrant D Data is divided into 100 sec bins |
 |
 |
| Parameter | Plot |
|---|---|
| CZT HV Monitor | 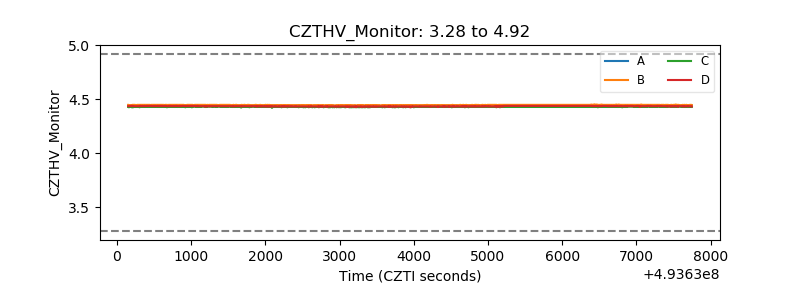 |
| D_VDD | 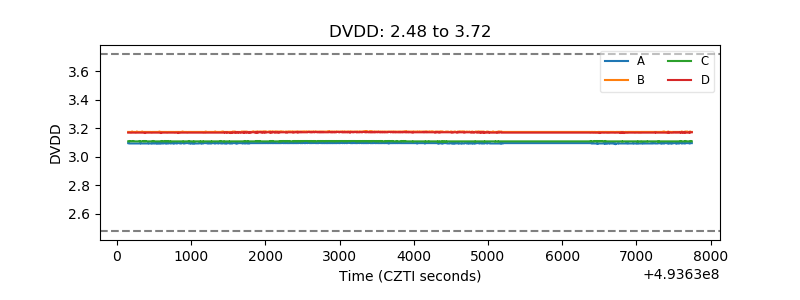 |
| Temperature 1 | 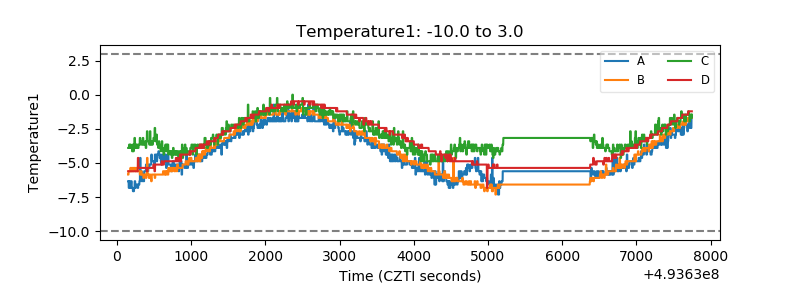 |
| Veto HV Monitor | 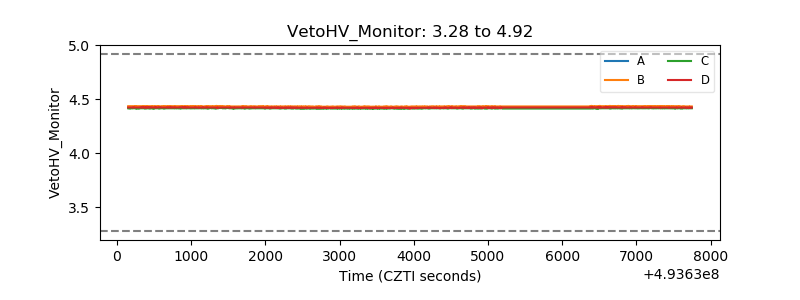 |
| Veto LLD | 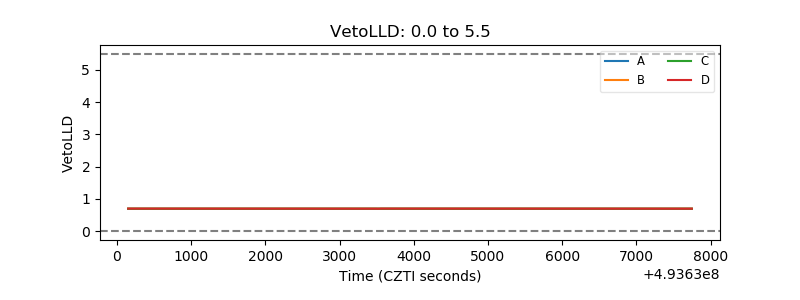 |
| Alpha Counter | 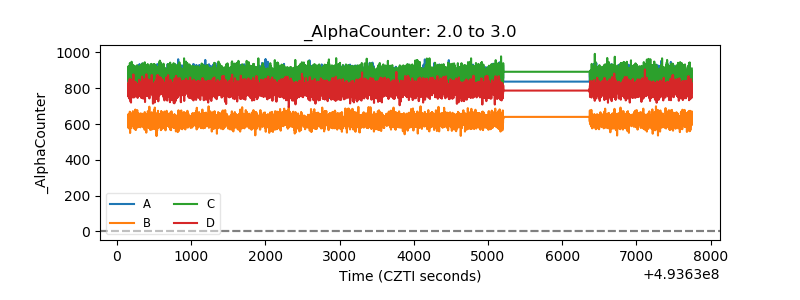 |
| _CPM_Rate | 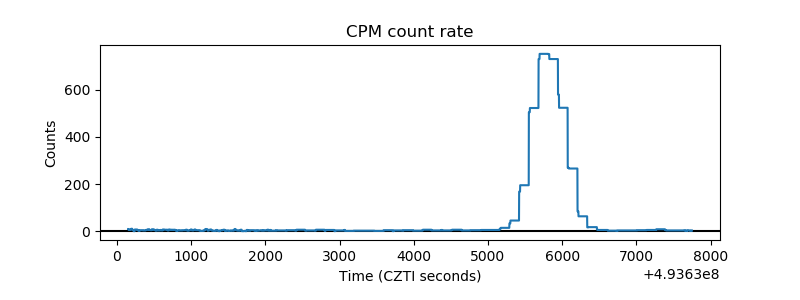 |
| CZT Counter | 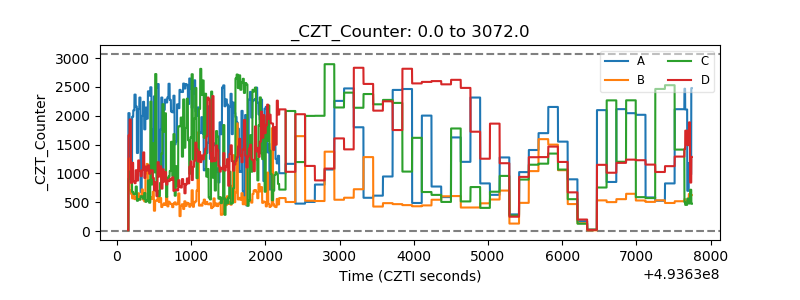 |
| +2.5 Volts monitor |  |
| +5 Volts monitor |  |
| _ROLL_ROT | 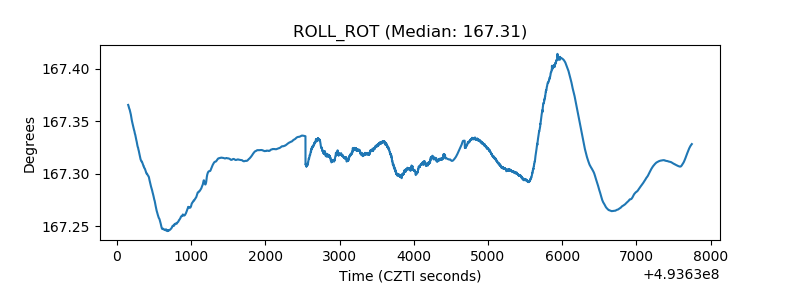 |
| _Roll_DEC | 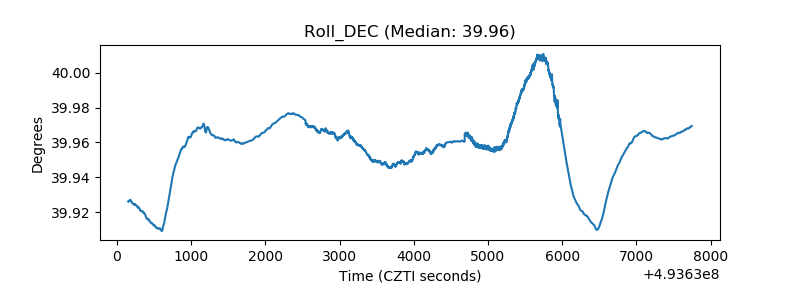 |
| _Roll_RA | 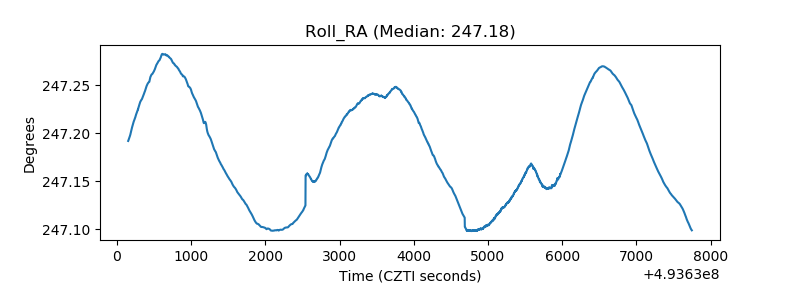 |
| Veto Counter | 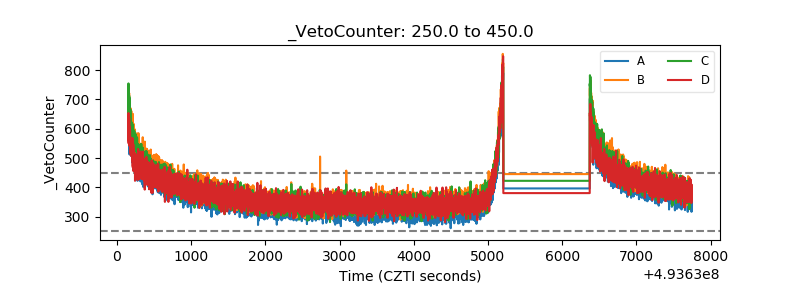 |