| Param | Original file | Final file |
|---|---|---|
| Filename | modeM0/AS1A14_004T05_9000006502_53572cztM0_level2.fits | modeM0/AS1A14_004T05_9000006502_53572cztM0_level2_quad_clean.evt |
| Size (bytes) | 775,388,160 | 89,208,000 |
| Size | 739.5 MB | 85.1 MB |
| Events in quadrant A | 9,345,532 | 436,505 |
| Events in quadrant B | 3,782,927 | 707,194 |
| Events in quadrant C | 7,281,550 | 524,397 |
| Events in quadrant D | 7,797,287 | 585,463 |
| Mode M9 | |||
|---|---|---|---|
| Quadrant | BADHDUFLAG | Total packets | Discarded packets |
| A | 0 | 16 | 0 |
| B | 0 | 17 | 0 |
| C | 0 | 17 | 0 |
| D | 0 | 17 | 0 |
| Mode SS | |||
|---|---|---|---|
| Quadrant | BADHDUFLAG | Total packets | Discarded packets |
| A | 0 | 132 | 0 |
| B | 0 | 132 | 0 |
| C | 0 | 132 | 0 |
| D | 0 | 132 | 0 |
| Mode M0 | |||
|---|---|---|---|
| Quadrant | BADHDUFLAG | Total packets | Discarded packets |
| A | 0 | 32202 | 2 |
| B | 0 | 15384 | 2 |
| C | 0 | 25938 | 2 |
| D | 0 | 27690 | 2 |
| Quadrant | Total seconds | Saturated seconds | Saturation percentage |
|---|---|---|---|
| A | 6407 | 2567 | 40.065553% |
| B | 6407 | 245 | 3.823943% |
| C | 6407 | 1442 | 22.506633% |
| D | 6407 | 376 | 5.868581% |
Noise dominated data is calculated using 1-second bins in cleaned event files. If a bin has >2000 counts, and if more than 50% of those come from <1% of pixels, then it is considered to be noise-dominated and hence unusable.
| Quadrant | # 1 sec bins | Bins with >0 counts | Bins with >2000 counts | High rate bins dominated by noise | Noise dominated (total time) | Noise dominated (detector-on time) | Marked lightcurve |
|---|---|---|---|---|---|---|---|
| A | 7577 | 6408 | 1736 | 1736 | 22.91% | 27.09% | 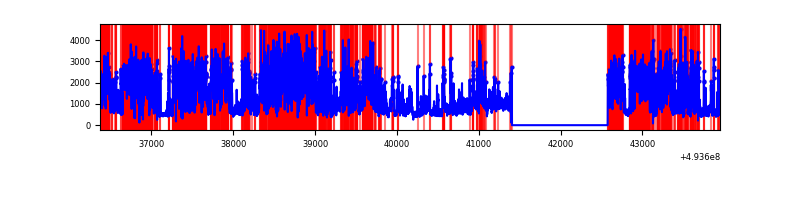 |
| B | 7577 | 6408 | 75 | 75 | 0.99% | 1.17% | 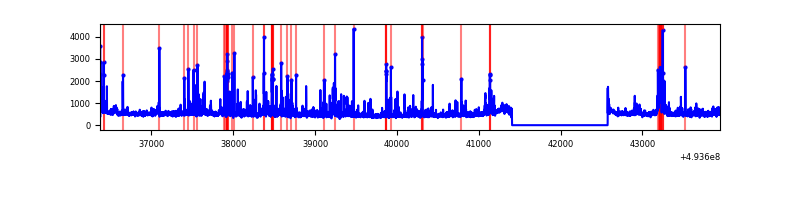 |
| C | 7577 | 6408 | 1097 | 1097 | 14.48% | 17.12% | 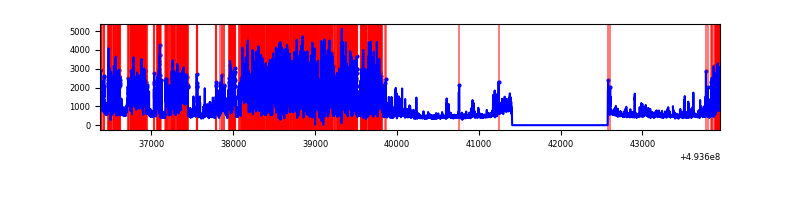 |
| D | 7577 | 6408 | 310 | 310 | 4.09% | 4.84% | 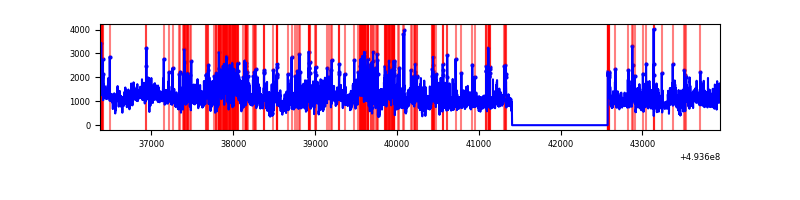 |
Top three noisy pixels from each quadrant. If the there are fewer than three noisy pixels in the level2.evt file, extra rows are filled as -1
| Pixel properties | Quadrant properties | ||||||
|---|---|---|---|---|---|---|---|
| Quadrant | DetID | PixID | Counts | Sigma | Mean | Median | Sigma |
| A | 3 | 63 | 3373543 | 22464.36 | 607 | 591 | 150.1 |
| A | 3 | 62 | 1084308 | 7217.72 | 607 | 591 | 150.1 |
| A | 4 | 239 | 1077271 | 7170.85 | 607 | 591 | 150.1 |
| B | 0 | 213 | 135902 | 867.01 | 730 | 707 | 155.9 |
| B | 5 | 250 | 128950 | 822.43 | 730 | 707 | 155.9 |
| B | 2 | 249 | 100407 | 639.38 | 730 | 707 | 155.9 |
| C | 15 | 224 | 2840078 | 15681.11 | 656 | 648 | 181.1 |
| C | 15 | 178 | 1034561 | 5709.92 | 656 | 648 | 181.1 |
| C | 4 | 5 | 217277 | 1196.36 | 656 | 648 | 181.1 |
| D | 2 | 172 | 4067217 | 19977.2 | 714 | 683 | 203.6 |
| D | 12 | 1 | 148764 | 727.46 | 714 | 683 | 203.6 |
| D | 3 | 12 | 140438 | 686.56 | 714 | 683 | 203.6 |
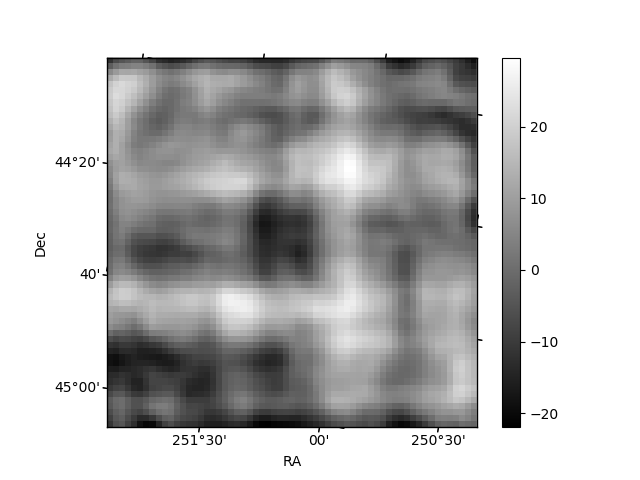
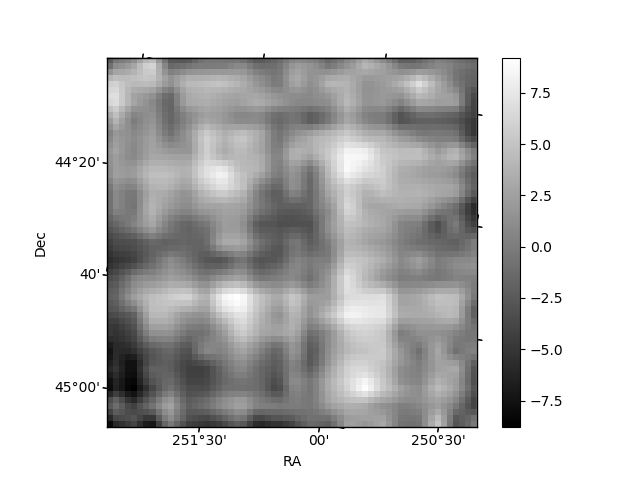
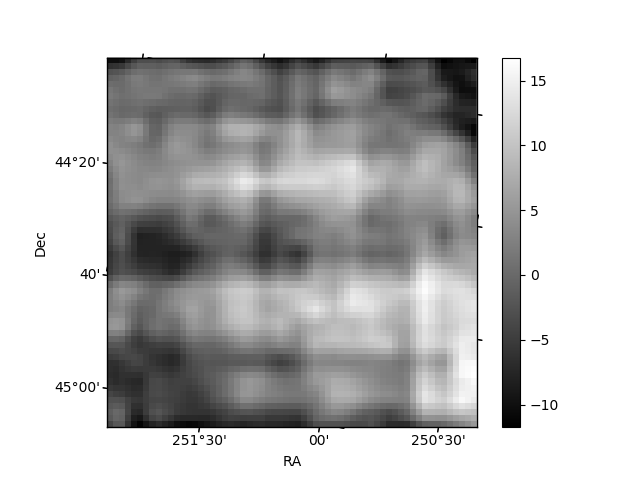
Histogram calculated using DETX and DETY for each event in the final _common_clean file
| Quadrant A | 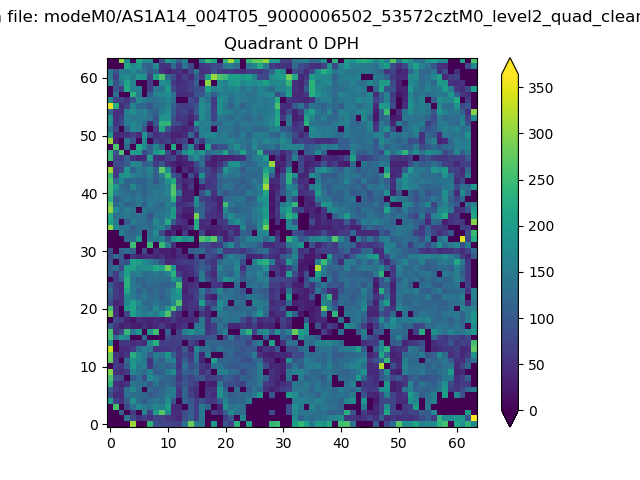 |
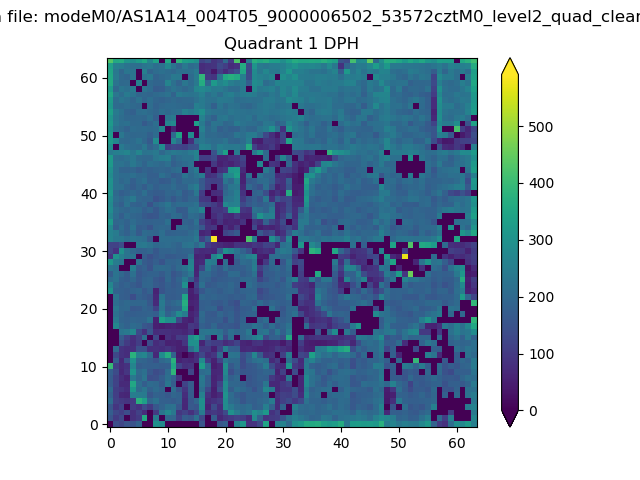 |
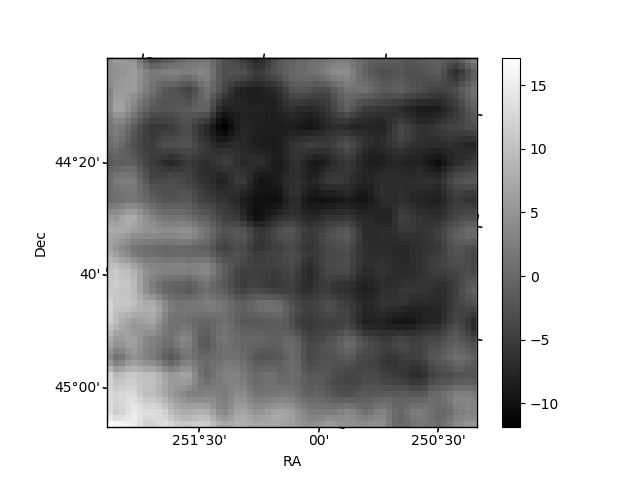
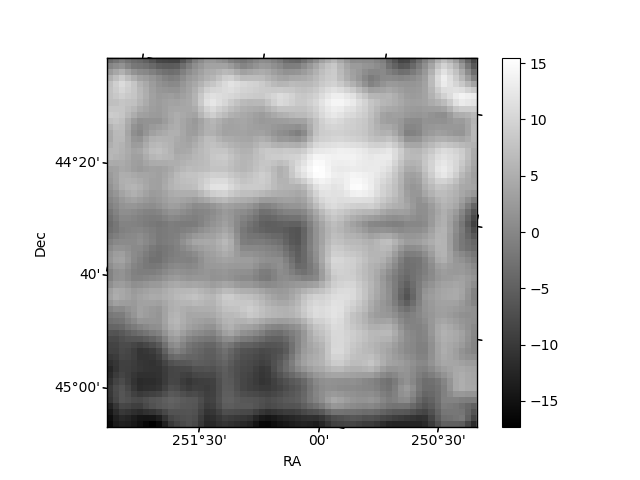
Quadrant B |
|---|---|---|---|
| Quadrant D | 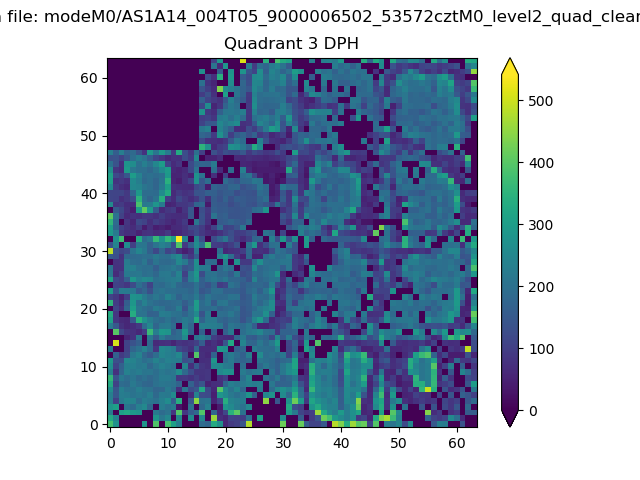 |
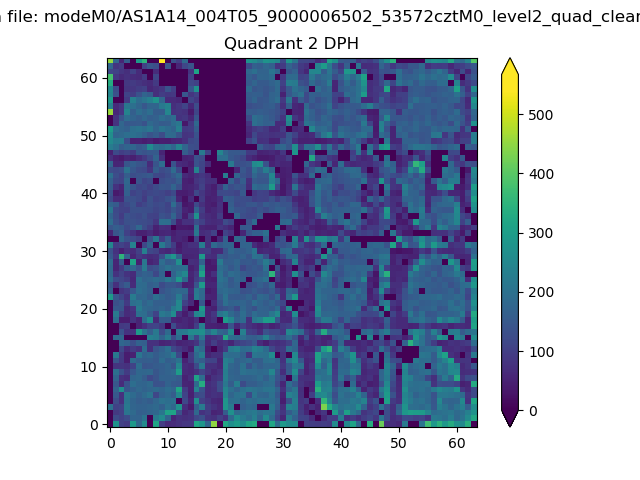 |
Quadrant C |
| Plot type | Count rate plots | Images |
|---|---|---|
| Comparison with Poisson distribution Blue bars denote a histogram of data divided into 1 sec bins. Red curve is a Poisson curve with rate = median count rate of data. |
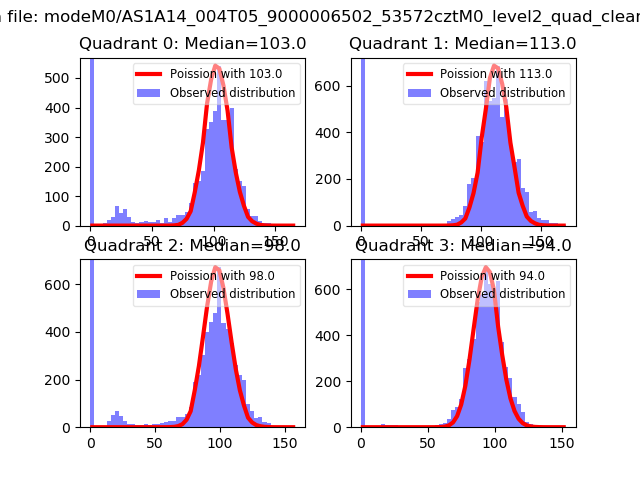 |
 |
| Quadrant-wise count rates Data is divided into 100 sec bins |
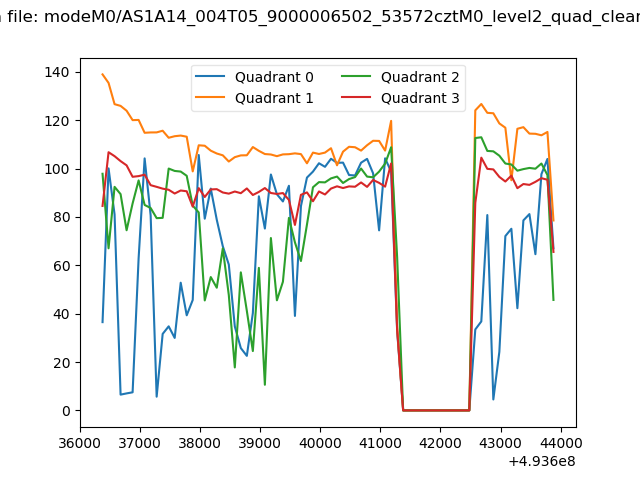 |
|
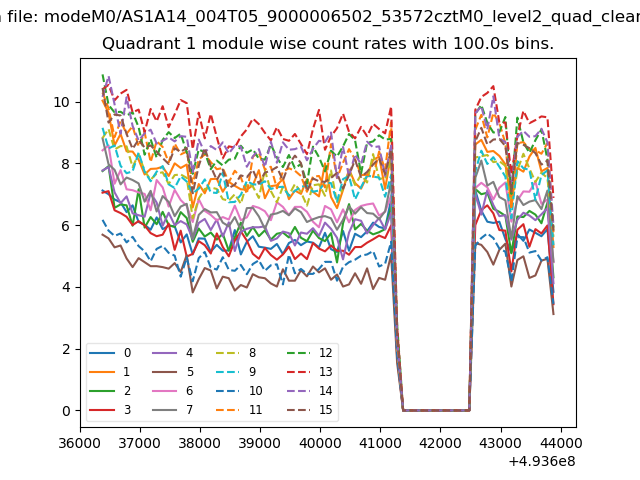
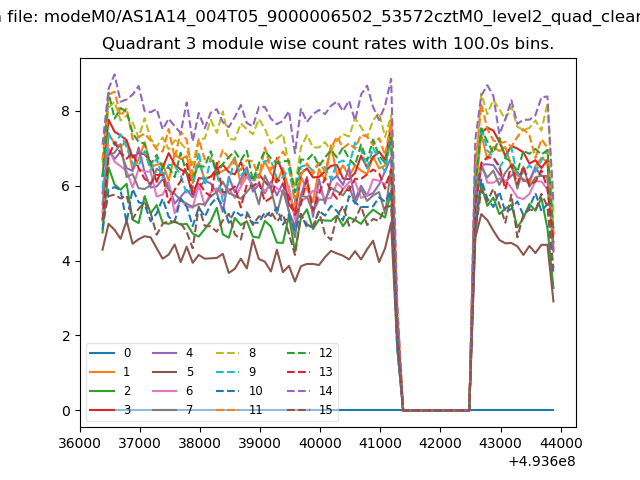
| Module-wise count rates for Quadrant A Data is divided into 100 sec bins |
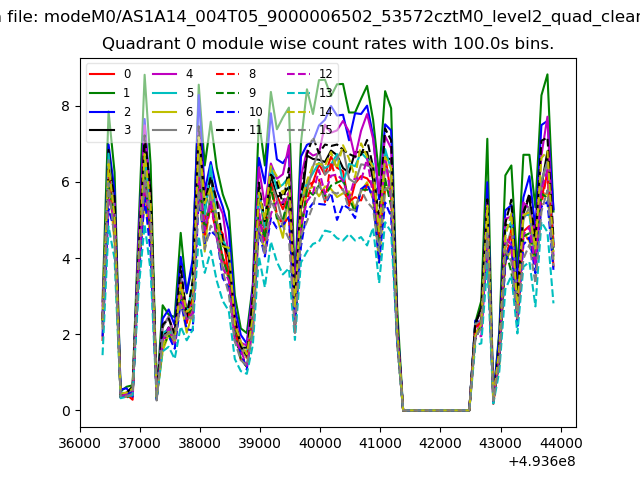 |
 |
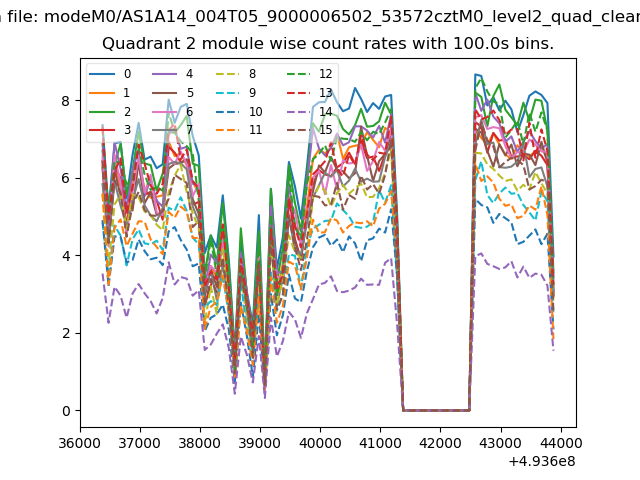
| Module-wise count rates for Quadrant B Data is divided into 100 sec bins |
 |
 |
| Module-wise count rates for Quadrant C Data is divided into 100 sec bins |
 |
 |
| Module-wise count rates for Quadrant D Data is divided into 100 sec bins |
 |
 |
| Parameter | Plot |
|---|---|
| CZT HV Monitor | 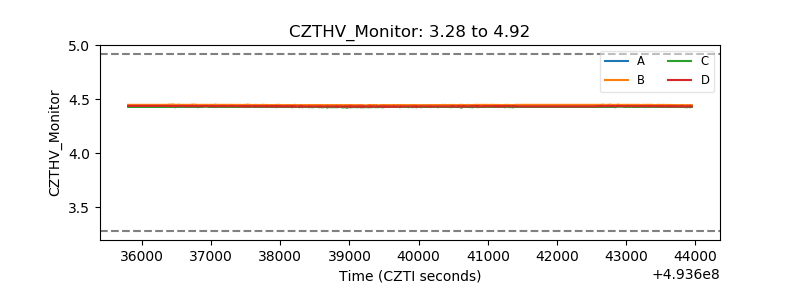 |
| D_VDD | 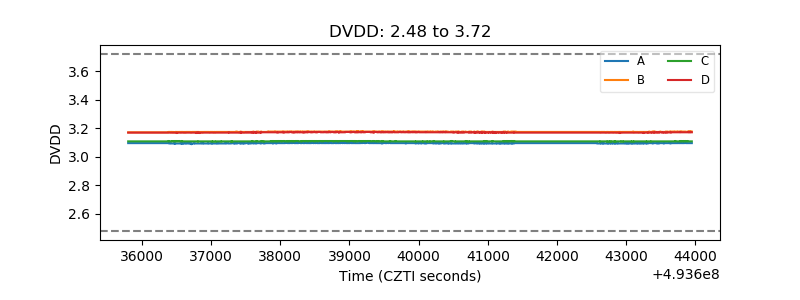 |
| Temperature 1 | 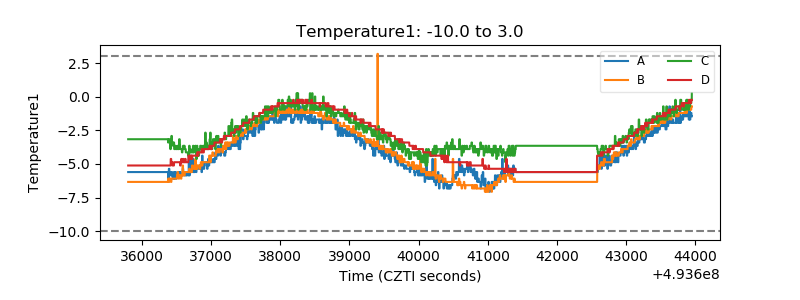 |
| Veto HV Monitor | 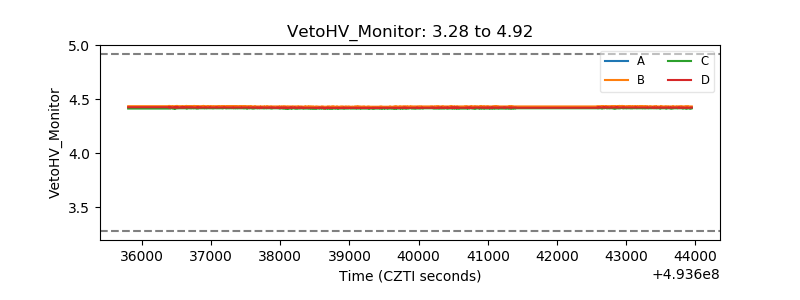 |
| Veto LLD | 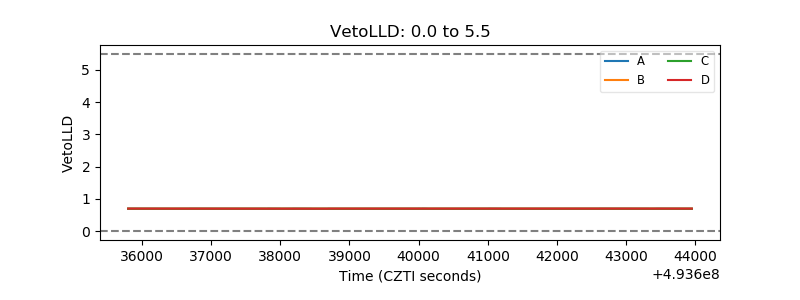 |
| Alpha Counter | 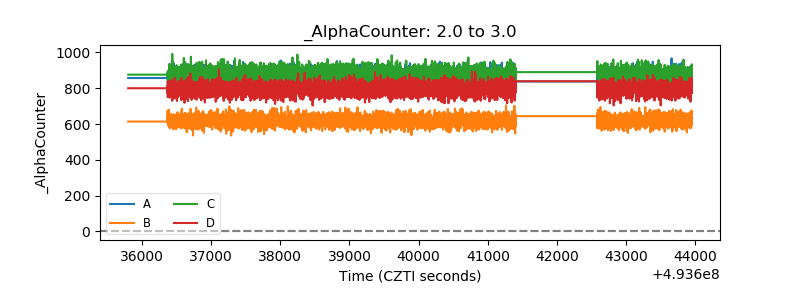 |
| _CPM_Rate | 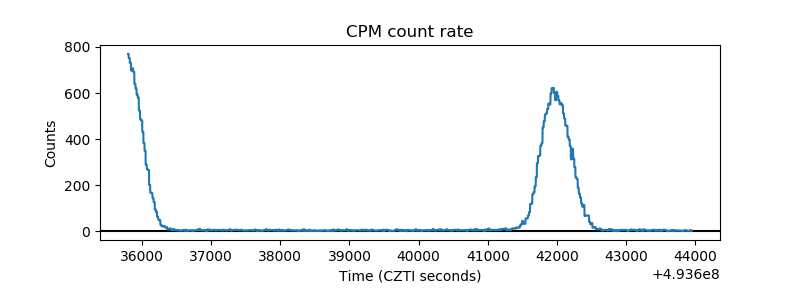 |
| CZT Counter | 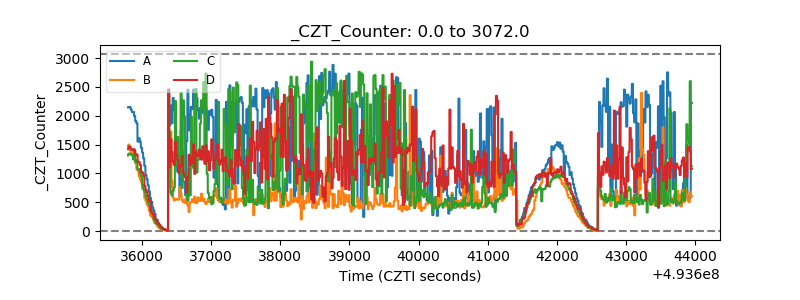 |
| +2.5 Volts monitor |  |
| +5 Volts monitor |  |
| _ROLL_ROT | 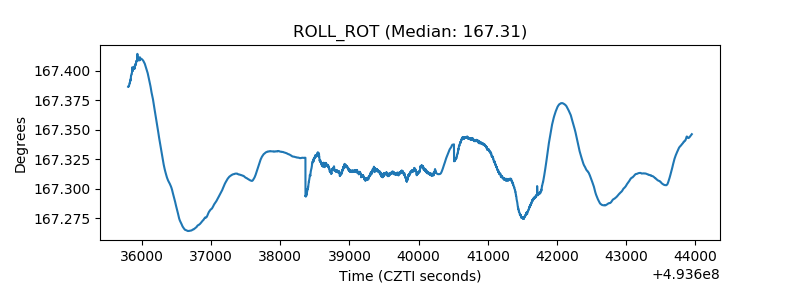 |
| _Roll_DEC | 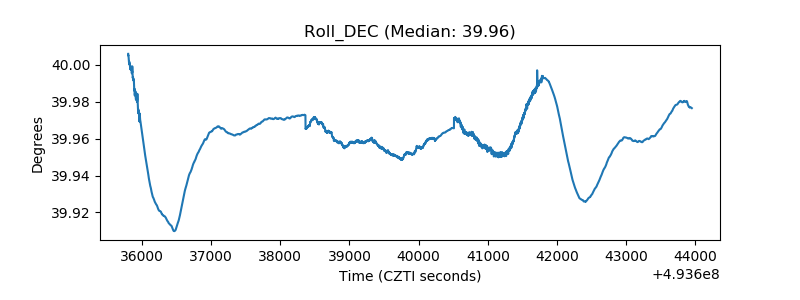 |
| _Roll_RA | 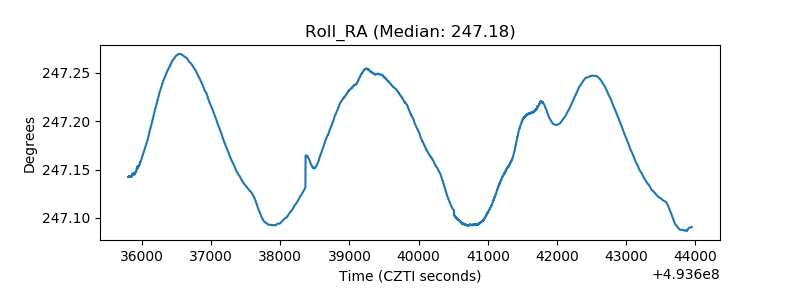 |
| Veto Counter | 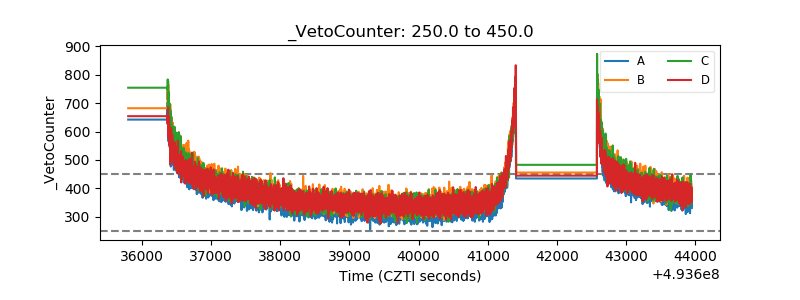 |