| Param | Original file | Final file |
|---|---|---|
| Filename | modeM0/AS1A14_004T05_9000006502_53573cztM0_level2.fits | modeM0/AS1A14_004T05_9000006502_53573cztM0_level2_quad_clean.evt |
| Size (bytes) | 841,262,400 | 93,816,000 |
| Size | 802.3 MB | 89.5 MB |
| Events in quadrant A | 7,275,772 | 596,935 |
| Events in quadrant B | 4,948,248 | 711,675 |
| Events in quadrant C | 9,056,526 | 470,791 |
| Events in quadrant D | 9,334,808 | 586,561 |
| Mode M9 | |||
|---|---|---|---|
| Quadrant | BADHDUFLAG | Total packets | Discarded packets |
| A | 0 | 11 | 0 |
| B | 0 | 12 | 0 |
| C | 0 | 12 | 0 |
| D | 0 | 12 | 0 |
| Mode SS | |||
|---|---|---|---|
| Quadrant | BADHDUFLAG | Total packets | Discarded packets |
| A | 0 | 138 | 0 |
| B | 0 | 138 | 0 |
| C | 0 | 138 | 0 |
| D | 0 | 138 | 0 |
| Mode M0 | |||
|---|---|---|---|
| Quadrant | BADHDUFLAG | Total packets | Discarded packets |
| A | 0 | 26321 | 2 |
| B | 0 | 19219 | 2 |
| C | 0 | 31481 | 2 |
| D | 0 | 32487 | 2 |
| Quadrant | Total seconds | Saturated seconds | Saturation percentage |
|---|---|---|---|
| A | 6810 | 1271 | 18.663730% |
| B | 6810 | 500 | 7.342144% |
| C | 6810 | 2271 | 33.348018% |
| D | 6810 | 725 | 10.646109% |
Noise dominated data is calculated using 1-second bins in cleaned event files. If a bin has >2000 counts, and if more than 50% of those come from <1% of pixels, then it is considered to be noise-dominated and hence unusable.
| Quadrant | # 1 sec bins | Bins with >0 counts | Bins with >2000 counts | High rate bins dominated by noise | Noise dominated (total time) | Noise dominated (detector-on time) | Marked lightcurve |
|---|---|---|---|---|---|---|---|
| A | 7920 | 6811 | 820 | 820 | 10.35% | 12.04% |  |
| B | 7920 | 6811 | 277 | 277 | 3.50% | 4.07% | 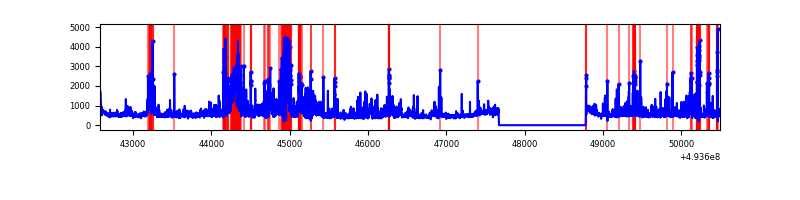 |
| C | 7919 | 6810 | 1864 | 1864 | 23.54% | 27.37% | 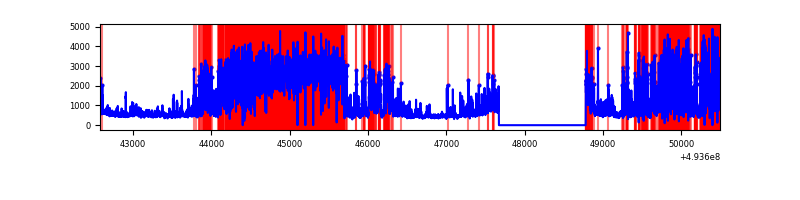 |
| D | 7920 | 6811 | 724 | 724 | 9.14% | 10.63% | 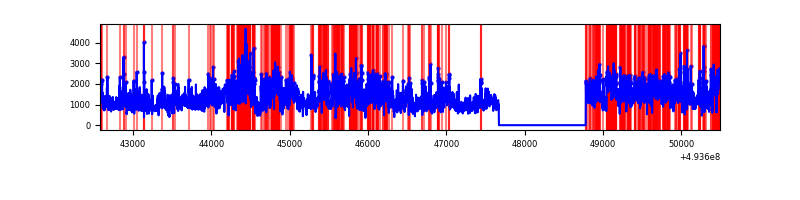 |
Top three noisy pixels from each quadrant. If the there are fewer than three noisy pixels in the level2.evt file, extra rows are filled as -1
| Pixel properties | Quadrant properties | ||||||
|---|---|---|---|---|---|---|---|
| Quadrant | DetID | PixID | Counts | Sigma | Mean | Median | Sigma |
| A | 3 | 63 | 1833941 | 10248.9 | 721 | 703 | 178.9 |
| A | 3 | 62 | 1320621 | 7379.13 | 721 | 703 | 178.9 |
| A | 15 | 174 | 828693 | 4628.96 | 721 | 703 | 178.9 |
| B | 2 | 249 | 665479 | 4170.98 | 749 | 724 | 159.4 |
| B | 10 | 28 | 355689 | 2227.21 | 749 | 724 | 159.4 |
| B | 5 | 185 | 291369 | 1823.64 | 749 | 724 | 159.4 |
| C | 15 | 224 | 2592578 | 14902.29 | 629 | 623 | 173.9 |
| C | 1 | 241 | 2171470 | 12481.16 | 629 | 623 | 173.9 |
| C | 15 | 178 | 1229516 | 7065.45 | 629 | 623 | 173.9 |
| D | 2 | 172 | 5706589 | 26867.49 | 740 | 705 | 212.4 |
| D | 11 | 176 | 189659 | 889.73 | 740 | 705 | 212.4 |
| D | 12 | 1 | 60192 | 280.11 | 740 | 705 | 212.4 |
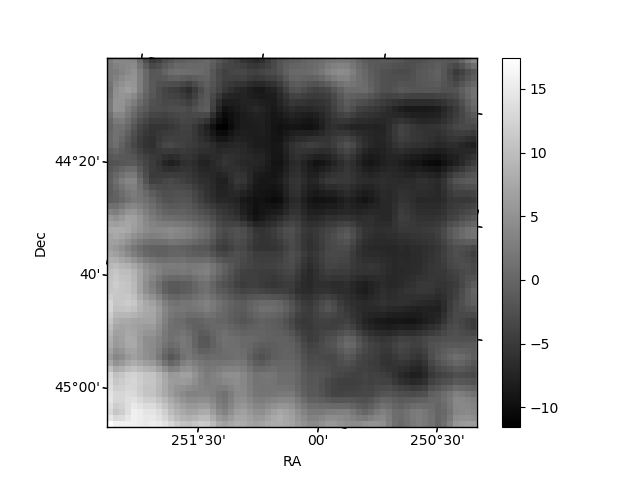
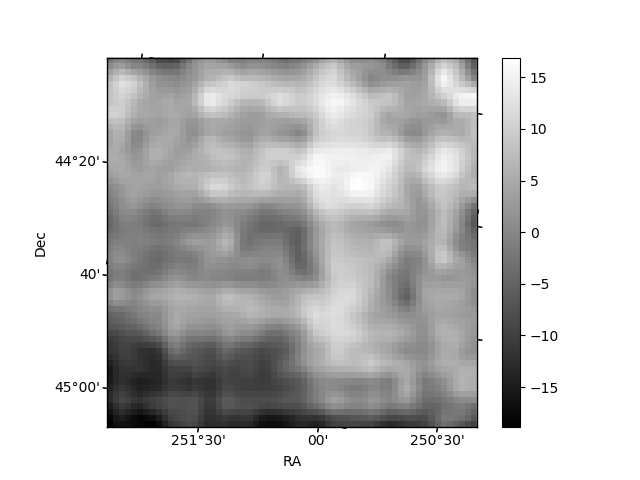
Histogram calculated using DETX and DETY for each event in the final _common_clean file
| Quadrant A | 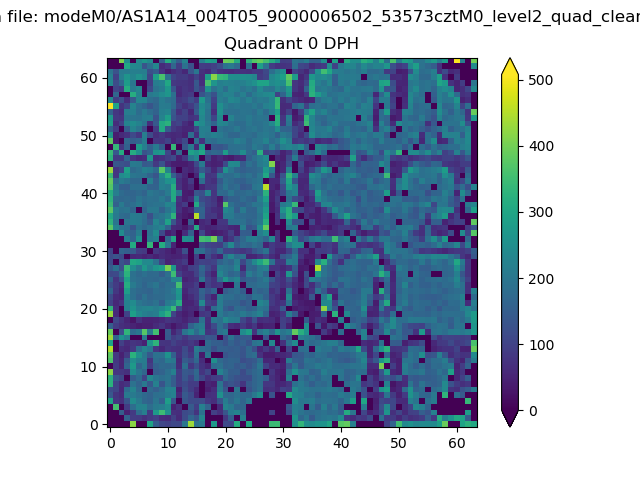 |
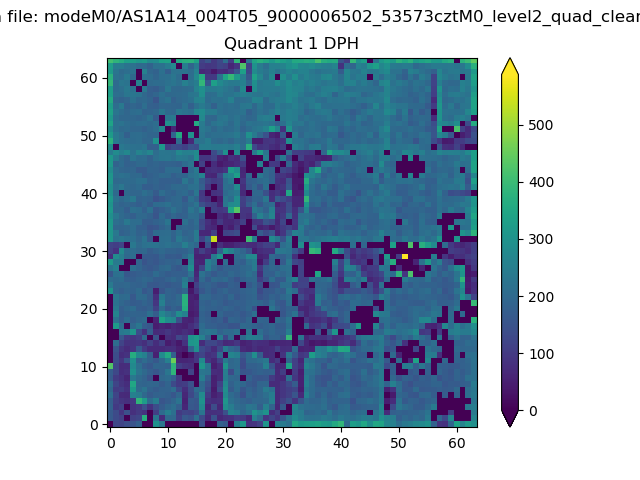 |
Quadrant B |
|---|---|---|---|
| Quadrant D | 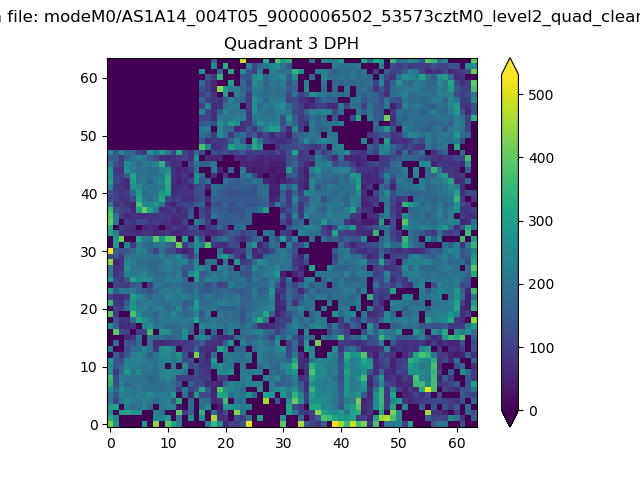 |
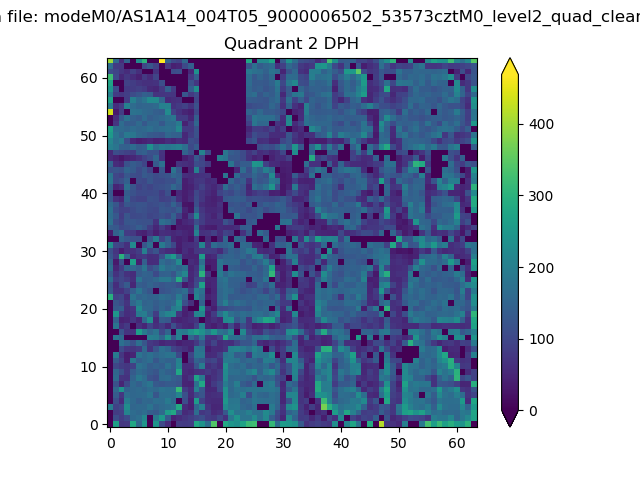 |
Quadrant C |
| Plot type | Count rate plots | Images |
|---|---|---|
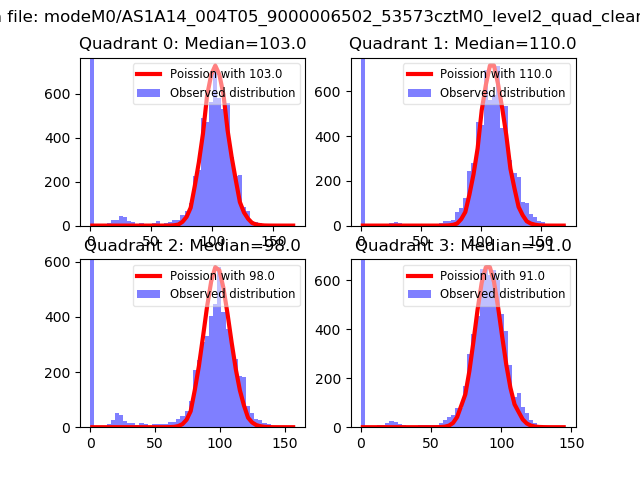
| Comparison with Poisson distribution Blue bars denote a histogram of data divided into 1 sec bins. Red curve is a Poisson curve with rate = median count rate of data. |
 |
 |
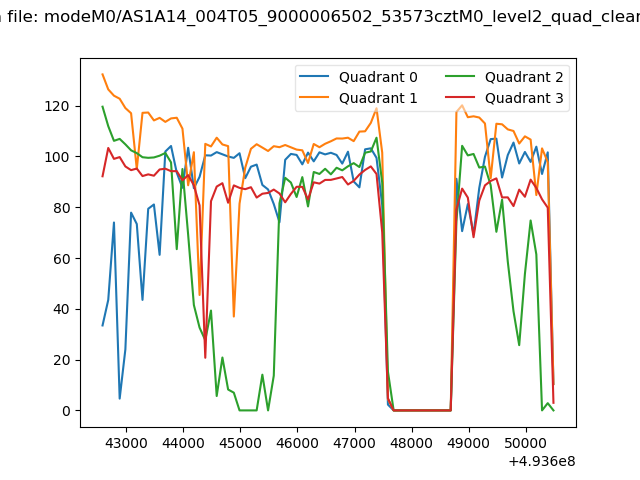
| Quadrant-wise count rates Data is divided into 100 sec bins |
 |
|
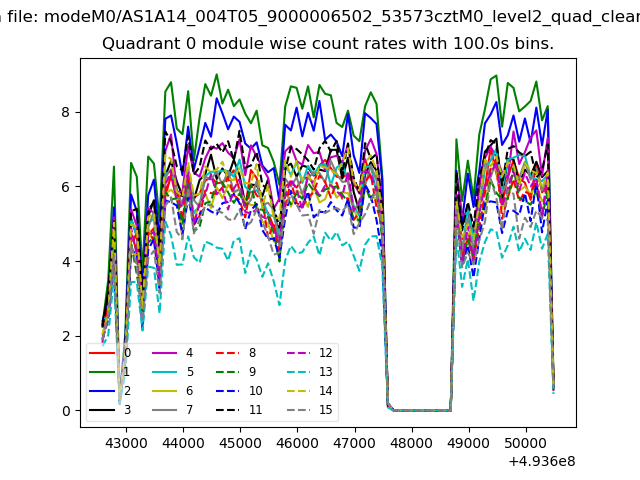
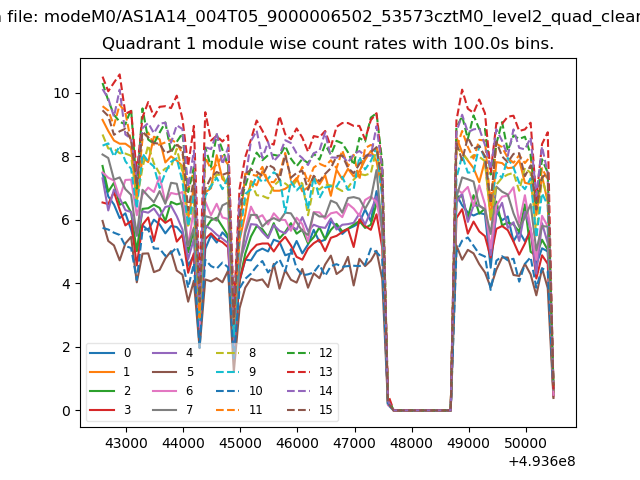
| Module-wise count rates for Quadrant A Data is divided into 100 sec bins |
 |
 |
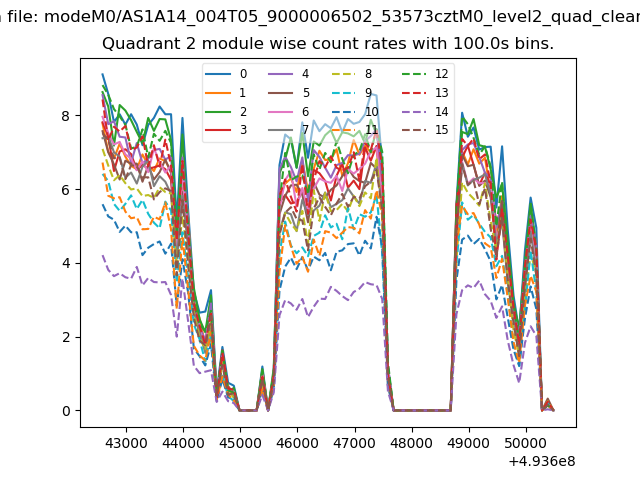
| Module-wise count rates for Quadrant B Data is divided into 100 sec bins |
 |
 |
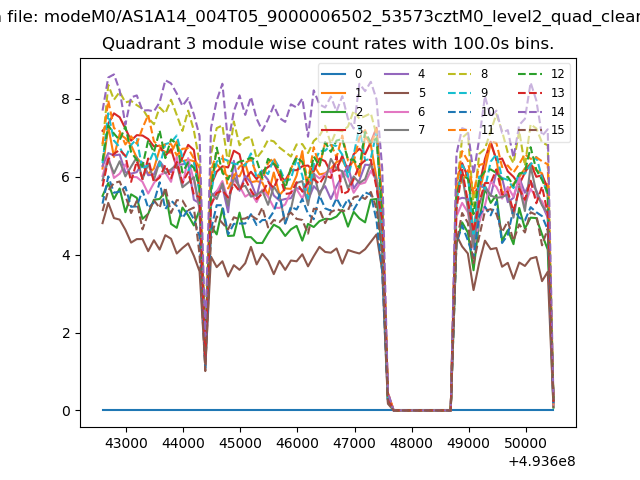
| Module-wise count rates for Quadrant C Data is divided into 100 sec bins |
 |
 |
| Module-wise count rates for Quadrant D Data is divided into 100 sec bins |
 |
 |
| Parameter | Plot |
|---|---|
| CZT HV Monitor | 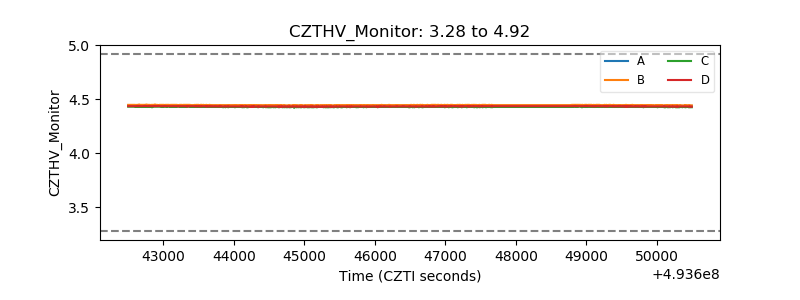 |
| D_VDD | 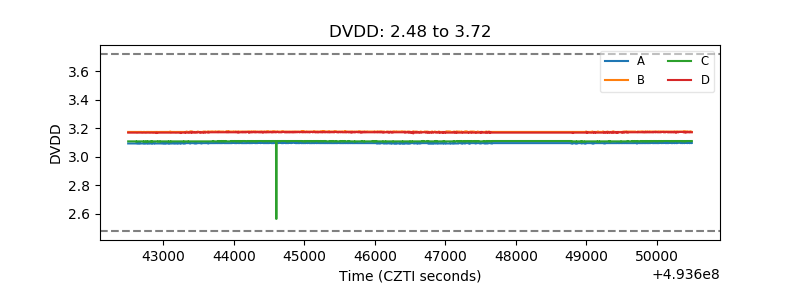 |
| Temperature 1 | 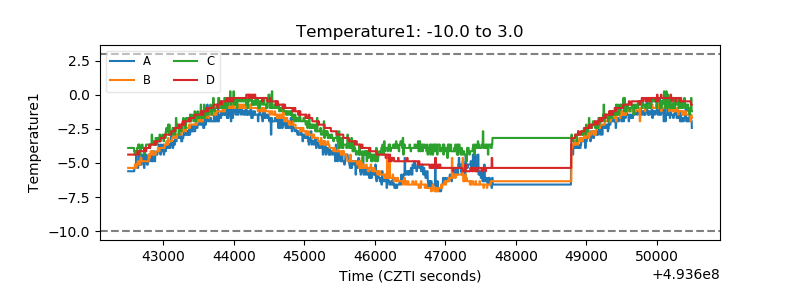 |
| Veto HV Monitor |  |
| Veto LLD | 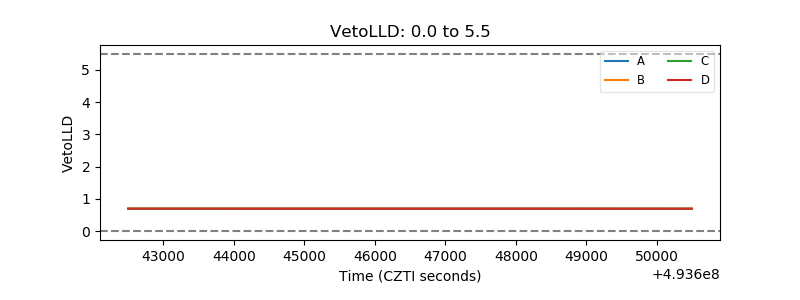 |
| Alpha Counter | 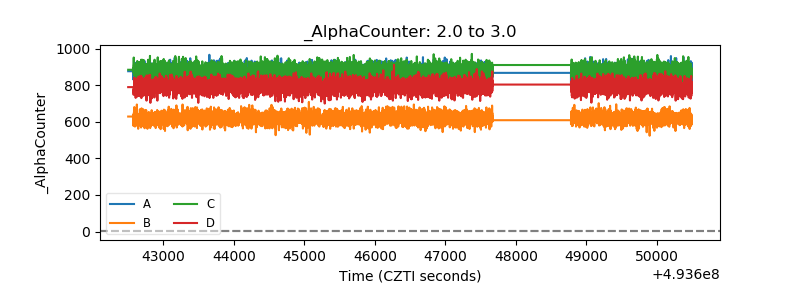 |
| _CPM_Rate | 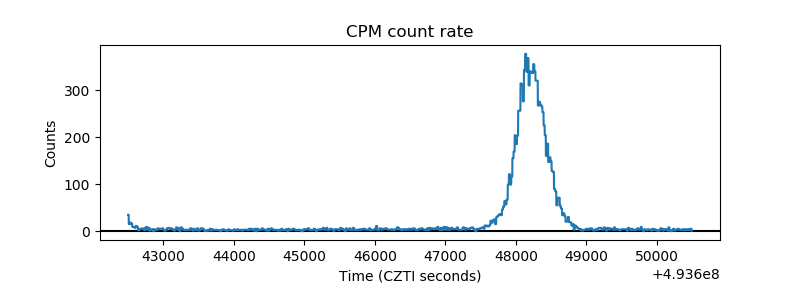 |
| CZT Counter |  |
| +2.5 Volts monitor | 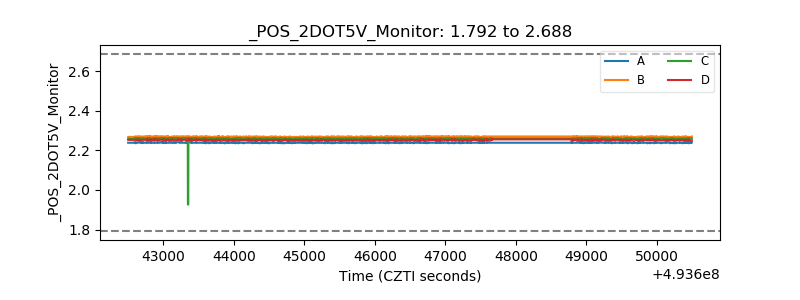 |
| +5 Volts monitor | 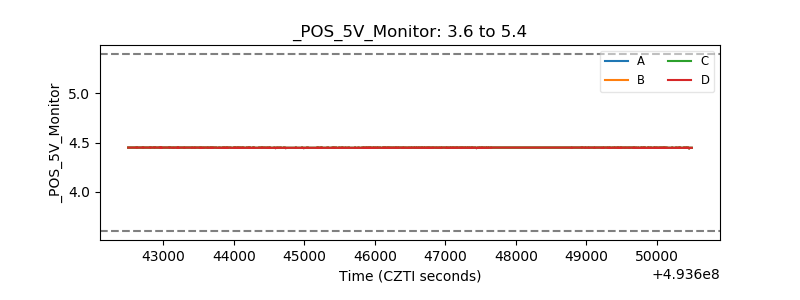 |
| _ROLL_ROT | 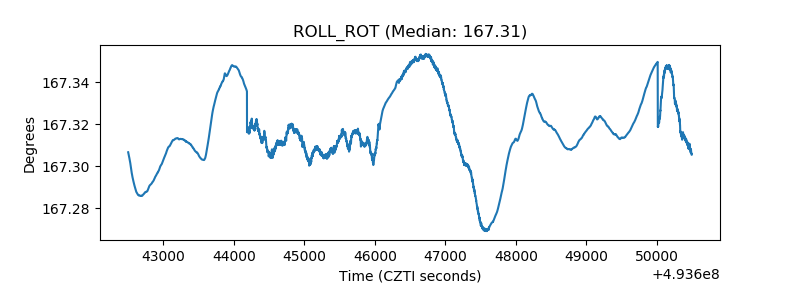 |
| _Roll_DEC | 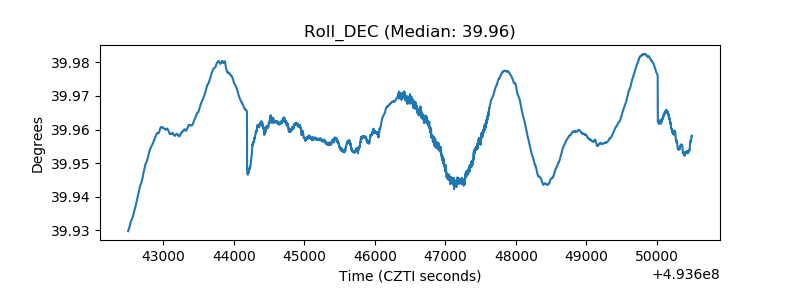 |
| _Roll_RA | 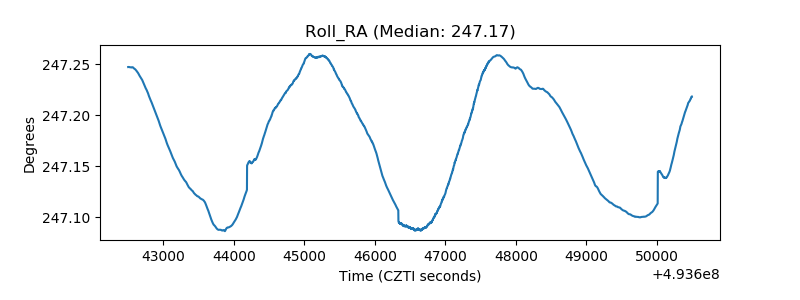 |
| Veto Counter | 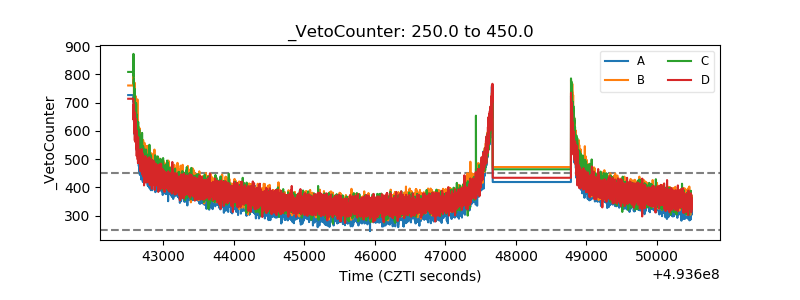 |