| Param | Original file | Final file |
|---|---|---|
| Filename | modeM0/AS1A14_004T05_9000006502_53574cztM0_level2.fits | modeM0/AS1A14_004T05_9000006502_53574cztM0_level2_quad_clean.evt |
| Size (bytes) | 842,281,920 | 75,744,000 |
| Size | 803.3 MB | 72.2 MB |
| Events in quadrant A | 5,140,993 | 582,402 |
| Events in quadrant B | 3,718,044 | 639,328 |
| Events in quadrant C | 11,171,087 | 257,423 |
| Events in quadrant D | 10,668,997 | 380,444 |
| Mode M9 | |||
|---|---|---|---|
| Quadrant | BADHDUFLAG | Total packets | Discarded packets |
| A | 0 | 9 | 0 |
| B | 0 | 9 | 0 |
| C | 0 | 9 | 0 |
| D | 0 | 9 | 0 |
| Mode SS | |||
|---|---|---|---|
| Quadrant | BADHDUFLAG | Total packets | Discarded packets |
| A | 0 | 128 | 0 |
| B | 0 | 128 | 0 |
| C | 0 | 128 | 0 |
| D | 0 | 126 | 0 |
| Mode M0 | |||
|---|---|---|---|
| Quadrant | BADHDUFLAG | Total packets | Discarded packets |
| A | 0 | 19570 | 1 |
| B | 0 | 15239 | 1 |
| C | 0 | 37430 | 1 |
| D | 0 | 35988 | 7 |
| Quadrant | Total seconds | Saturated seconds | Saturation percentage |
|---|---|---|---|
| A | 6204 | 567 | 9.139265% |
| B | 6204 | 248 | 3.997421% |
| C | 6204 | 3683 | 59.364926% |
| D | 6204 | 2275 | 36.669890% |
Noise dominated data is calculated using 1-second bins in cleaned event files. If a bin has >2000 counts, and if more than 50% of those come from <1% of pixels, then it is considered to be noise-dominated and hence unusable.
| Quadrant | # 1 sec bins | Bins with >0 counts | Bins with >2000 counts | High rate bins dominated by noise | Noise dominated (total time) | Noise dominated (detector-on time) | Marked lightcurve |
|---|---|---|---|---|---|---|---|
| A | 7114 | 6205 | 334 | 334 | 4.69% | 5.38% | 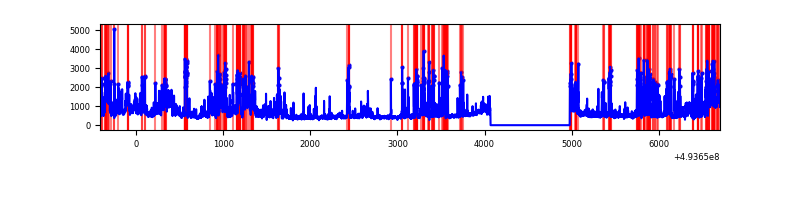 |
| B | 7114 | 6205 | 107 | 107 | 1.50% | 1.72% | 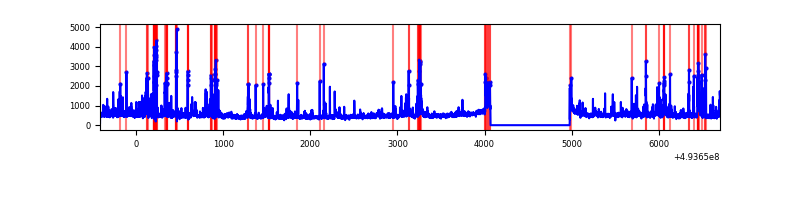 |
| C | 7114 | 6204 | 2836 | 2836 | 39.87% | 45.71% | 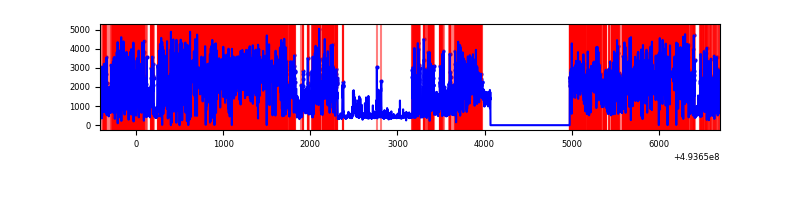 |
| D | 7114 | 6205 | 1890 | 1890 | 26.57% | 30.46% | 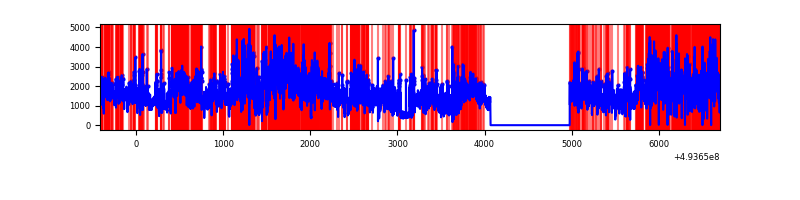 |
Top three noisy pixels from each quadrant. If the there are fewer than three noisy pixels in the level2.evt file, extra rows are filled as -1
| Pixel properties | Quadrant properties | ||||||
|---|---|---|---|---|---|---|---|
| Quadrant | DetID | PixID | Counts | Sigma | Mean | Median | Sigma |
| A | 3 | 63 | 1172152 | 7080.18 | 669 | 653 | 165.5 |
| A | 3 | 62 | 647782 | 3911.05 | 669 | 653 | 165.5 |
| A | 15 | 174 | 305698 | 1843.6 | 669 | 653 | 165.5 |
| B | 2 | 249 | 418031 | 2950.52 | 665 | 644 | 141.5 |
| B | 10 | 28 | 116317 | 817.7 | 665 | 644 | 141.5 |
| B | 5 | 250 | 100503 | 705.91 | 665 | 644 | 141.5 |
| C | 15 | 224 | 4527956 | 37393.92 | 432 | 428 | 121.1 |
| C | 1 | 241 | 2502483 | 20665.06 | 432 | 428 | 121.1 |
| C | 4 | 5 | 1102766 | 9104.47 | 432 | 428 | 121.1 |
| D | 2 | 172 | 5337113 | 33746.94 | 546 | 521 | 158.1 |
| D | 8 | 176 | 2708542 | 17124.68 | 546 | 521 | 158.1 |
| D | 7 | 70 | 150459 | 948.16 | 546 | 521 | 158.1 |
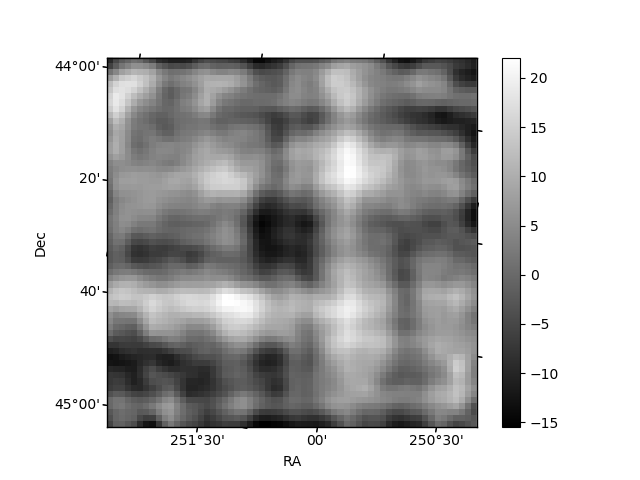
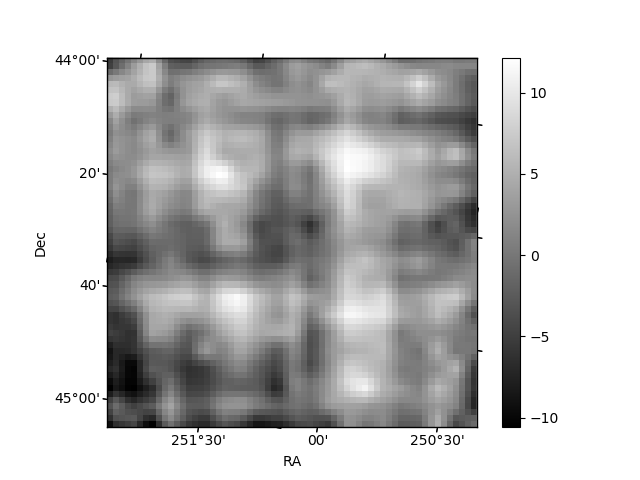
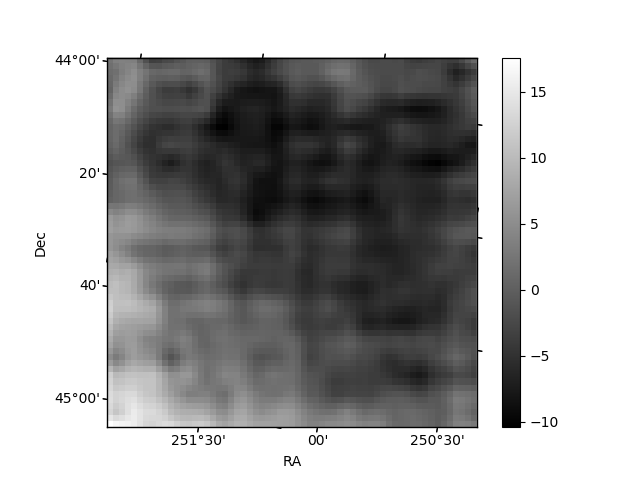
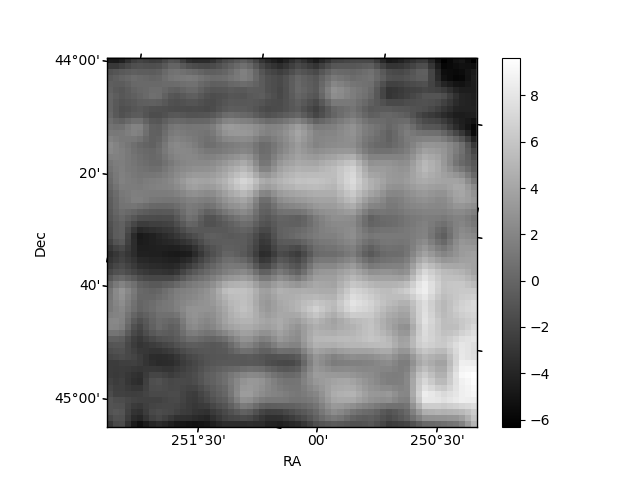
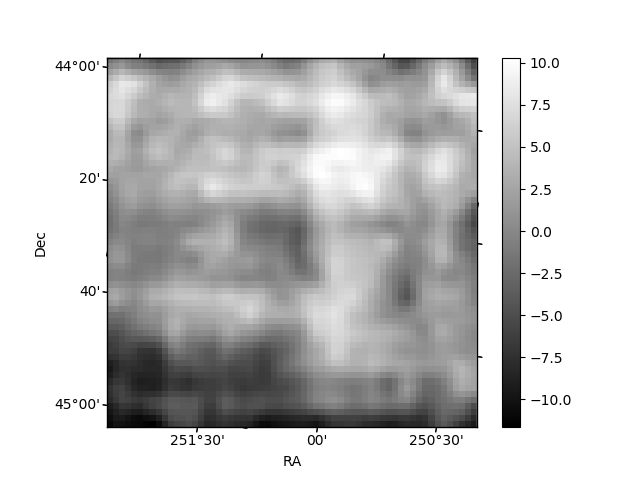
Histogram calculated using DETX and DETY for each event in the final _common_clean file
| Quadrant A | 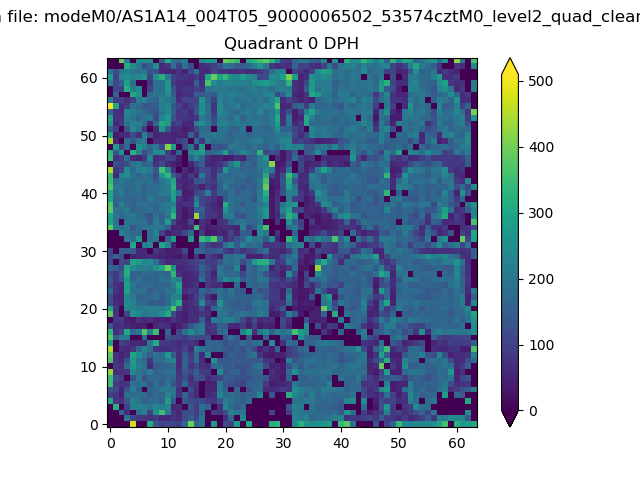 |
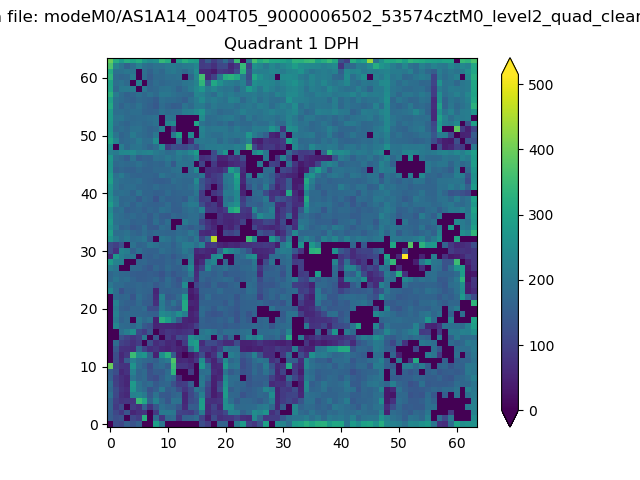 |
Quadrant B |
|---|---|---|---|
| Quadrant D | 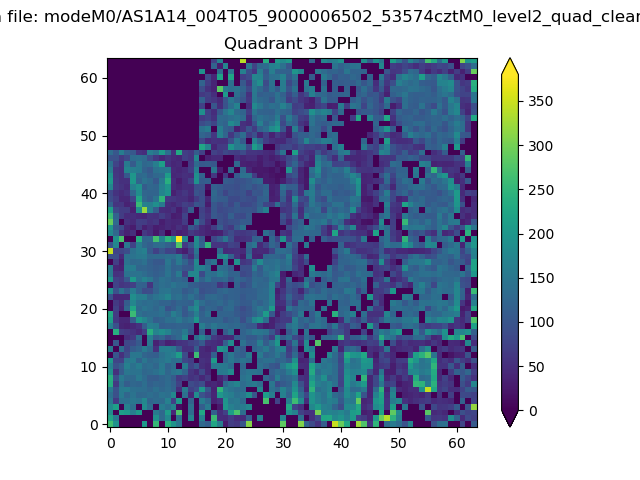 |
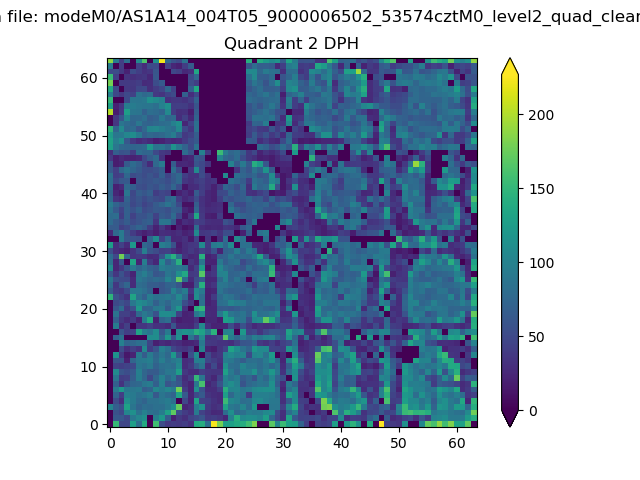 |
Quadrant C |
| Plot type | Count rate plots | Images |
|---|---|---|
| Comparison with Poisson distribution Blue bars denote a histogram of data divided into 1 sec bins. Red curve is a Poisson curve with rate = median count rate of data. |
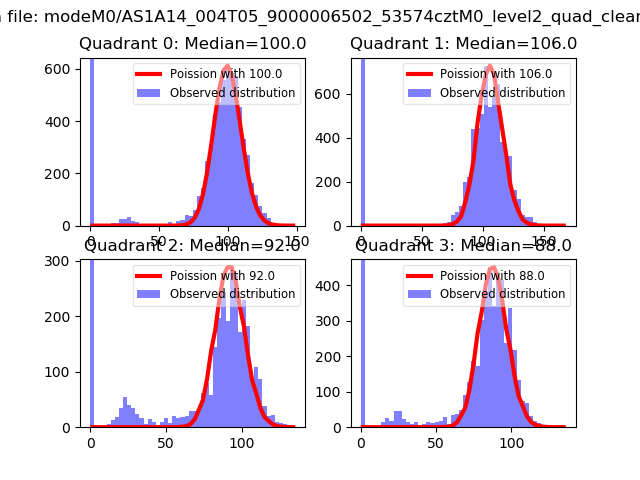 |
 |
| Quadrant-wise count rates Data is divided into 100 sec bins |
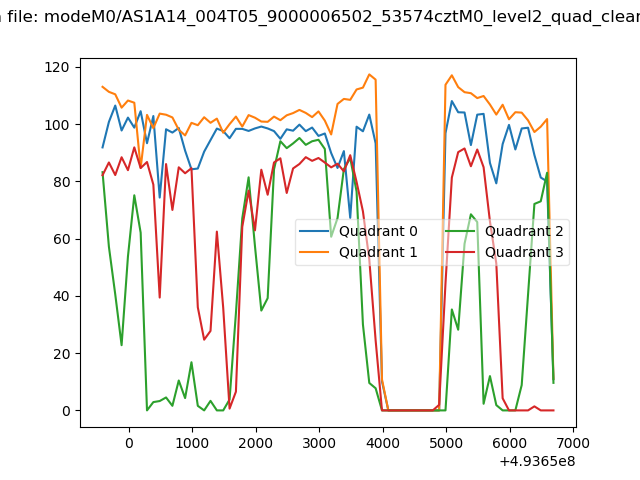 |
|
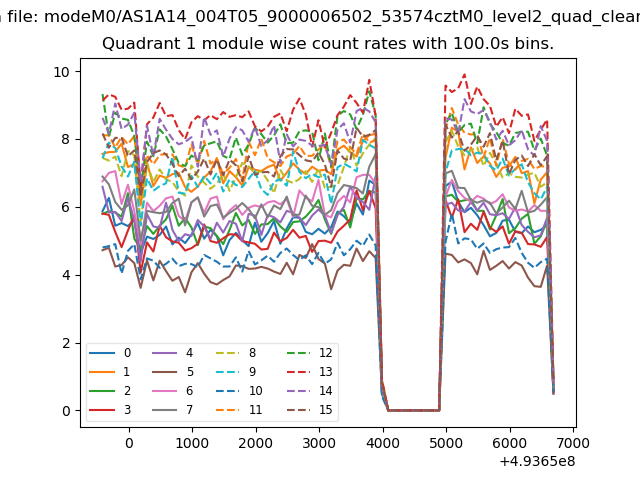
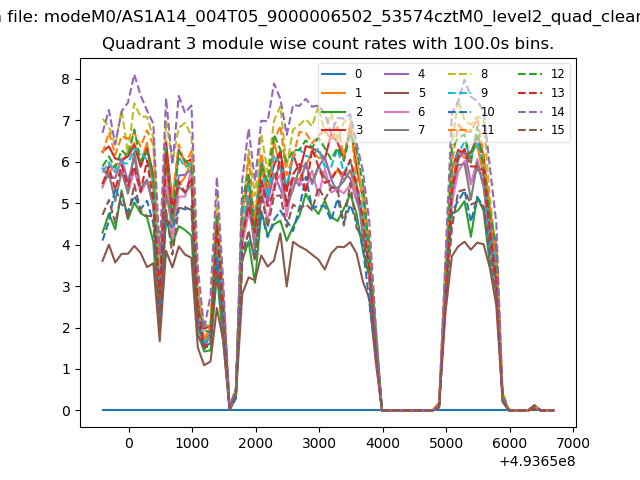
| Module-wise count rates for Quadrant A Data is divided into 100 sec bins |
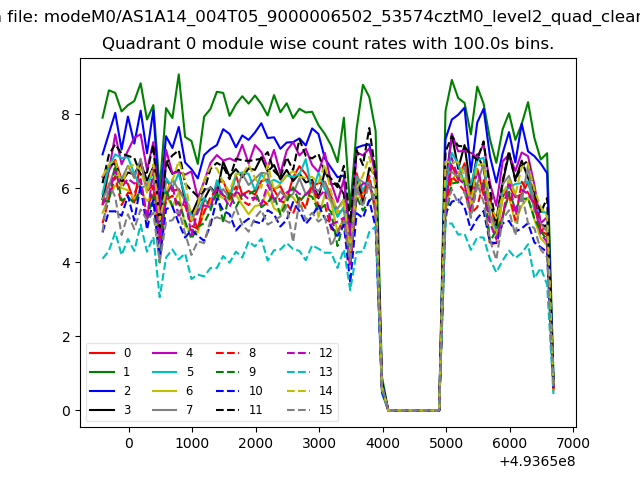 |
 |
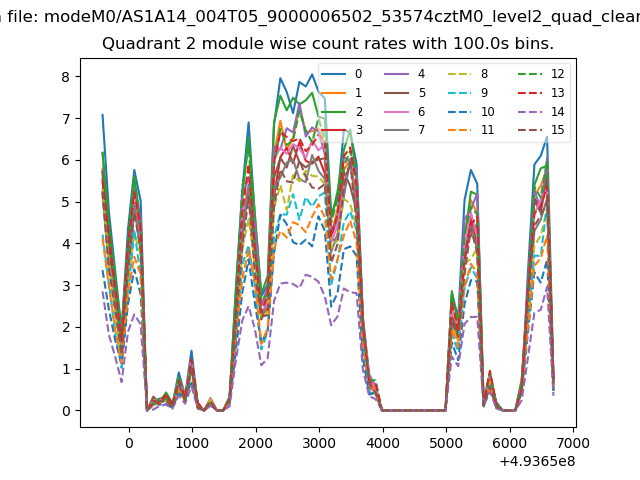
| Module-wise count rates for Quadrant B Data is divided into 100 sec bins |
 |
 |
| Module-wise count rates for Quadrant C Data is divided into 100 sec bins |
 |
 |
| Module-wise count rates for Quadrant D Data is divided into 100 sec bins |
 |
 |
| Parameter | Plot |
|---|---|
| CZT HV Monitor | 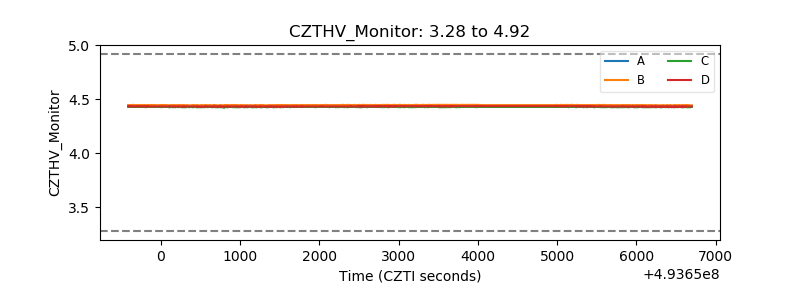 |
| D_VDD | 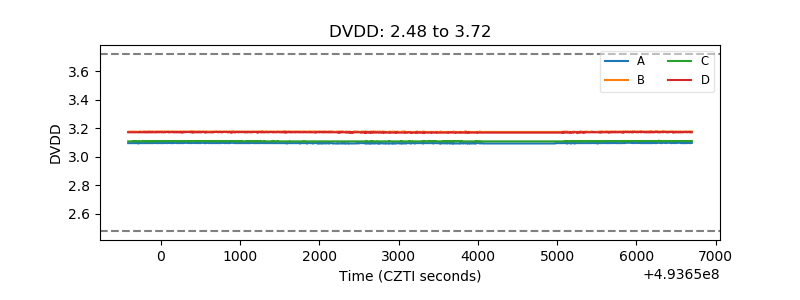 |
| Temperature 1 | 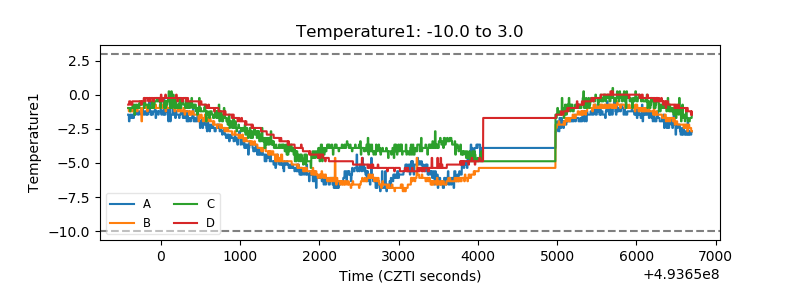 |
| Veto HV Monitor | 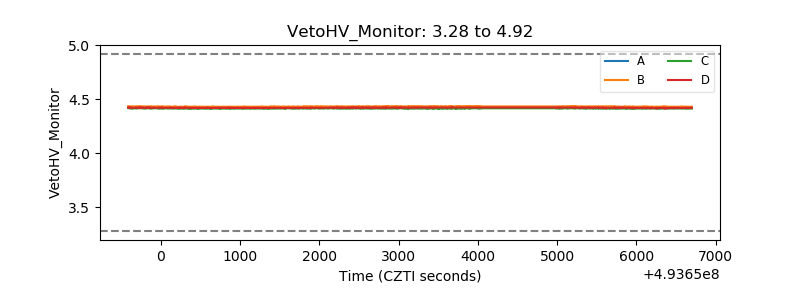 |
| Veto LLD | 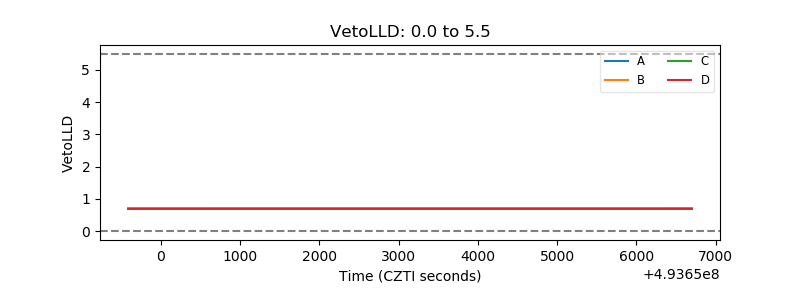 |
| Alpha Counter | 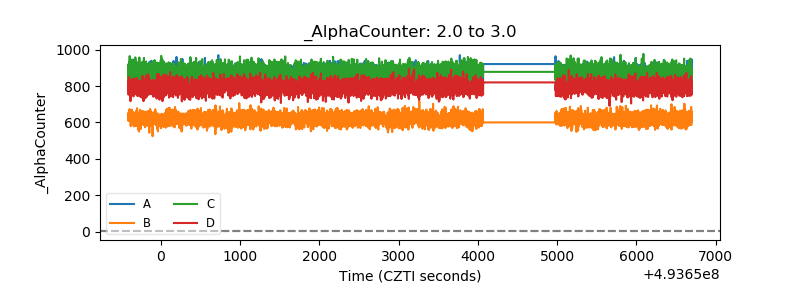 |
| _CPM_Rate | 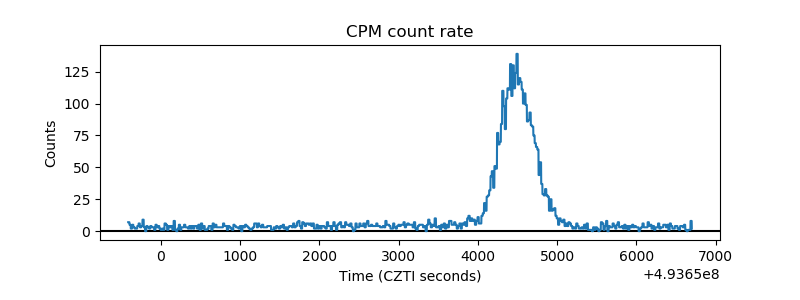 |
| CZT Counter | 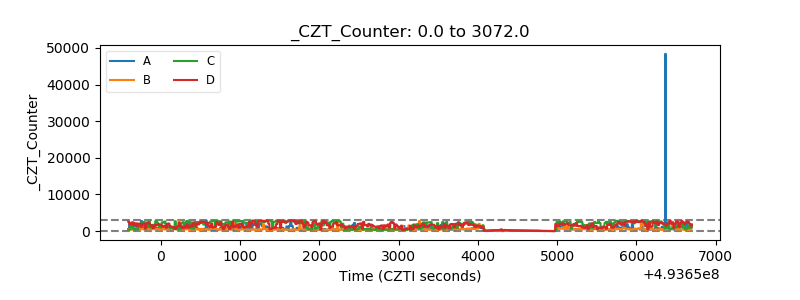 |
| +2.5 Volts monitor | 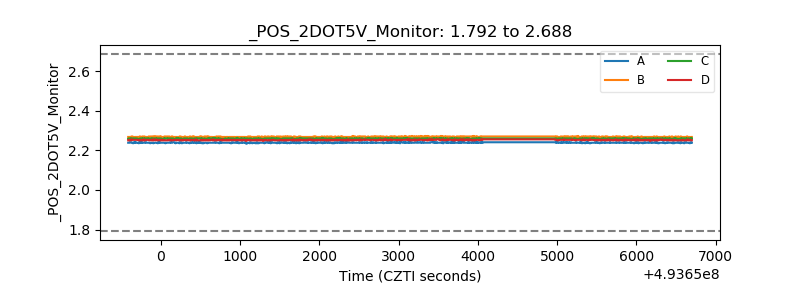 |
| +5 Volts monitor | 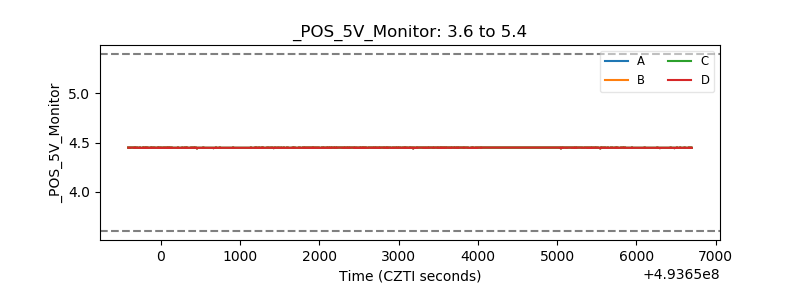 |
| _ROLL_ROT | 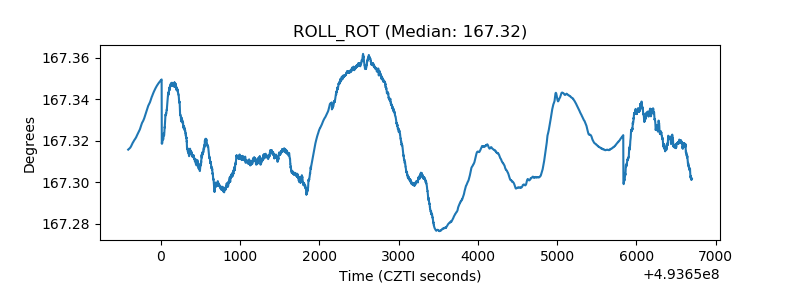 |
| _Roll_DEC | 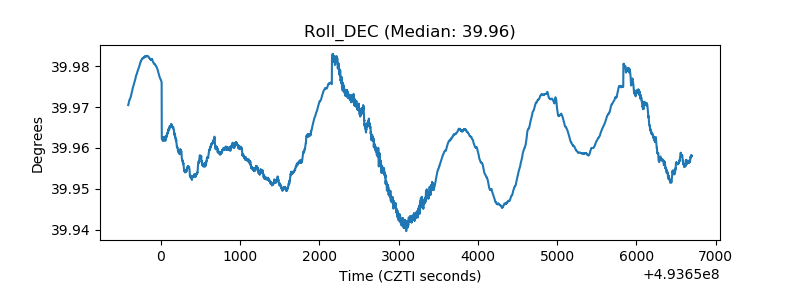 |
| _Roll_RA | 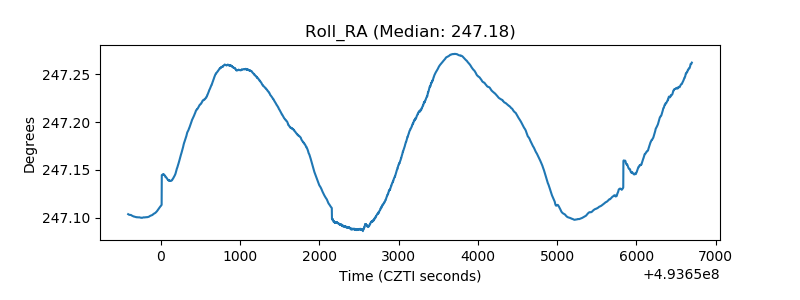 |
| Veto Counter | 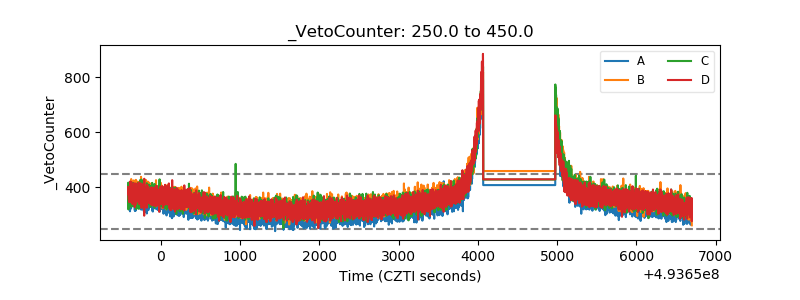 |