| Param | Original file | Final file |
|---|---|---|
| Filename | modeM0/AS1A14_004T05_9000006502_53575cztM0_level2.fits | modeM0/AS1A14_004T05_9000006502_53575cztM0_level2_quad_clean.evt |
| Size (bytes) | 1,058,993,280 | 65,514,240 |
| Size | 1009.9 MB | 62.5 MB |
| Events in quadrant A | 7,679,817 | 476,591 |
| Events in quadrant B | 4,101,819 | 679,391 |
| Events in quadrant C | 13,211,576 | 238,999 |
| Events in quadrant D | 13,692,904 | 124,725 |
| Mode M9 | |||
|---|---|---|---|
| Quadrant | BADHDUFLAG | Total packets | Discarded packets |
| A | 0 | 6 | 0 |
| B | 0 | 6 | 0 |
| C | 0 | 6 | 0 |
| D | 0 | 6 | 0 |
| Mode SS | |||
|---|---|---|---|
| Quadrant | BADHDUFLAG | Total packets | Discarded packets |
| A | 0 | 134 | 0 |
| B | 0 | 134 | 0 |
| C | 0 | 134 | 0 |
| D | 0 | 134 | 0 |
| Mode M0 | |||
|---|---|---|---|
| Quadrant | BADHDUFLAG | Total packets | Discarded packets |
| A | 0 | 27468 | 1 |
| B | 0 | 16772 | 1 |
| C | 0 | 43790 | 1 |
| D | 0 | 45294 | 1 |
| Quadrant | Total seconds | Saturated seconds | Saturation percentage |
|---|---|---|---|
| A | 6651 | 1890 | 28.416779% |
| B | 6652 | 178 | 2.675887% |
| C | 6652 | 4258 | 64.010824% |
| D | 6652 | 5474 | 82.291040% |
Noise dominated data is calculated using 1-second bins in cleaned event files. If a bin has >2000 counts, and if more than 50% of those come from <1% of pixels, then it is considered to be noise-dominated and hence unusable.
| Quadrant | # 1 sec bins | Bins with >0 counts | Bins with >2000 counts | High rate bins dominated by noise | Noise dominated (total time) | Noise dominated (detector-on time) | Marked lightcurve |
|---|---|---|---|---|---|---|---|
| A | 7236 | 6652 | 1395 | 1395 | 19.28% | 20.97% | 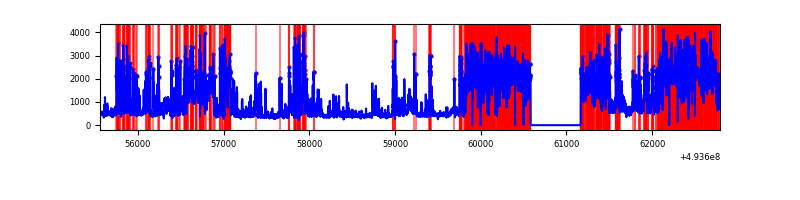 |
| B | 7237 | 6653 | 107 | 107 | 1.48% | 1.61% | 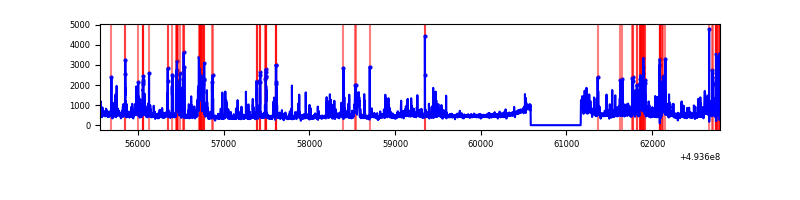 |
| C | 7237 | 6653 | 3686 | 3686 | 50.93% | 55.40% | 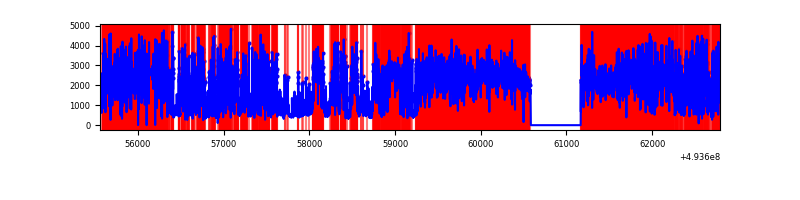 |
| D | 7236 | 6652 | 3619 | 3619 | 50.01% | 54.40% | 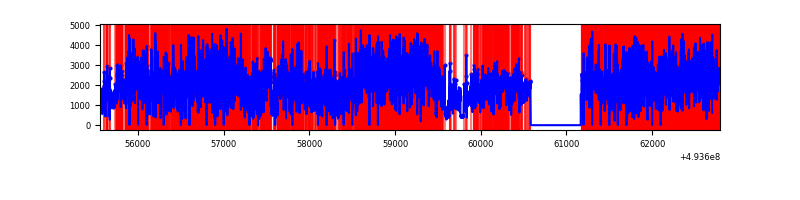 |
Top three noisy pixels from each quadrant. If the there are fewer than three noisy pixels in the level2.evt file, extra rows are filled as -1
| Pixel properties | Quadrant properties | ||||||
|---|---|---|---|---|---|---|---|
| Quadrant | DetID | PixID | Counts | Sigma | Mean | Median | Sigma |
| A | 3 | 63 | 3633065 | 24498.28 | 599 | 585 | 148.3 |
| A | 3 | 45 | 678121 | 4569.46 | 599 | 585 | 148.3 |
| A | 15 | 174 | 397908 | 2679.64 | 599 | 585 | 148.3 |
| B | 2 | 249 | 468277 | 3061.22 | 712 | 688 | 152.7 |
| B | 10 | 28 | 243736 | 1591.19 | 712 | 688 | 152.7 |
| B | 10 | 247 | 81643 | 530.0 | 712 | 688 | 152.7 |
| C | 1 | 241 | 5459774 | 42145.28 | 464 | 460 | 129.5 |
| C | 15 | 224 | 3892570 | 30046.65 | 464 | 460 | 129.5 |
| C | 4 | 5 | 1081195 | 8343.15 | 464 | 460 | 129.5 |
| D | 8 | 176 | 8073453 | 88916.88 | 315 | 300 | 90.8 |
| D | 2 | 172 | 3829407 | 42173.39 | 315 | 300 | 90.8 |
| D | 7 | 70 | 194076 | 2134.23 | 315 | 300 | 90.8 |
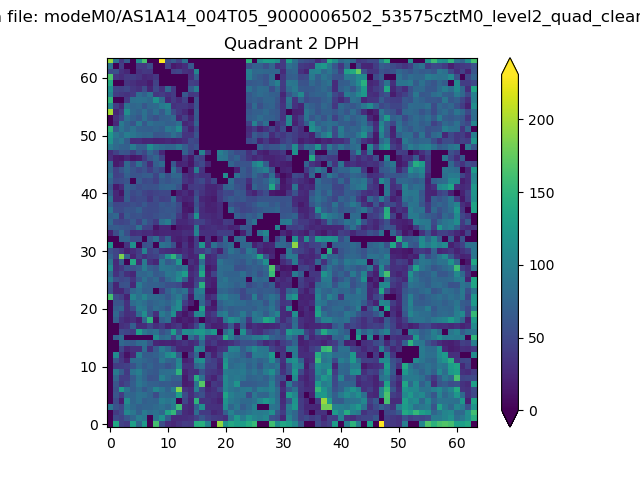
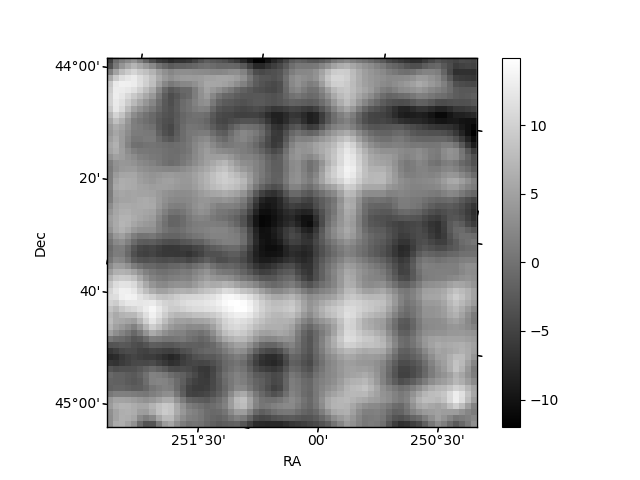
Histogram calculated using DETX and DETY for each event in the final _common_clean file
| Quadrant A | 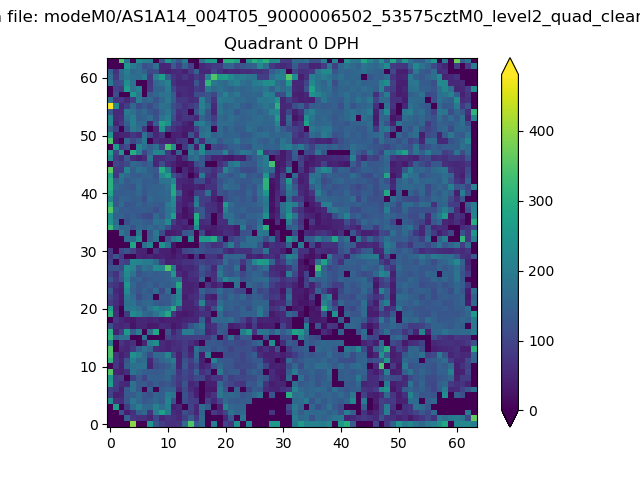 |
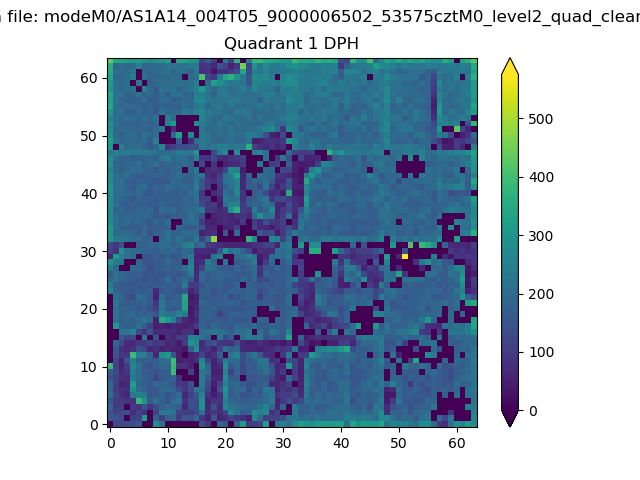 |
Quadrant B |
|---|---|---|---|
| Quadrant D | 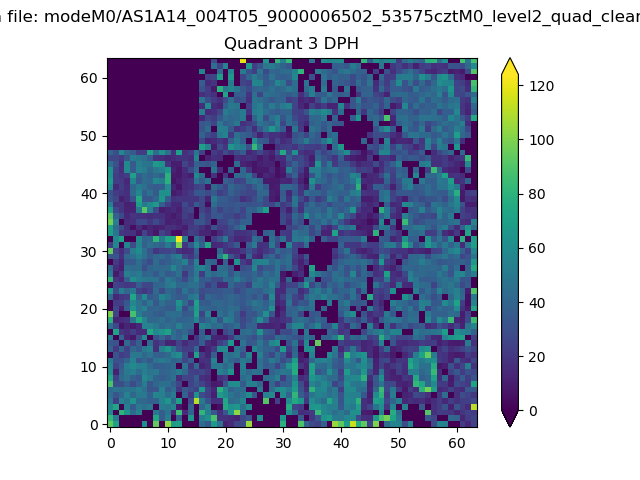 |
 |
Quadrant C |
| Plot type | Count rate plots | Images |
|---|---|---|
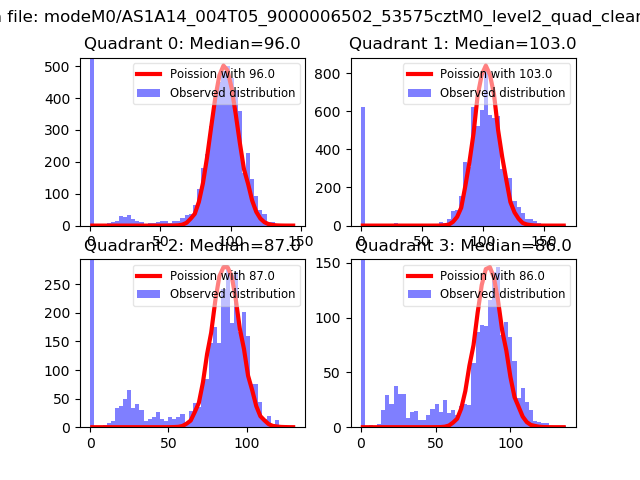
| Comparison with Poisson distribution Blue bars denote a histogram of data divided into 1 sec bins. Red curve is a Poisson curve with rate = median count rate of data. |
 |
 |
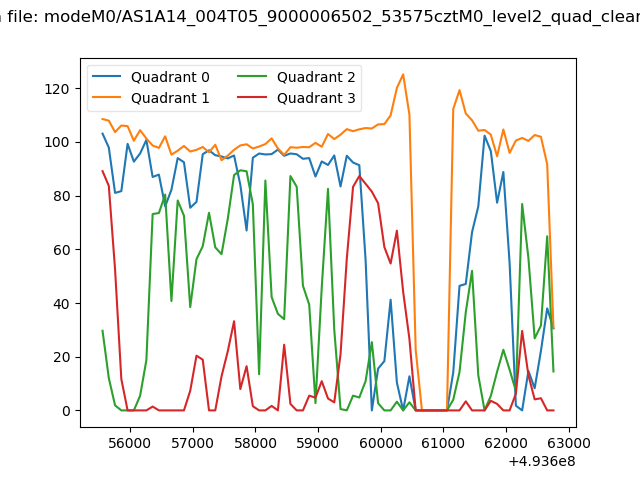
| Quadrant-wise count rates Data is divided into 100 sec bins |
 |
|
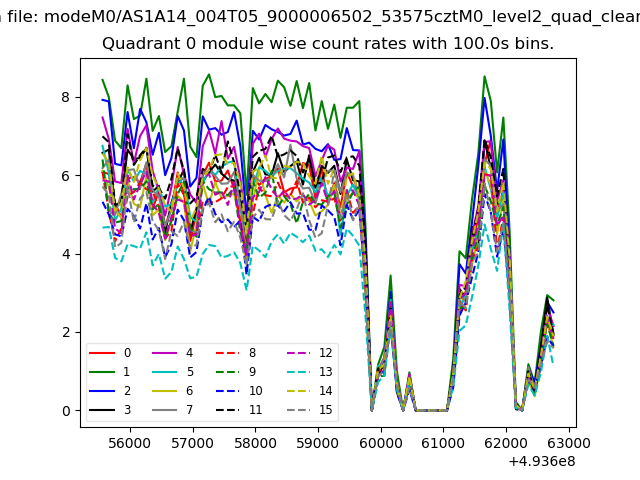
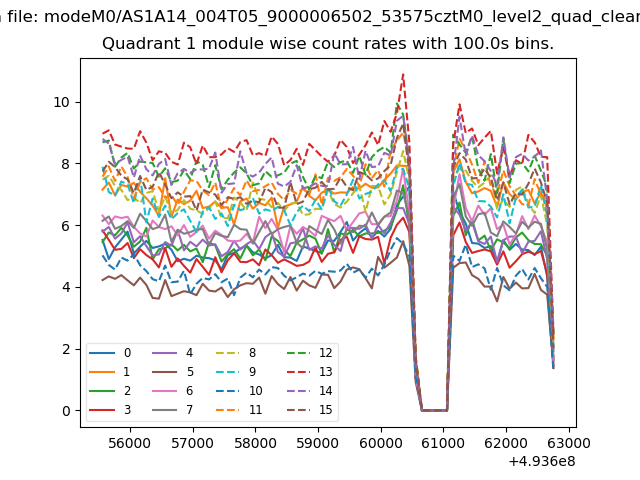
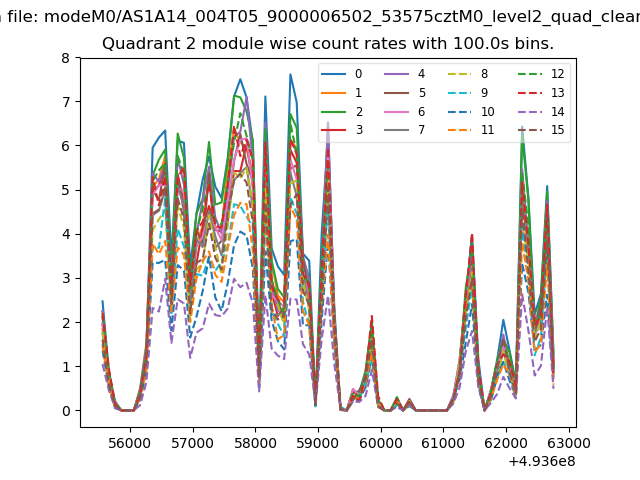
| Module-wise count rates for Quadrant A Data is divided into 100 sec bins |
 |
 |
| Module-wise count rates for Quadrant B Data is divided into 100 sec bins |
 |
 |
| Module-wise count rates for Quadrant C Data is divided into 100 sec bins |
 |
 |
| Module-wise count rates for Quadrant D Data is divided into 100 sec bins |
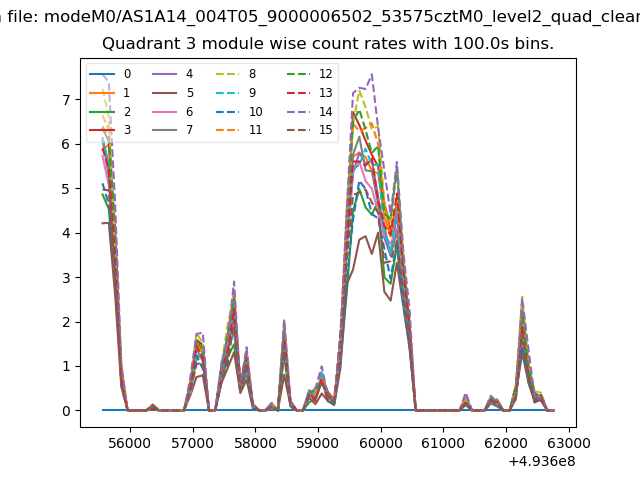 |
 |
| Parameter | Plot |
|---|---|
| CZT HV Monitor | 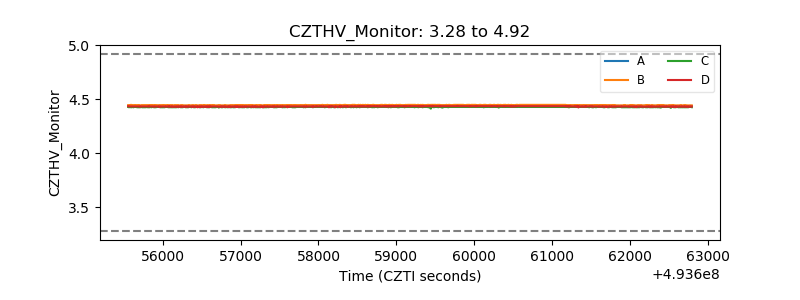 |
| D_VDD | 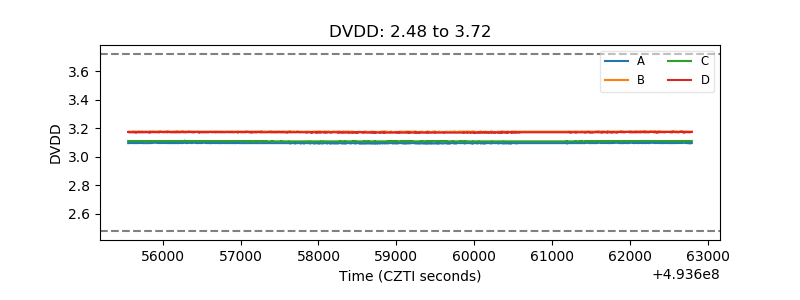 |
| Temperature 1 | 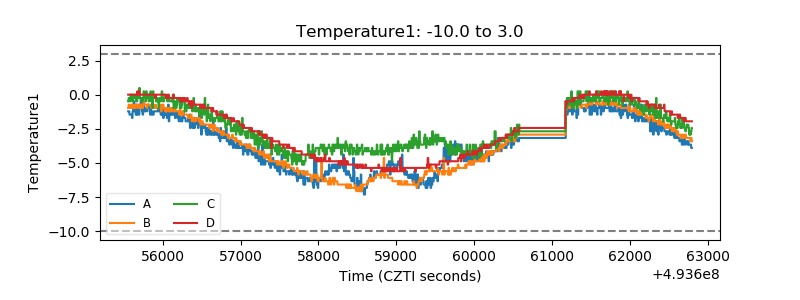 |
| Veto HV Monitor | 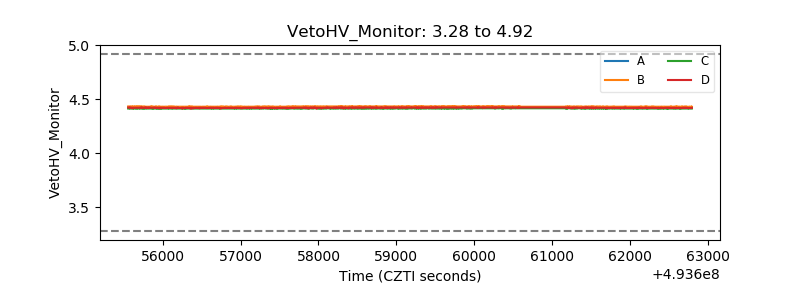 |
| Veto LLD | 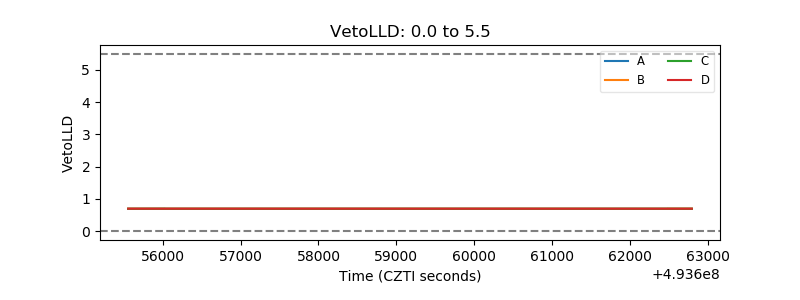 |
| Alpha Counter | 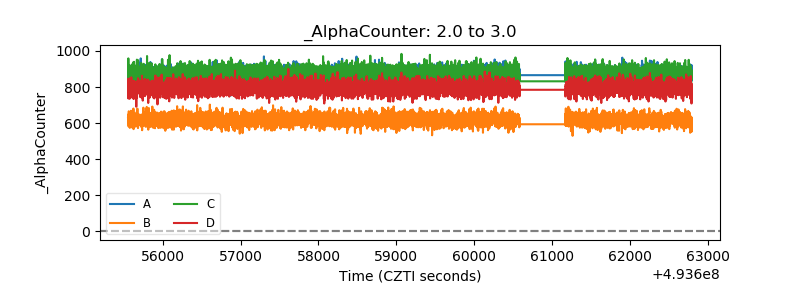 |
| _CPM_Rate | 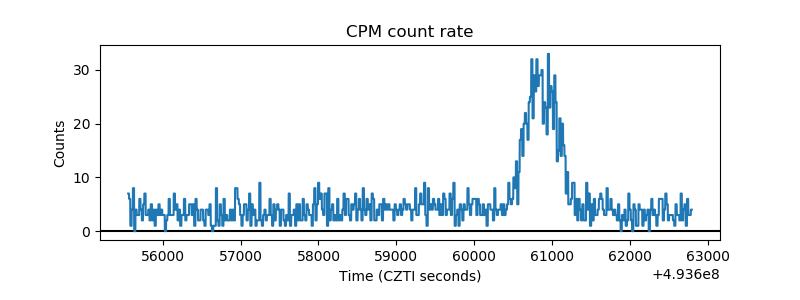 |
| CZT Counter | 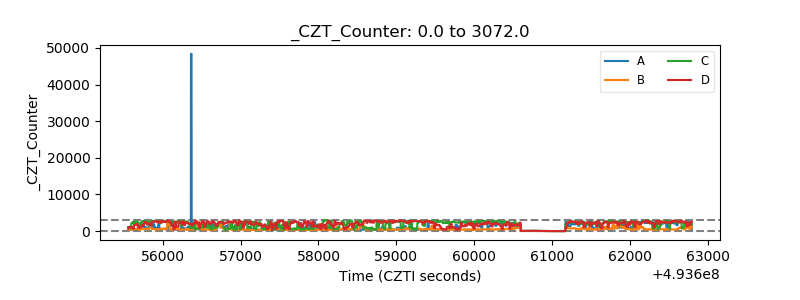 |
| +2.5 Volts monitor |  |
| +5 Volts monitor |  |
| _ROLL_ROT | 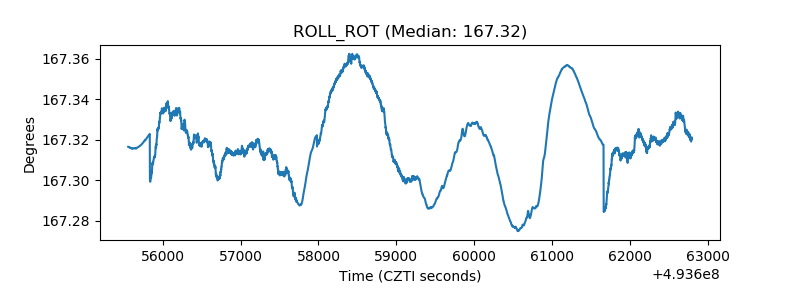 |
| _Roll_DEC | 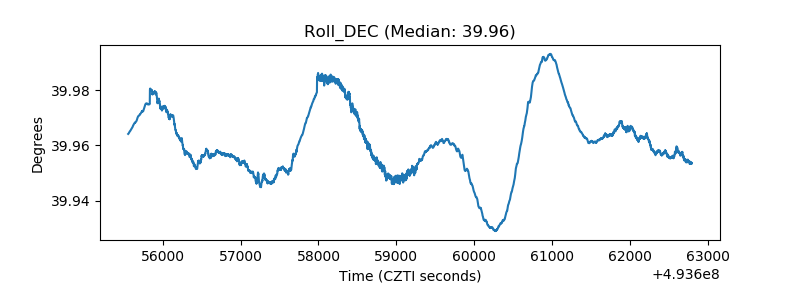 |
| _Roll_RA | 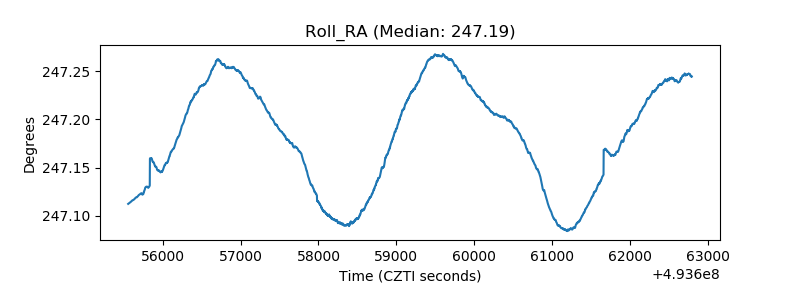 |
| Veto Counter | 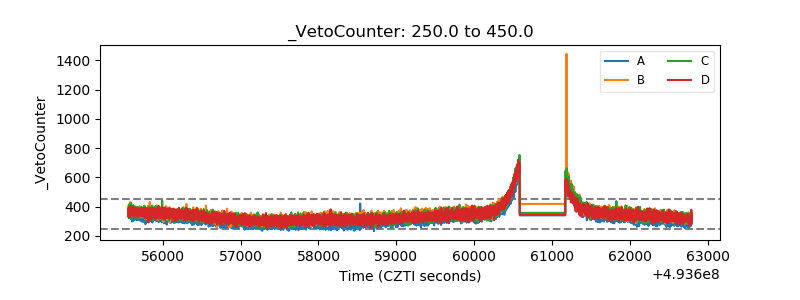 |