| Param | Original file | Final file |
|---|---|---|
| Filename | modeM0/AS1A14_004T05_9000006502_53576cztM0_level2.fits | modeM0/AS1A14_004T05_9000006502_53576cztM0_level2_quad_clean.evt |
| Size (bytes) | 1,218,415,680 | 71,196,480 |
| Size | 1.1 GB | 67.9 MB |
| Events in quadrant A | 10,529,641 | 423,524 |
| Events in quadrant B | 5,979,129 | 692,006 |
| Events in quadrant C | 12,005,171 | 397,518 |
| Events in quadrant D | 16,031,919 | 139,871 |
| Mode SS | |||
|---|---|---|---|
| Quadrant | BADHDUFLAG | Total packets | Discarded packets |
| A | 0 | 144 | 0 |
| B | 0 | 144 | 0 |
| C | 0 | 144 | 0 |
| D | 0 | 144 | 0 |
| Mode M0 | |||
|---|---|---|---|
| Quadrant | BADHDUFLAG | Total packets | Discarded packets |
| A | 0 | 36341 | 0 |
| B | 0 | 22742 | 0 |
| C | 0 | 40694 | 0 |
| D | 0 | 52526 | 0 |
| Quadrant | Total seconds | Saturated seconds | Saturation percentage |
|---|---|---|---|
| A | 7213 | 2982 | 41.342021% |
| B | 7212 | 700 | 9.706045% |
| C | 7212 | 3286 | 45.562951% |
| D | 7212 | 5919 | 82.071547% |
Noise dominated data is calculated using 1-second bins in cleaned event files. If a bin has >2000 counts, and if more than 50% of those come from <1% of pixels, then it is considered to be noise-dominated and hence unusable.
| Quadrant | # 1 sec bins | Bins with >0 counts | Bins with >2000 counts | High rate bins dominated by noise | Noise dominated (total time) | Noise dominated (detector-on time) | Marked lightcurve |
|---|---|---|---|---|---|---|---|
| A | 7213 | 7213 | 2196 | 2196 | 30.45% | 30.45% | 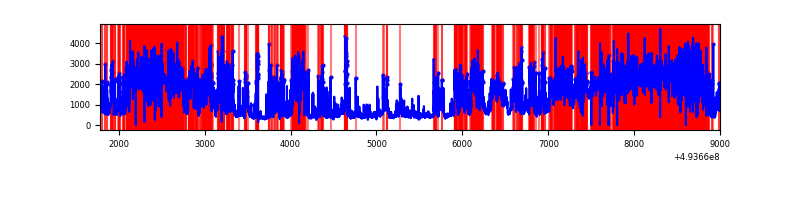 |
| B | 7212 | 7212 | 355 | 355 | 4.92% | 4.92% | 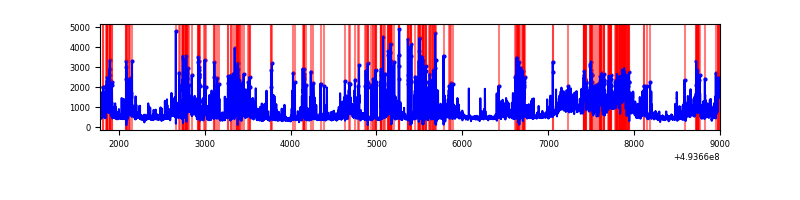 |
| C | 7212 | 7212 | 2693 | 2693 | 37.34% | 37.34% | 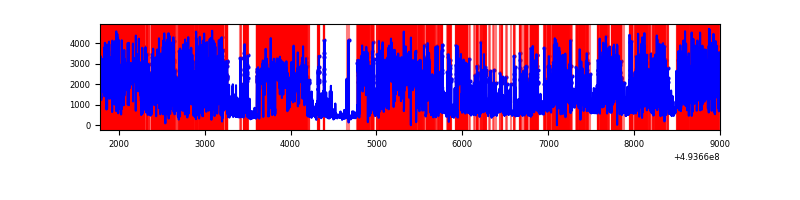 |
| D | 7211 | 7208 | 4661 | 4661 | 64.64% | 64.66% | 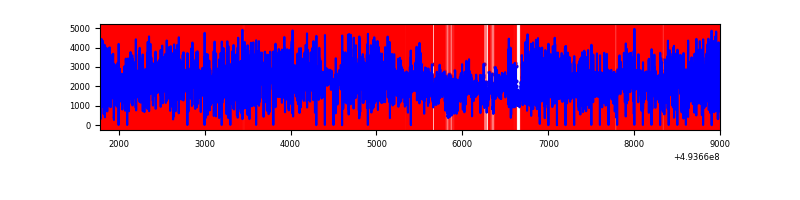 |
Top three noisy pixels from each quadrant. If the there are fewer than three noisy pixels in the level2.evt file, extra rows are filled as -1
| Pixel properties | Quadrant properties | ||||||
|---|---|---|---|---|---|---|---|
| Quadrant | DetID | PixID | Counts | Sigma | Mean | Median | Sigma |
| A | 3 | 63 | 4833697 | 32004.86 | 606 | 590 | 151.0 |
| A | 3 | 62 | 1369031 | 9061.82 | 606 | 590 | 151.0 |
| A | 3 | 45 | 901763 | 5967.57 | 606 | 590 | 151.0 |
| B | 4 | 206 | 1120742 | 6922.3 | 755 | 727 | 161.8 |
| B | 2 | 249 | 470072 | 2900.81 | 755 | 727 | 161.8 |
| B | 10 | 28 | 467732 | 2886.35 | 755 | 727 | 161.8 |
| C | 15 | 224 | 5364494 | 31772.81 | 607 | 602 | 168.8 |
| C | 1 | 241 | 3005811 | 17801.24 | 607 | 602 | 168.8 |
| C | 9 | 38 | 246134 | 1454.4 | 607 | 602 | 168.8 |
| D | 8 | 176 | 9937898 | 96221.87 | 356 | 339 | 103.3 |
| D | 2 | 172 | 3815612 | 36941.94 | 356 | 339 | 103.3 |
| D | 2 | 16 | 172923 | 1671.07 | 356 | 339 | 103.3 |
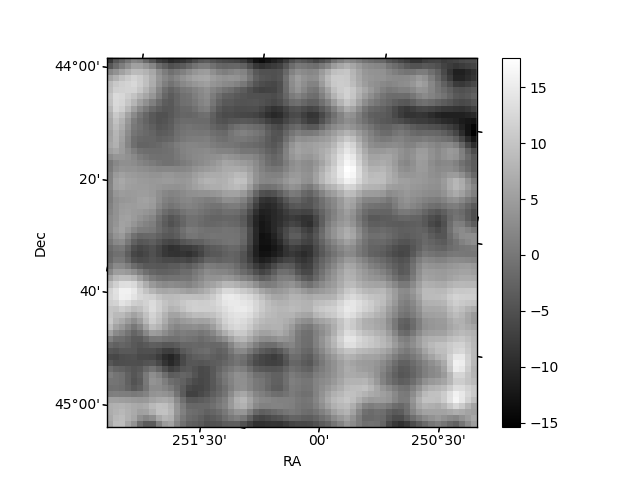
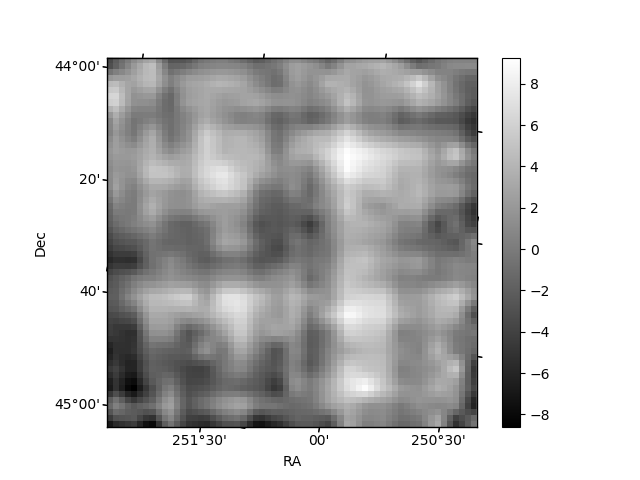
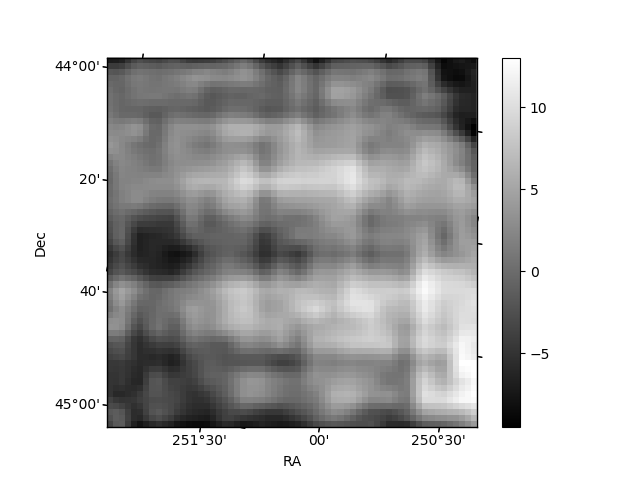
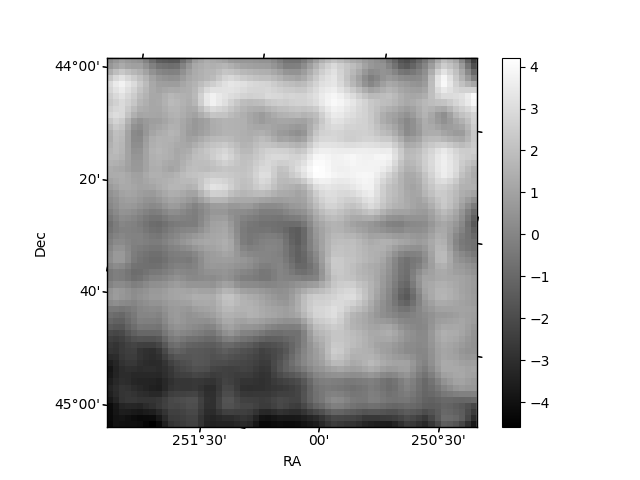
Histogram calculated using DETX and DETY for each event in the final _common_clean file
| Quadrant A | 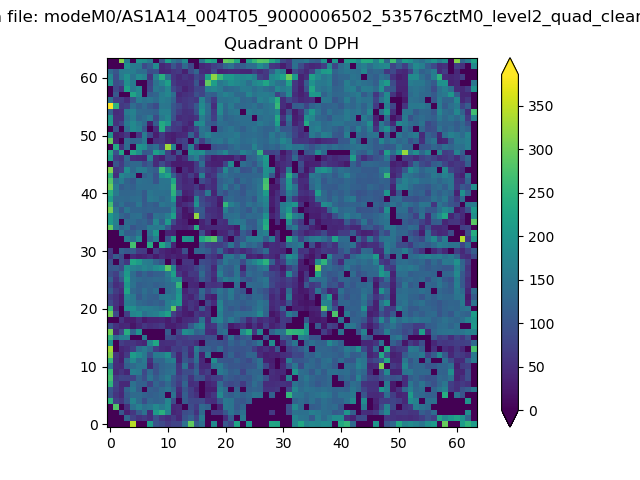 |
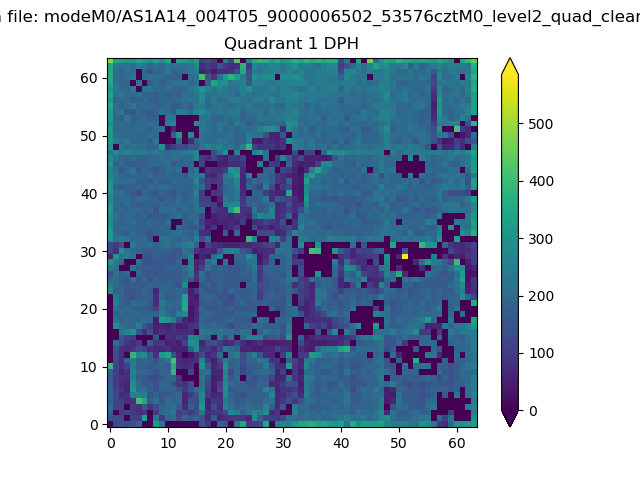 |
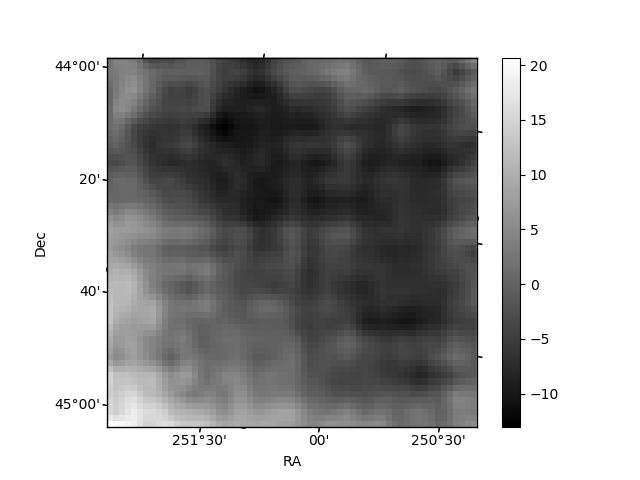
Quadrant B |
|---|---|---|---|
| Quadrant D | 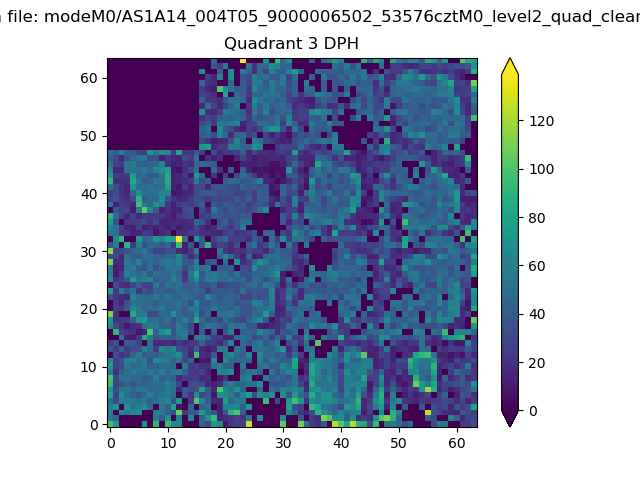 |
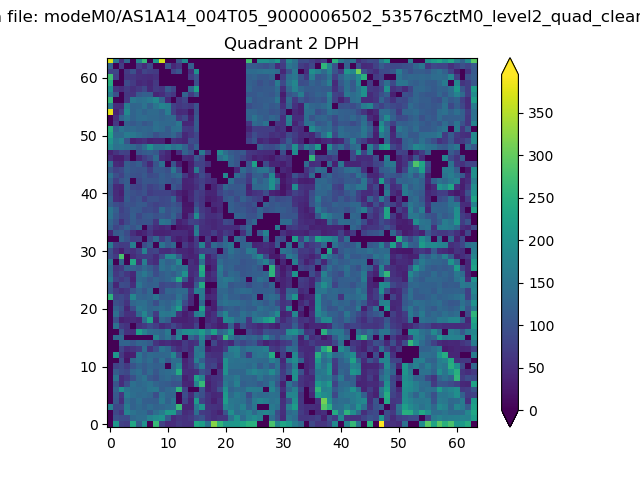 |
Quadrant C |
| Plot type | Count rate plots | Images |
|---|---|---|
| Comparison with Poisson distribution Blue bars denote a histogram of data divided into 1 sec bins. Red curve is a Poisson curve with rate = median count rate of data. |
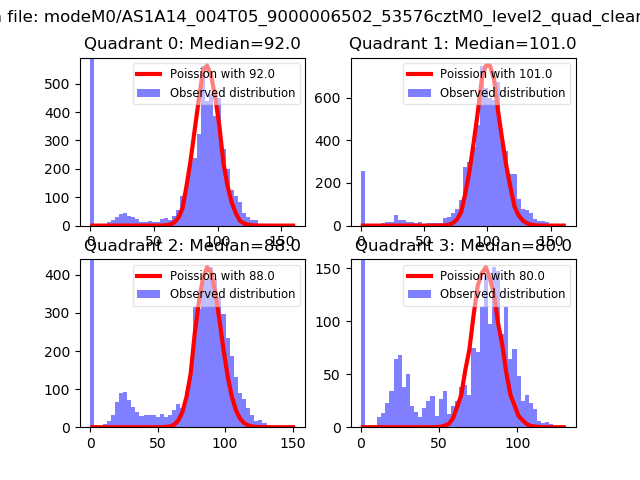 |
 |
| Quadrant-wise count rates Data is divided into 100 sec bins |
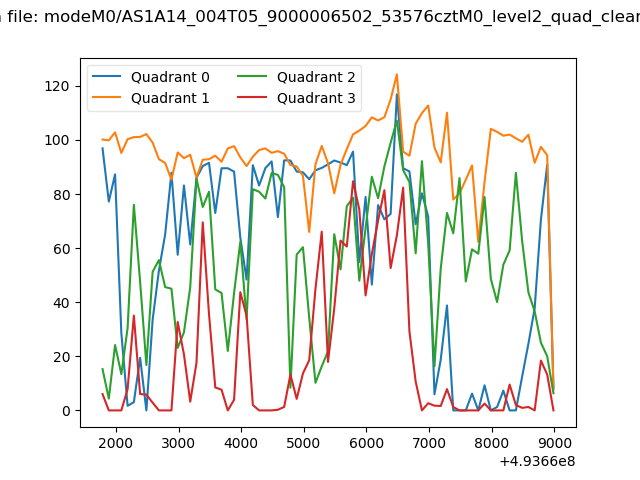 |
|
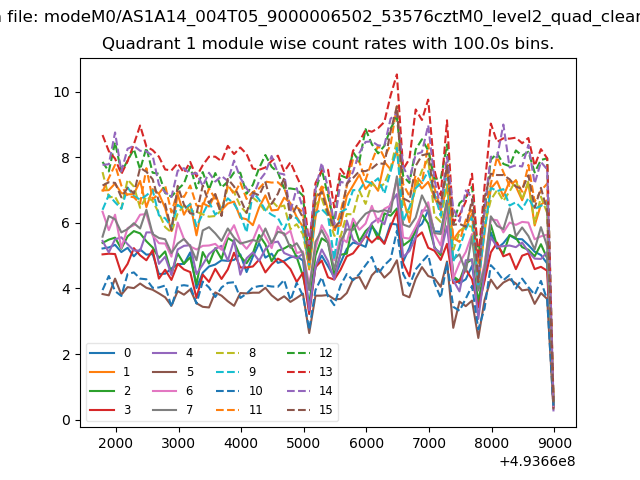
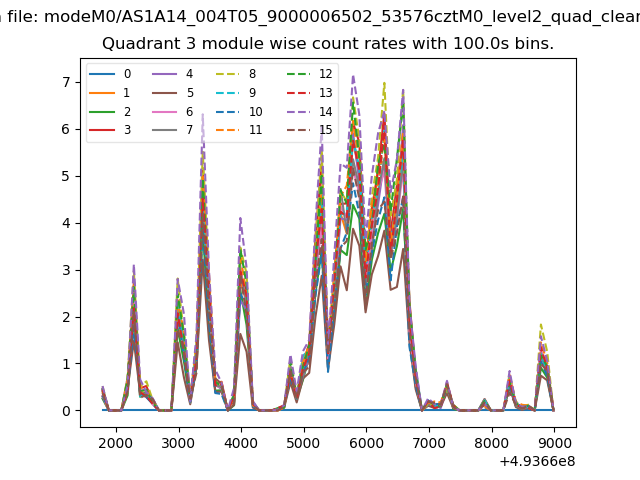
| Module-wise count rates for Quadrant A Data is divided into 100 sec bins |
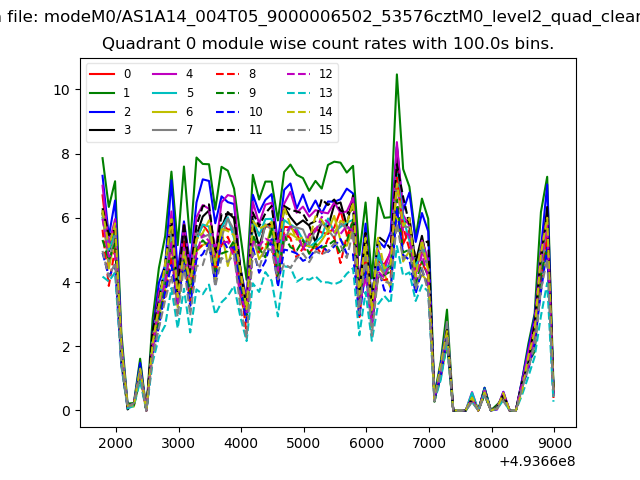 |
 |
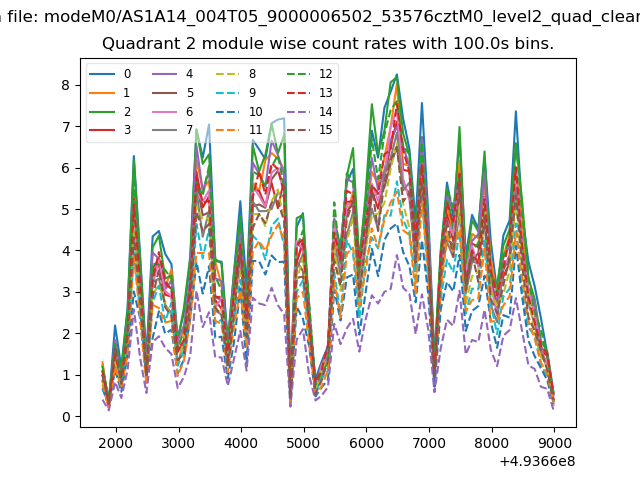
| Module-wise count rates for Quadrant B Data is divided into 100 sec bins |
 |
 |
| Module-wise count rates for Quadrant C Data is divided into 100 sec bins |
 |
 |
| Module-wise count rates for Quadrant D Data is divided into 100 sec bins |
 |
 |
| Parameter | Plot |
|---|---|
| CZT HV Monitor | 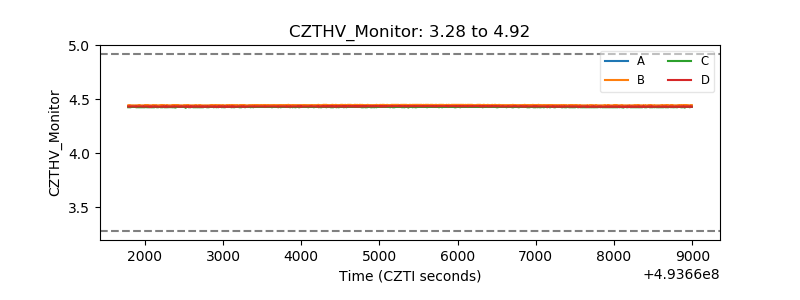 |
| D_VDD | 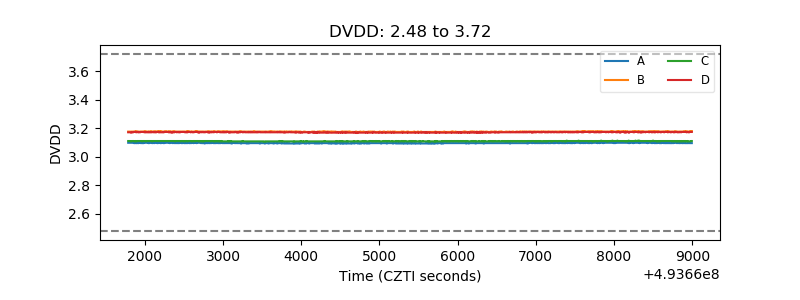 |
| Temperature 1 | 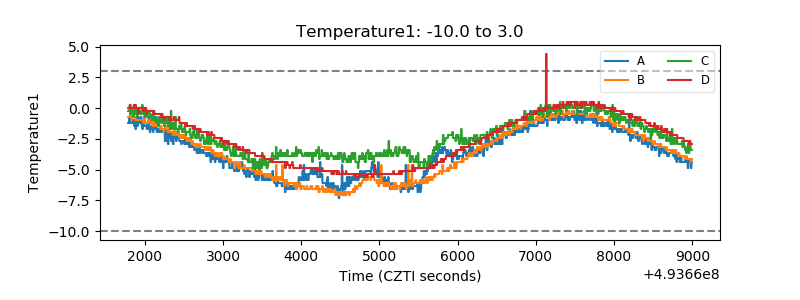 |
| Veto HV Monitor | 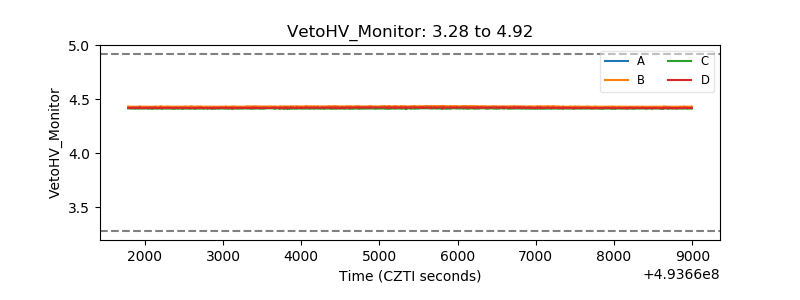 |
| Veto LLD | 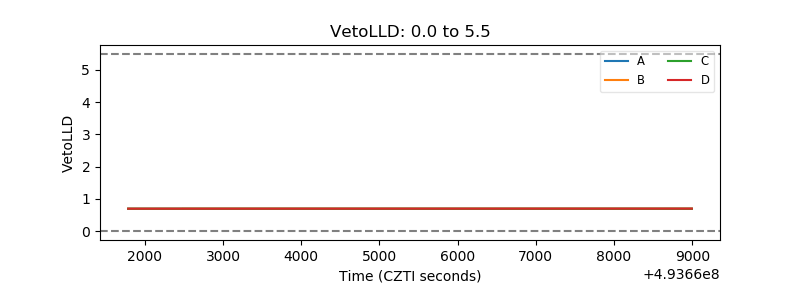 |
| Alpha Counter | 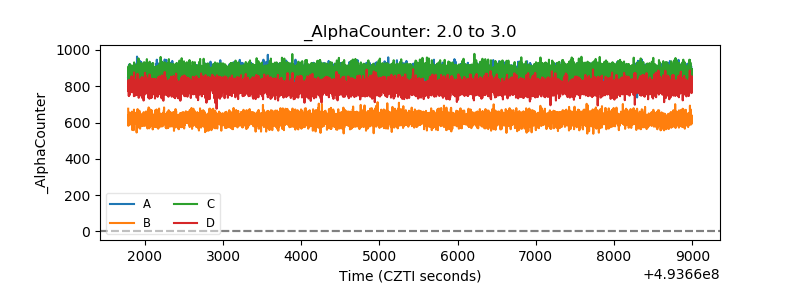 |
| _CPM_Rate | 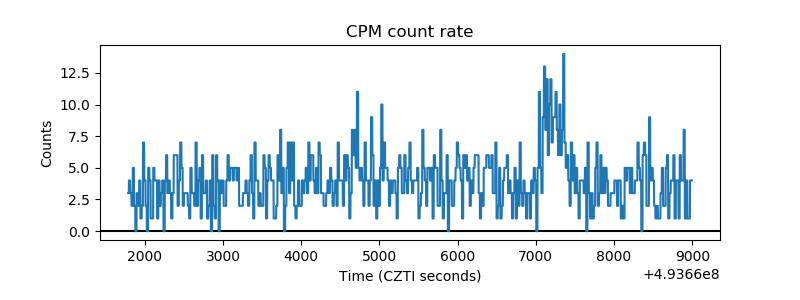 |
| CZT Counter | 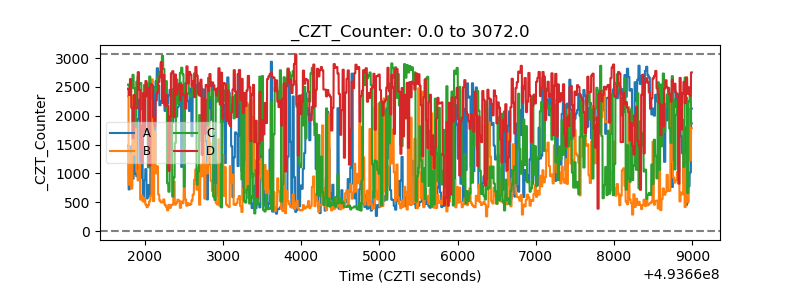 |
| +2.5 Volts monitor |  |
| +5 Volts monitor |  |
| _ROLL_ROT | 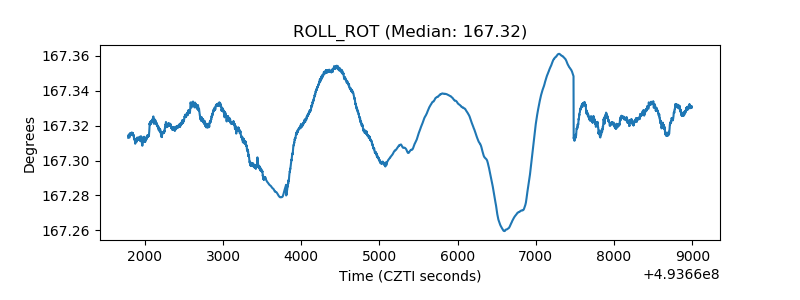 |
| _Roll_DEC | 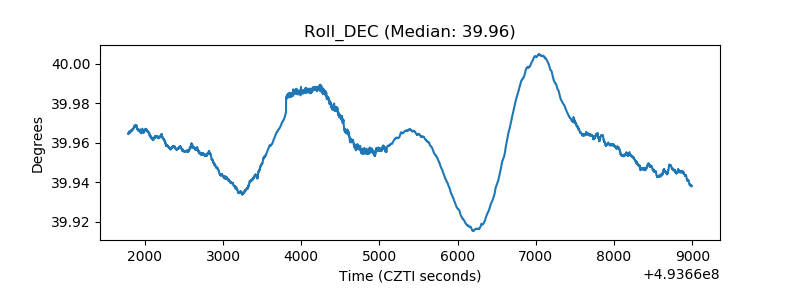 |
| _Roll_RA | 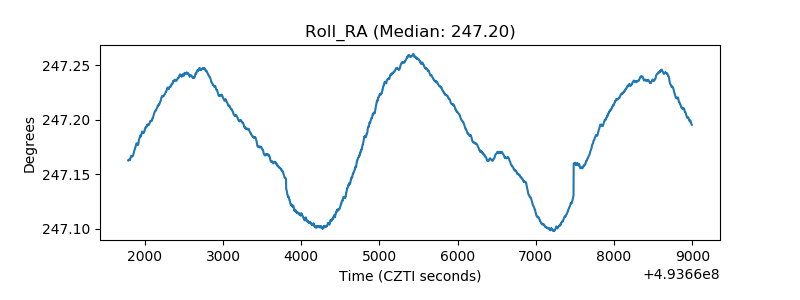 |
| Veto Counter | 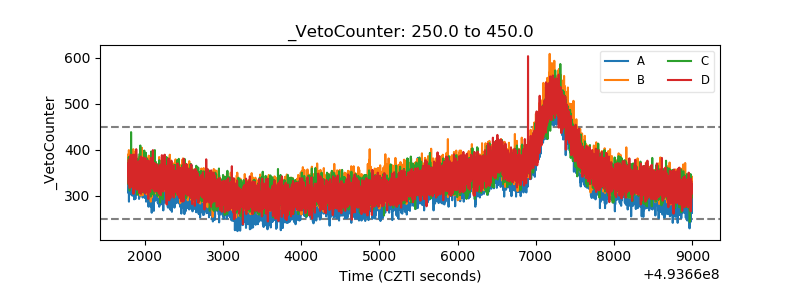 |