| Param | Original file | Final file |
|---|---|---|
| Filename | modeM0/AS1A14_004T05_9000006502_53577cztM0_level2.fits | modeM0/AS1A14_004T05_9000006502_53577cztM0_level2_quad_clean.evt |
| Size (bytes) | 1,350,639,360 | 70,372,800 |
| Size | 1.3 GB | 67.1 MB |
| Events in quadrant A | 11,366,378 | 446,870 |
| Events in quadrant B | 9,830,382 | 561,068 |
| Events in quadrant C | 11,544,775 | 439,346 |
| Events in quadrant D | 16,658,670 | 144,476 |
| Mode SS | |||
|---|---|---|---|
| Quadrant | BADHDUFLAG | Total packets | Discarded packets |
| A | 0 | 154 | 0 |
| B | 0 | 154 | 0 |
| C | 0 | 154 | 0 |
| D | 0 | 154 | 0 |
| Mode M0 | |||
|---|---|---|---|
| Quadrant | BADHDUFLAG | Total packets | Discarded packets |
| A | 0 | 39174 | 0 |
| B | 0 | 34580 | 2 |
| C | 0 | 39631 | 0 |
| D | 0 | 54794 | 0 |
| Quadrant | Total seconds | Saturated seconds | Saturation percentage |
|---|---|---|---|
| A | 7741 | 3372 | 43.560264% |
| B | 7741 | 2423 | 31.300866% |
| C | 7741 | 3082 | 39.813978% |
| D | 7741 | 6297 | 81.346079% |
Noise dominated data is calculated using 1-second bins in cleaned event files. If a bin has >2000 counts, and if more than 50% of those come from <1% of pixels, then it is considered to be noise-dominated and hence unusable.
| Quadrant | # 1 sec bins | Bins with >0 counts | Bins with >2000 counts | High rate bins dominated by noise | Noise dominated (total time) | Noise dominated (detector-on time) | Marked lightcurve |
|---|---|---|---|---|---|---|---|
| A | 7741 | 7739 | 2389 | 2389 | 30.86% | 30.87% | 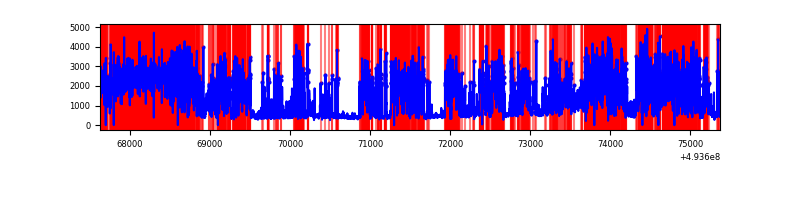 |
| B | 7741 | 7740 | 1663 | 1663 | 21.48% | 21.49% | 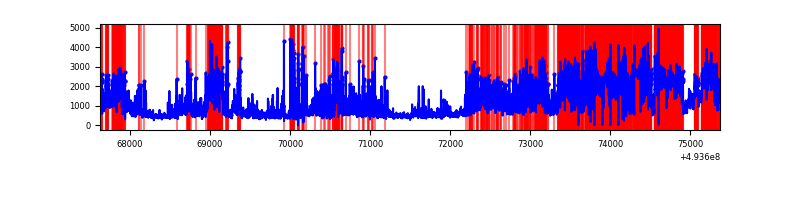 |
| C | 7741 | 7741 | 2477 | 2477 | 32.00% | 32.00% | 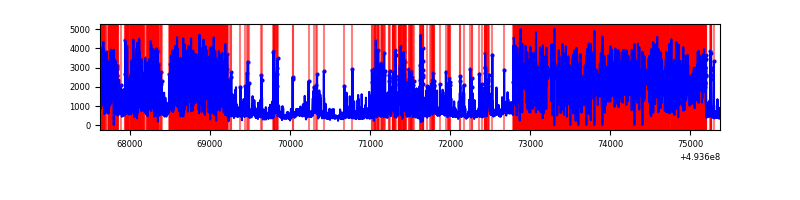 |
| D | 7741 | 7739 | 4840 | 4840 | 62.52% | 62.54% | 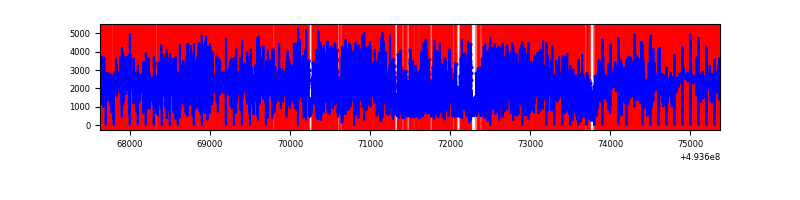 |
Top three noisy pixels from each quadrant. If the there are fewer than three noisy pixels in the level2.evt file, extra rows are filled as -1
| Pixel properties | Quadrant properties | ||||||
|---|---|---|---|---|---|---|---|
| Quadrant | DetID | PixID | Counts | Sigma | Mean | Median | Sigma |
| A | 3 | 63 | 5164051 | 31970.21 | 640 | 624 | 161.5 |
| A | 3 | 62 | 1622636 | 10042.96 | 640 | 624 | 161.5 |
| A | 4 | 239 | 782475 | 4840.96 | 640 | 624 | 161.5 |
| B | 5 | 172 | 2865106 | 19339.42 | 692 | 669 | 148.1 |
| B | 4 | 206 | 1948571 | 13151.38 | 692 | 669 | 148.1 |
| B | 10 | 28 | 794314 | 5358.34 | 692 | 669 | 148.1 |
| C | 15 | 224 | 5033566 | 30053.25 | 605 | 600 | 167.5 |
| C | 1 | 241 | 1924505 | 11488.18 | 605 | 600 | 167.5 |
| C | 15 | 157 | 534259 | 3186.63 | 605 | 600 | 167.5 |
| D | 8 | 176 | 14385995 | 153617.19 | 318 | 303 | 93.6 |
| D | 2 | 16 | 323587 | 3452.17 | 318 | 303 | 93.6 |
| D | 13 | 153 | 167691 | 1787.44 | 318 | 303 | 93.6 |
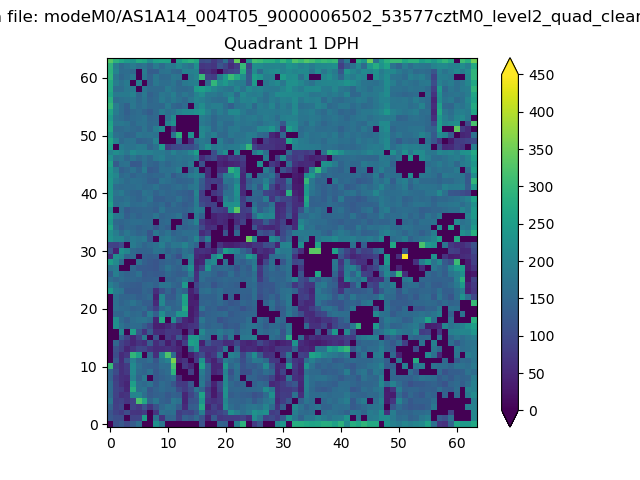
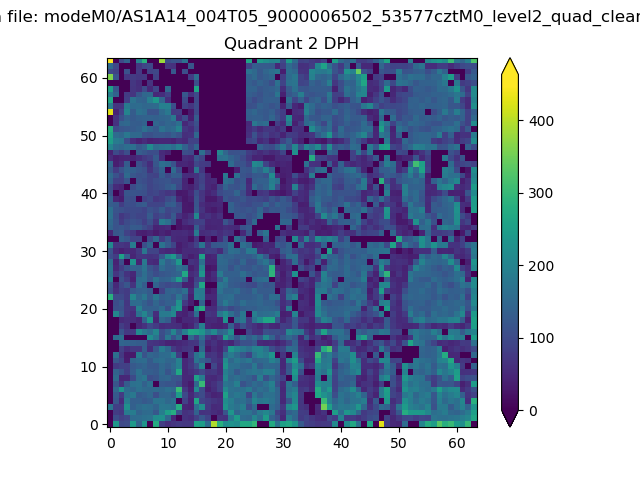
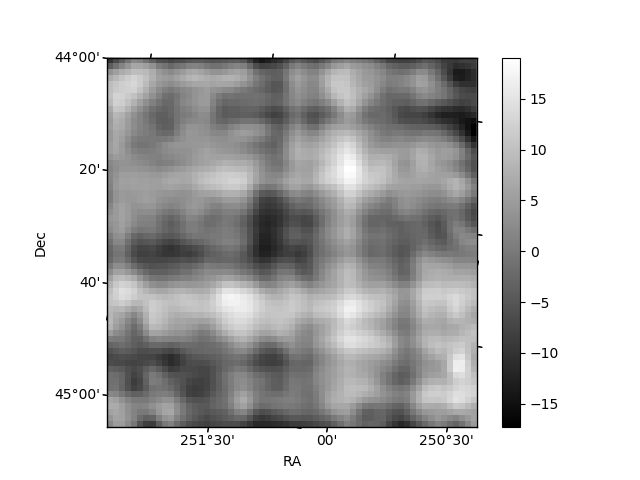
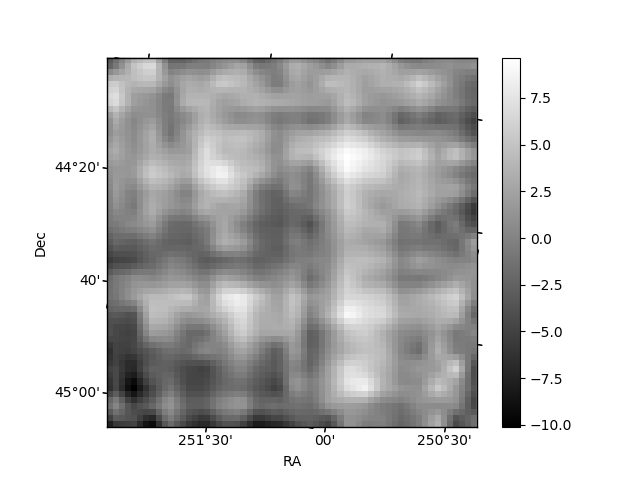
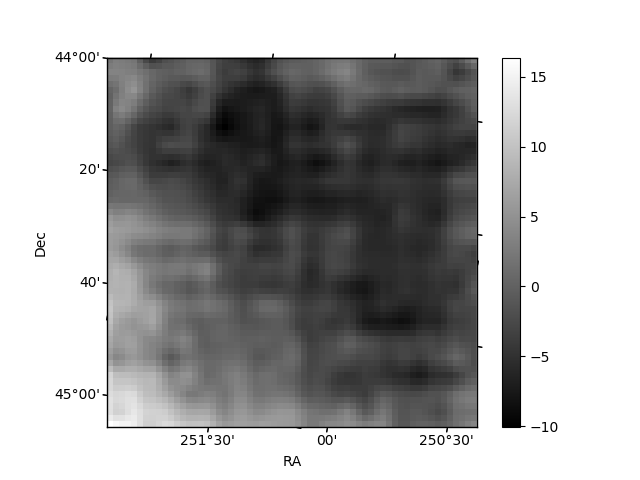
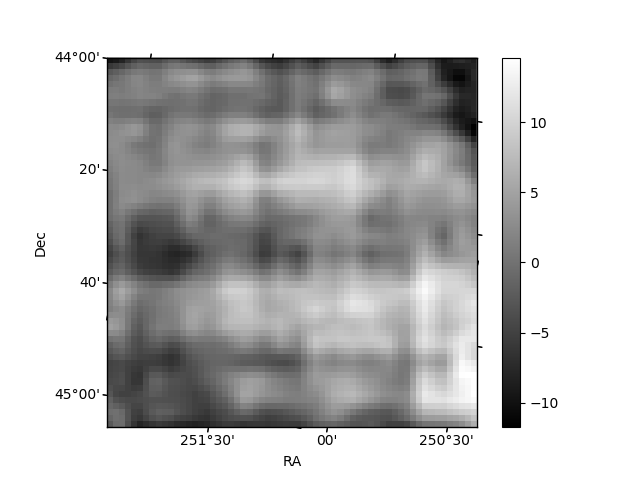
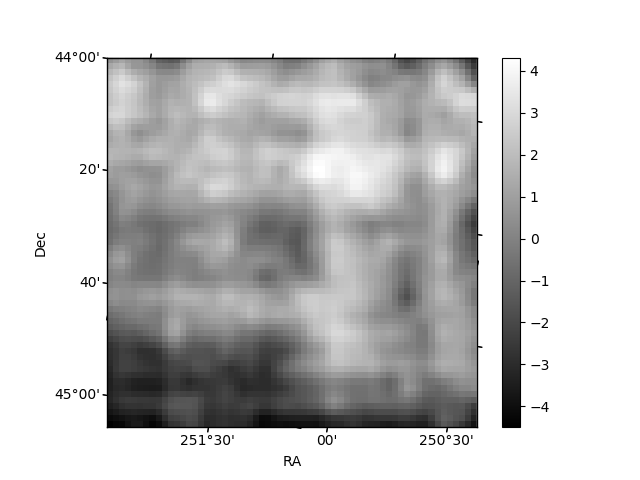
Histogram calculated using DETX and DETY for each event in the final _common_clean file
| Quadrant A |  |
 |
Quadrant B |
|---|---|---|---|
| Quadrant D | 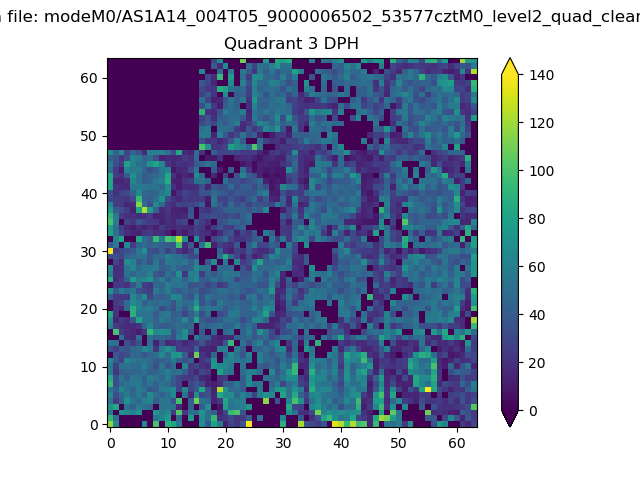 |
 |
Quadrant C |
| Plot type | Count rate plots | Images |
|---|---|---|
| Comparison with Poisson distribution Blue bars denote a histogram of data divided into 1 sec bins. Red curve is a Poisson curve with rate = median count rate of data. |
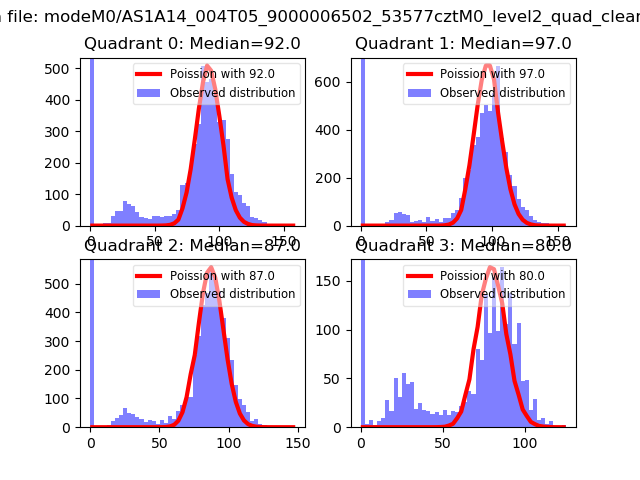 |
 |
| Quadrant-wise count rates Data is divided into 100 sec bins |
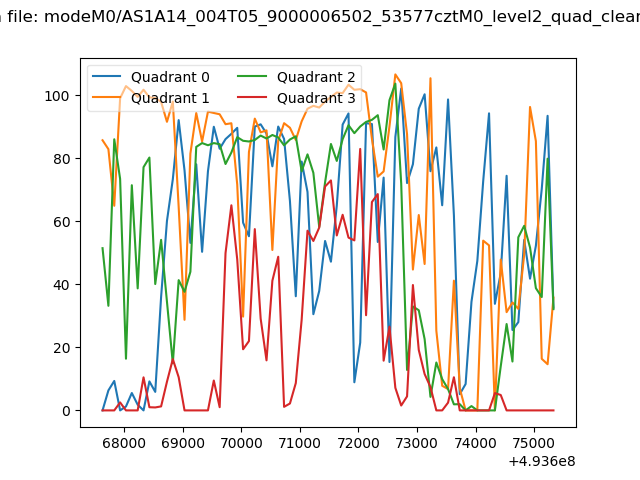 |
|
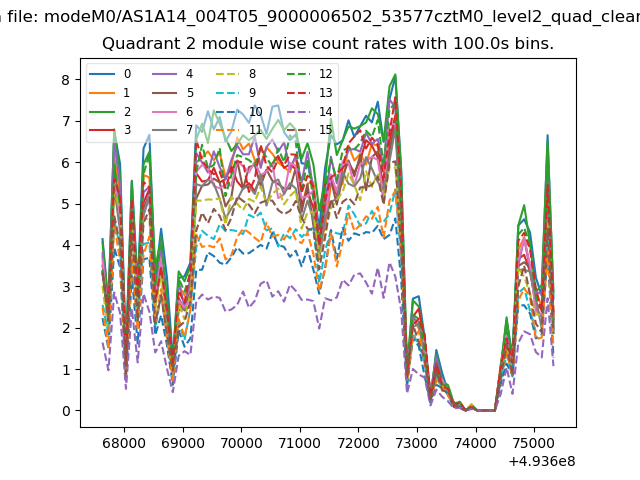
| Module-wise count rates for Quadrant A Data is divided into 100 sec bins |
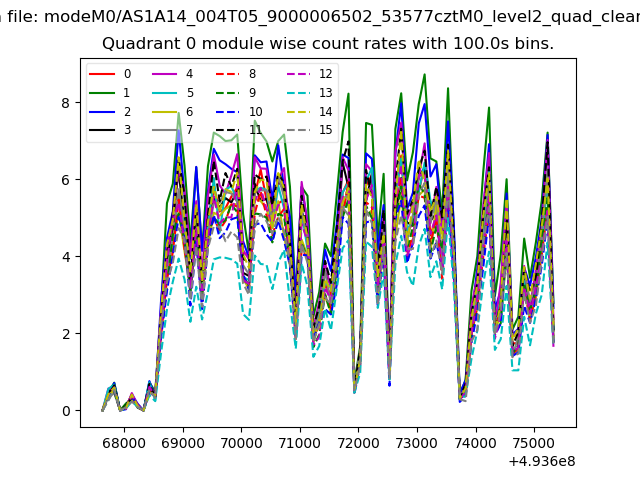 |
 |
| Module-wise count rates for Quadrant B Data is divided into 100 sec bins |
 |
 |
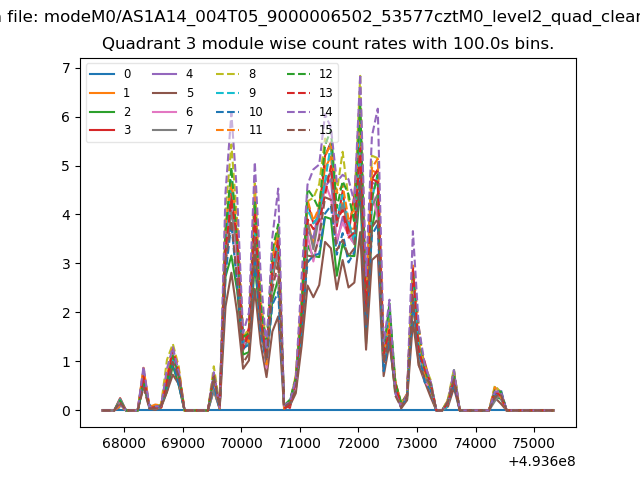
| Module-wise count rates for Quadrant C Data is divided into 100 sec bins |
 |
 |
| Module-wise count rates for Quadrant D Data is divided into 100 sec bins |
 |
 |
| Parameter | Plot |
|---|---|
| CZT HV Monitor |  |
| D_VDD | 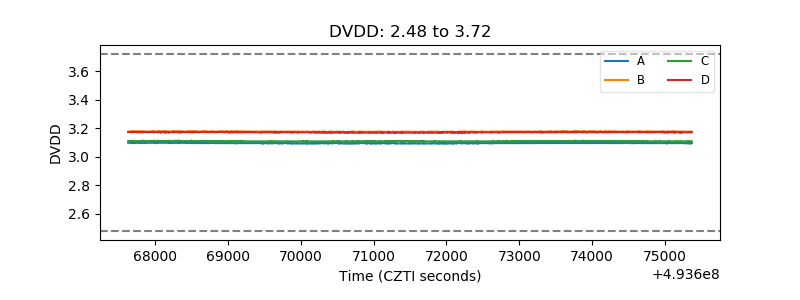 |
| Temperature 1 | 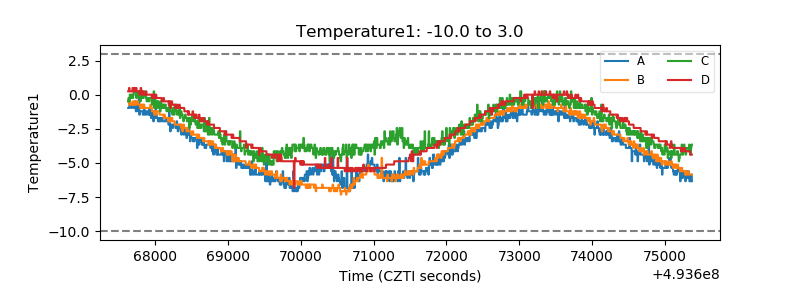 |
| Veto HV Monitor | 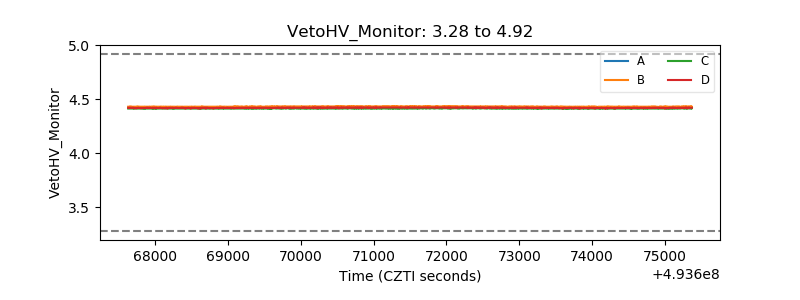 |
| Veto LLD | 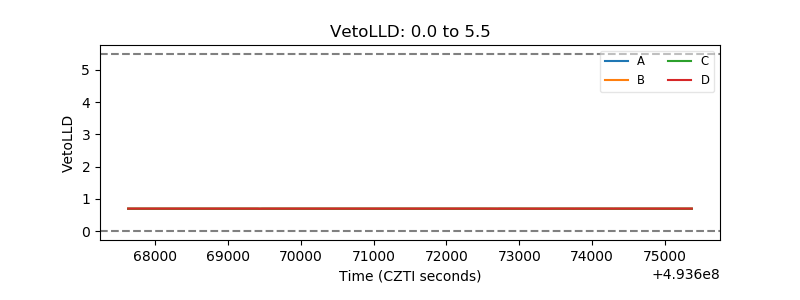 |
| Alpha Counter | 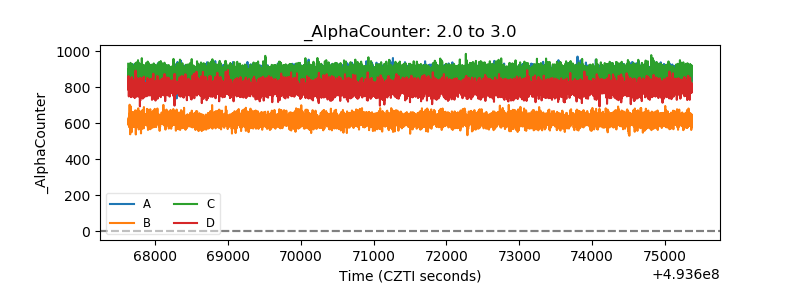 |
| _CPM_Rate | 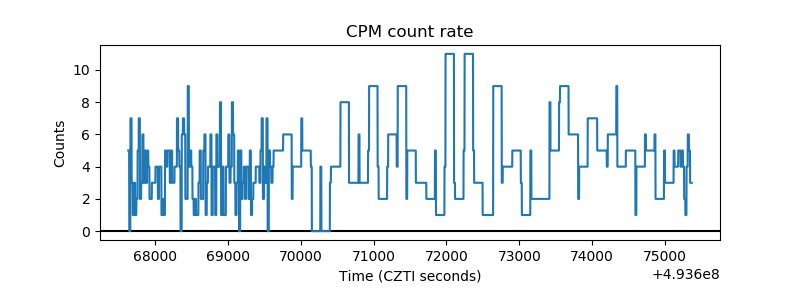 |
| CZT Counter | 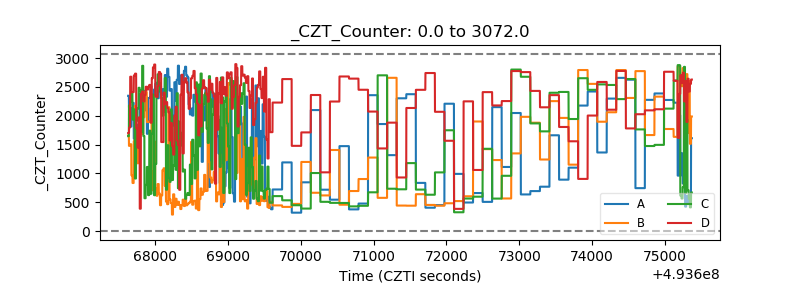 |
| +2.5 Volts monitor |  |
| +5 Volts monitor |  |
| _ROLL_ROT | 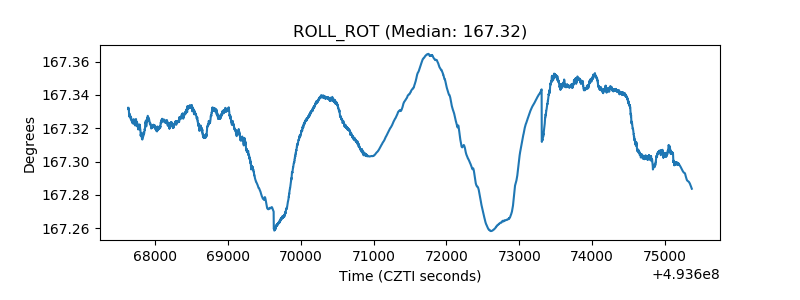 |
| _Roll_DEC | 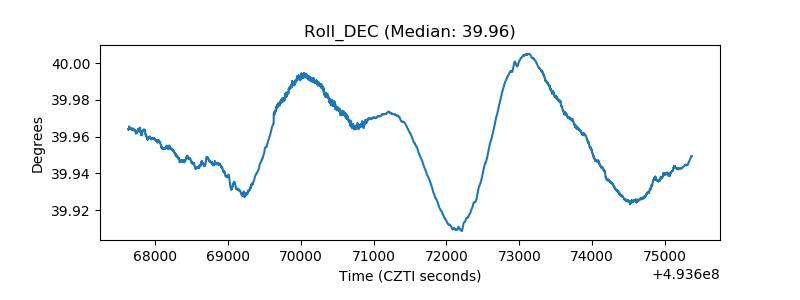 |
| _Roll_RA | 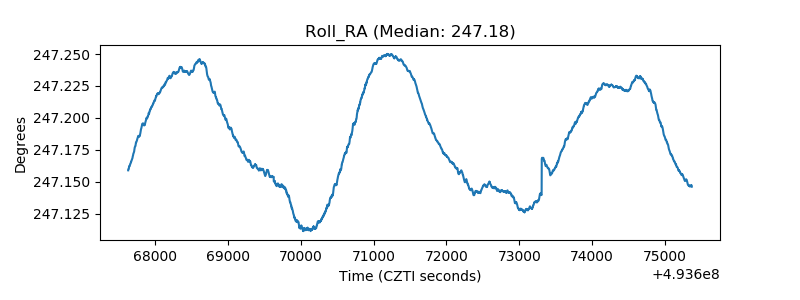 |
| Veto Counter | 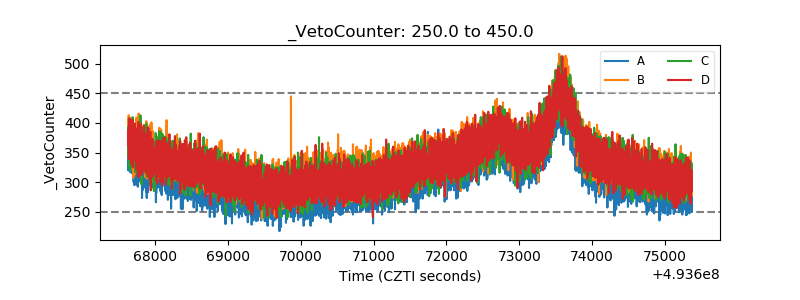 |