| Param | Original file | Final file |
|---|---|---|
| Filename | modeM0/AS1A14_004T05_9000006502_53578cztM0_level2.fits | modeM0/AS1A14_004T05_9000006502_53578cztM0_level2_quad_clean.evt |
| Size (bytes) | 1,270,437,120 | 70,695,360 |
| Size | 1.2 GB | 67.4 MB |
| Events in quadrant A | 10,474,154 | 433,742 |
| Events in quadrant B | 10,199,360 | 559,547 |
| Events in quadrant C | 11,231,379 | 449,173 |
| Events in quadrant D | 14,549,138 | 178,945 |
| Mode SS | |||
|---|---|---|---|
| Quadrant | BADHDUFLAG | Total packets | Discarded packets |
| A | 0 | 150 | 0 |
| B | 0 | 150 | 0 |
| C | 0 | 150 | 0 |
| D | 0 | 150 | 0 |
| Mode M0 | |||
|---|---|---|---|
| Quadrant | BADHDUFLAG | Total packets | Discarded packets |
| A | 0 | 36300 | 0 |
| B | 0 | 35506 | 2 |
| C | 0 | 38522 | 0 |
| D | 0 | 48344 | 0 |
| Quadrant | Total seconds | Saturated seconds | Saturation percentage |
|---|---|---|---|
| A | 7445 | 3114 | 41.826729% |
| B | 7444 | 2189 | 29.406233% |
| C | 7444 | 2811 | 37.761956% |
| D | 7444 | 5475 | 73.549167% |
Noise dominated data is calculated using 1-second bins in cleaned event files. If a bin has >2000 counts, and if more than 50% of those come from <1% of pixels, then it is considered to be noise-dominated and hence unusable.
| Quadrant | # 1 sec bins | Bins with >0 counts | Bins with >2000 counts | High rate bins dominated by noise | Noise dominated (total time) | Noise dominated (detector-on time) | Marked lightcurve |
|---|---|---|---|---|---|---|---|
| A | 7444 | 7443 | 2096 | 2096 | 28.16% | 28.16% | 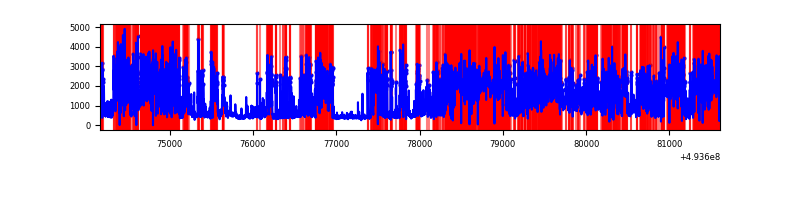 |
| B | 7444 | 7444 | 1759 | 1759 | 23.63% | 23.63% | 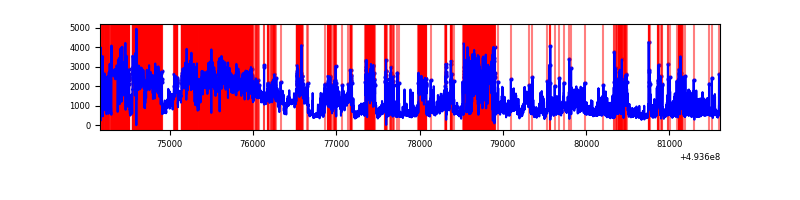 |
| C | 7444 | 7444 | 2231 | 2231 | 29.97% | 29.97% | 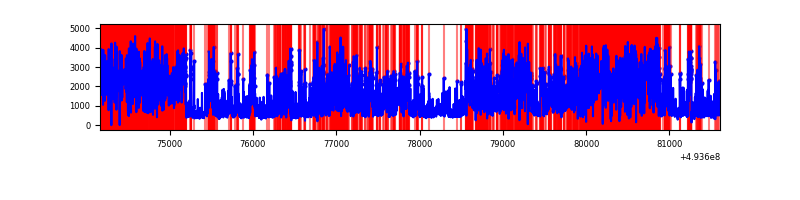 |
| D | 7443 | 7443 | 4175 | 4175 | 56.09% | 56.09% | 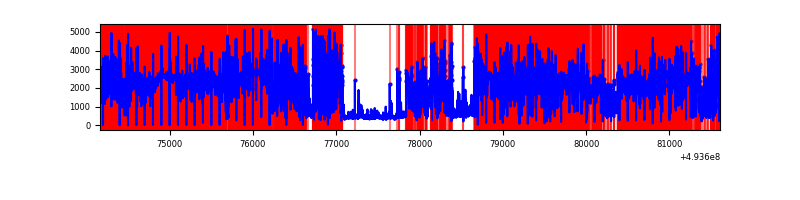 |
Top three noisy pixels from each quadrant. If the there are fewer than three noisy pixels in the level2.evt file, extra rows are filled as -1
| Pixel properties | Quadrant properties | ||||||
|---|---|---|---|---|---|---|---|
| Quadrant | DetID | PixID | Counts | Sigma | Mean | Median | Sigma |
| A | 3 | 63 | 5445787 | 35075.78 | 621 | 604 | 155.2 |
| A | 3 | 62 | 1612881 | 10385.67 | 621 | 604 | 155.2 |
| A | 4 | 239 | 457254 | 2941.56 | 621 | 604 | 155.2 |
| B | 5 | 172 | 4878314 | 32011.74 | 710 | 684 | 152.4 |
| B | 4 | 206 | 896443 | 5878.84 | 710 | 684 | 152.4 |
| B | 2 | 249 | 408466 | 2676.26 | 710 | 684 | 152.4 |
| C | 15 | 224 | 4756312 | 27483.12 | 623 | 617 | 173.0 |
| C | 1 | 241 | 1149095 | 6637.04 | 623 | 617 | 173.0 |
| C | 4 | 5 | 756773 | 4369.82 | 623 | 617 | 173.0 |
| D | 8 | 176 | 11619636 | 123731.52 | 324 | 309 | 93.9 |
| D | 3 | 12 | 957040 | 10188.01 | 324 | 309 | 93.9 |
| D | 7 | 70 | 214653 | 2282.5 | 324 | 309 | 93.9 |
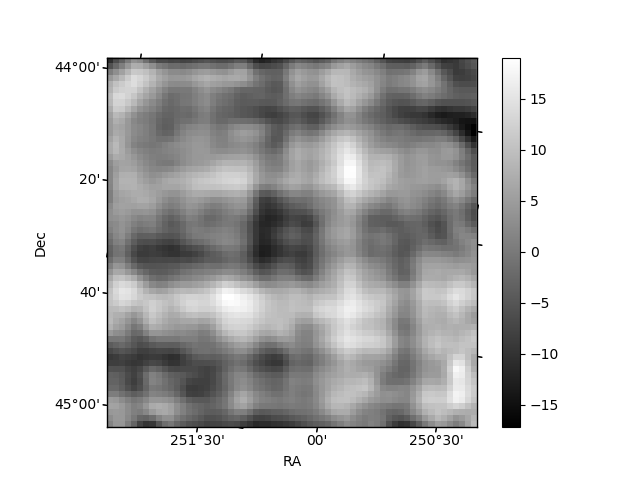
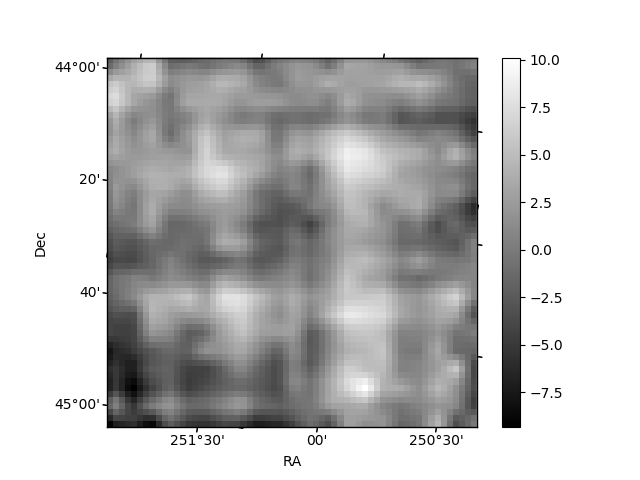
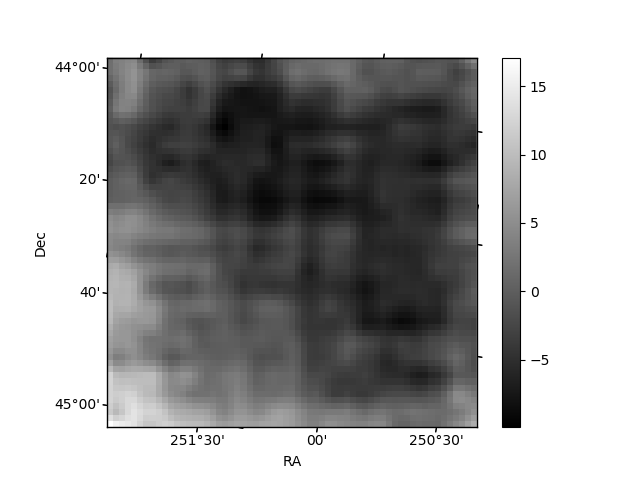
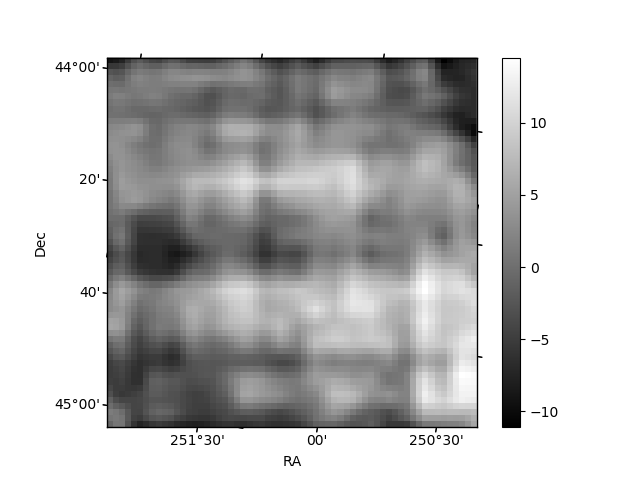
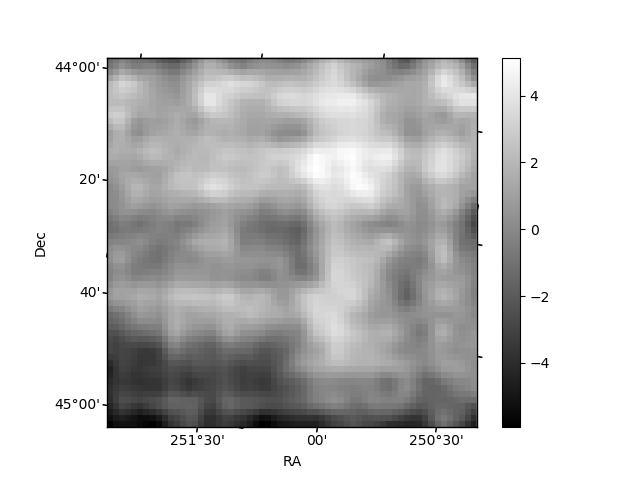
Histogram calculated using DETX and DETY for each event in the final _common_clean file
| Quadrant A | 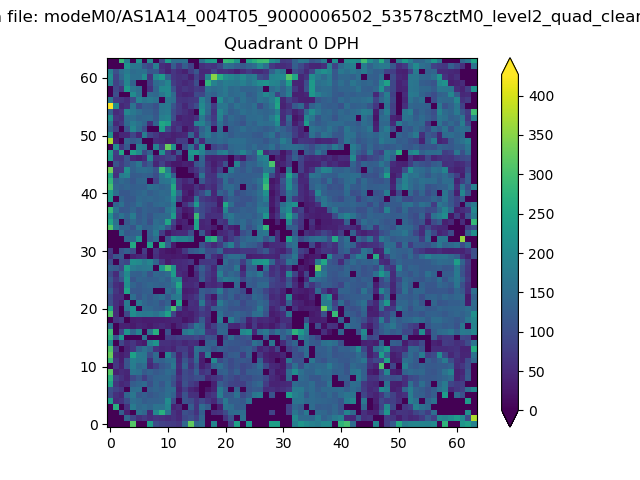 |
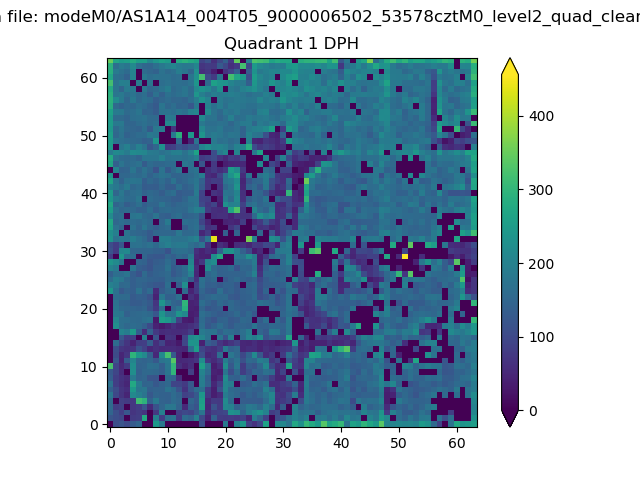 |
Quadrant B |
|---|---|---|---|
| Quadrant D | 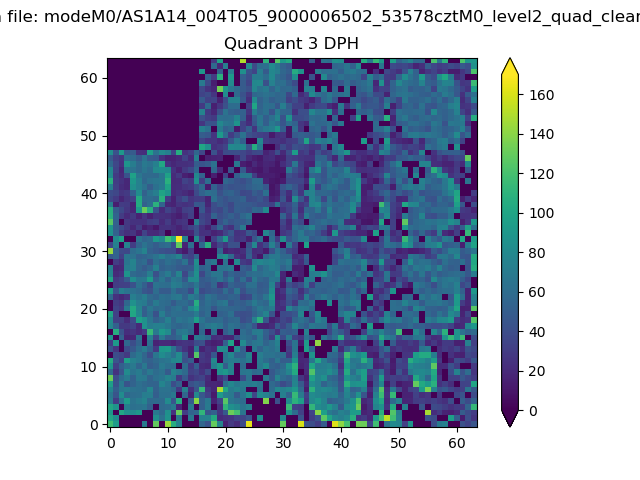 |
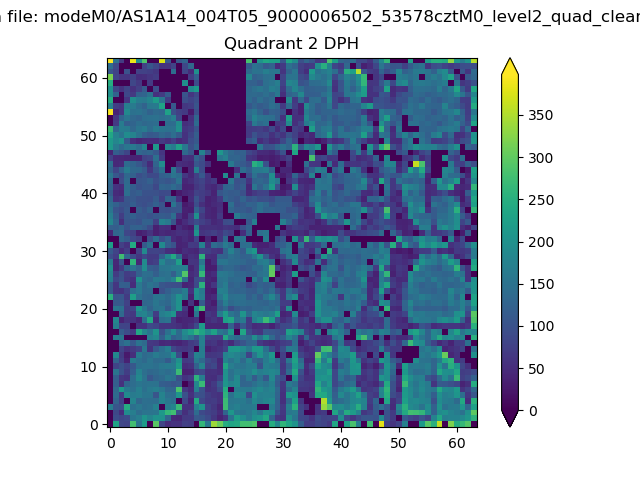 |
Quadrant C |
| Plot type | Count rate plots | Images |
|---|---|---|
| Comparison with Poisson distribution Blue bars denote a histogram of data divided into 1 sec bins. Red curve is a Poisson curve with rate = median count rate of data. |
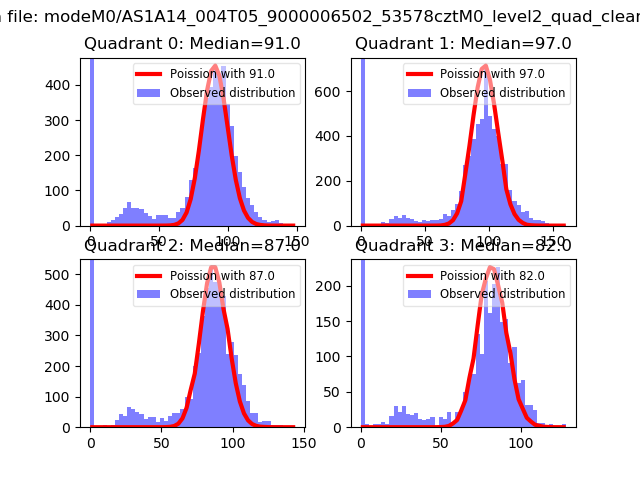 |
 |
| Quadrant-wise count rates Data is divided into 100 sec bins |
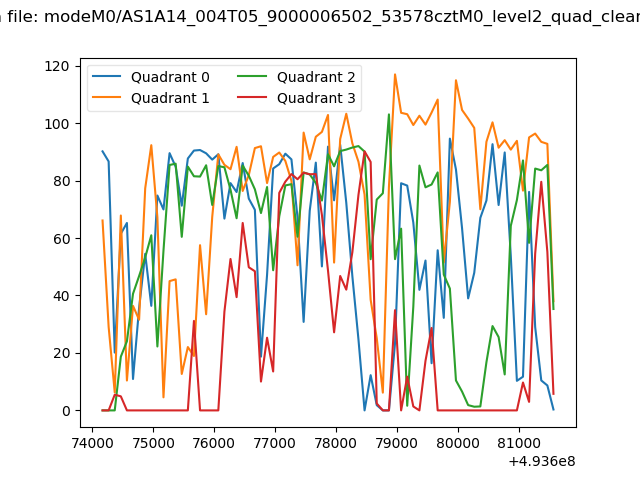 |
|
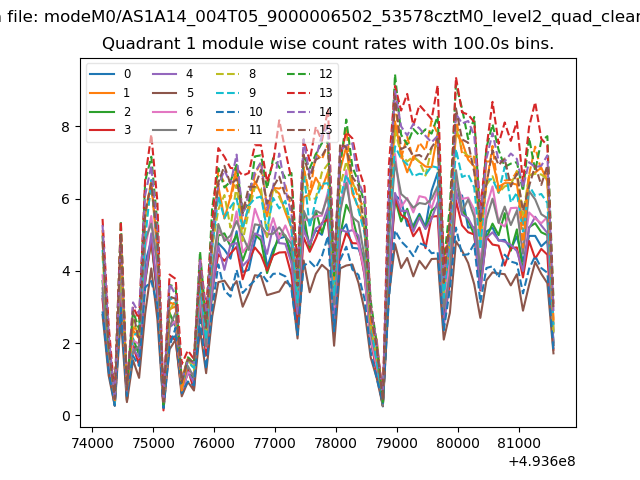
| Module-wise count rates for Quadrant A Data is divided into 100 sec bins |
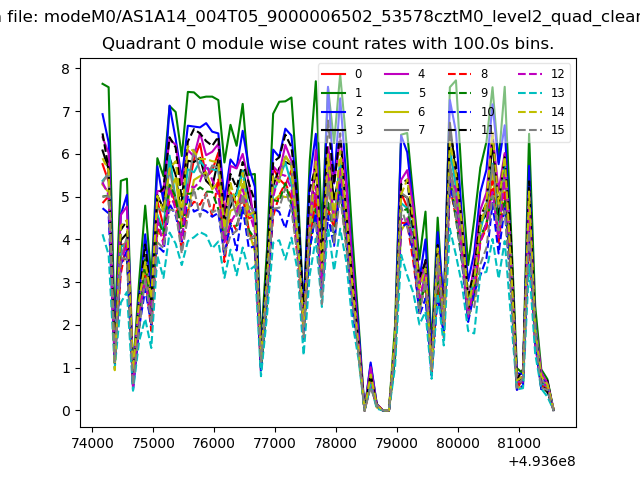 |
 |
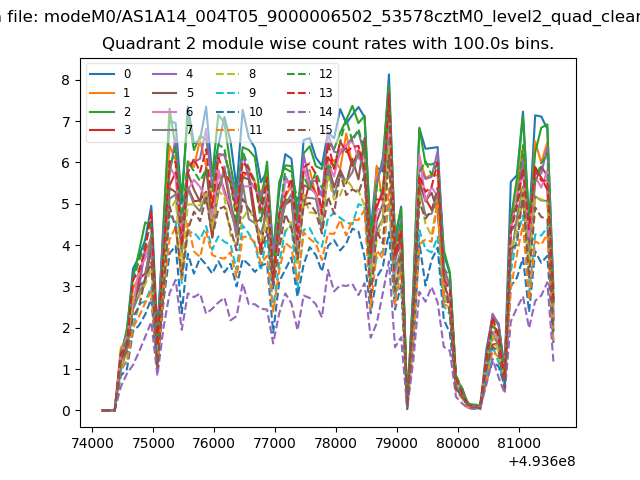
| Module-wise count rates for Quadrant B Data is divided into 100 sec bins |
 |
 |
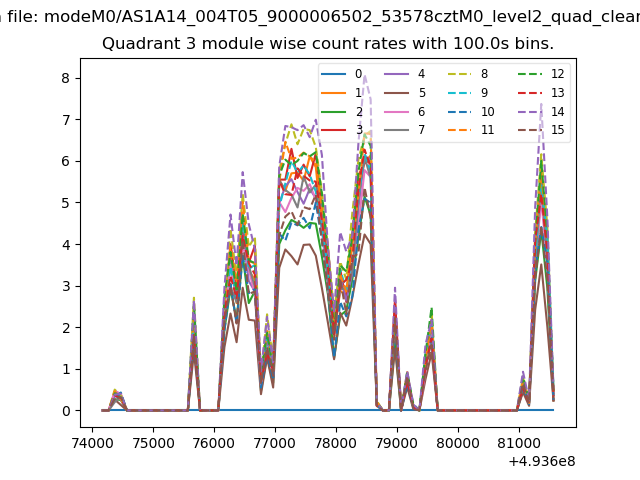
| Module-wise count rates for Quadrant C Data is divided into 100 sec bins |
 |
 |
| Module-wise count rates for Quadrant D Data is divided into 100 sec bins |
 |
 |
| Parameter | Plot |
|---|---|
| CZT HV Monitor | 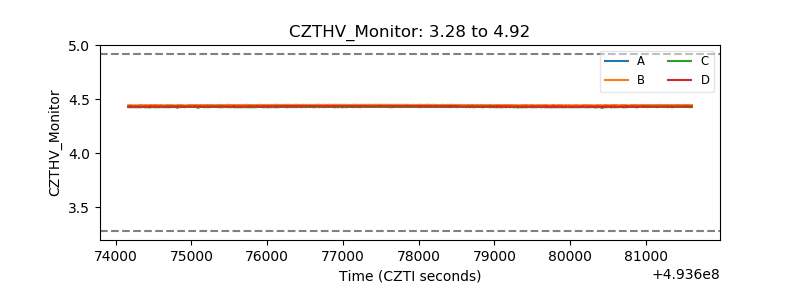 |
| D_VDD | 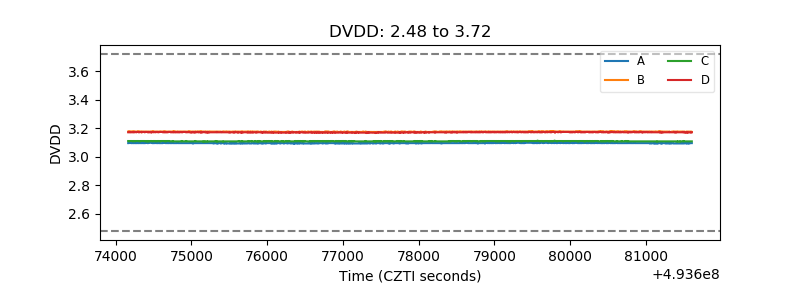 |
| Temperature 1 | 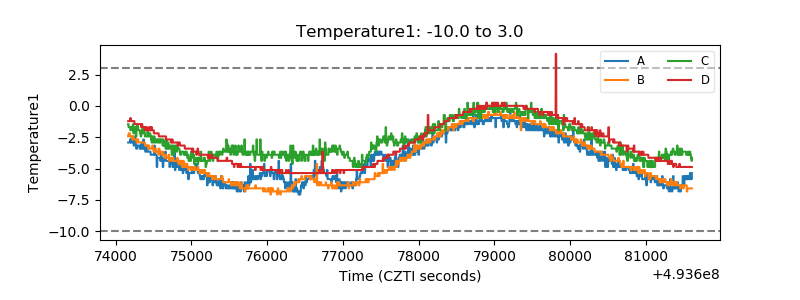 |
| Veto HV Monitor | 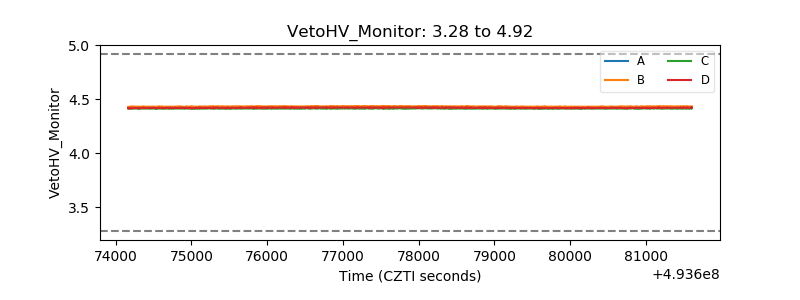 |
| Veto LLD | 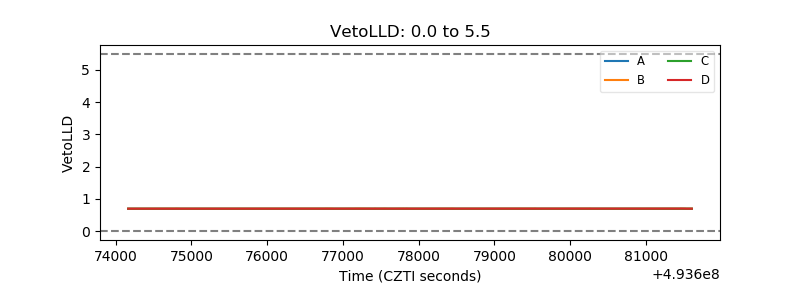 |
| Alpha Counter | 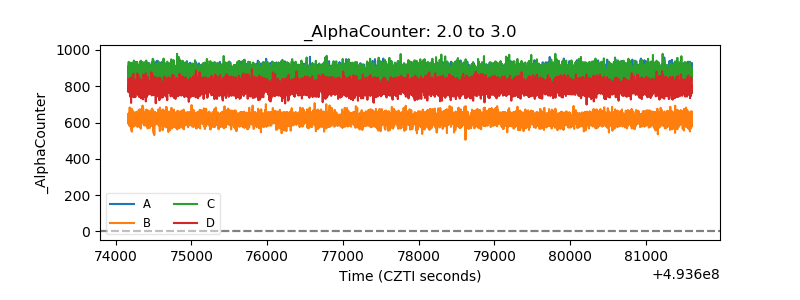 |
| _CPM_Rate | 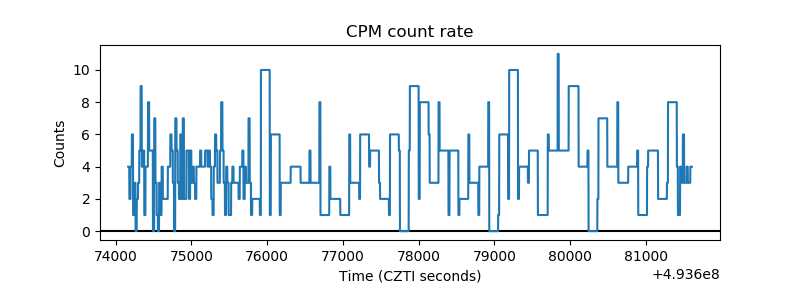 |
| CZT Counter | 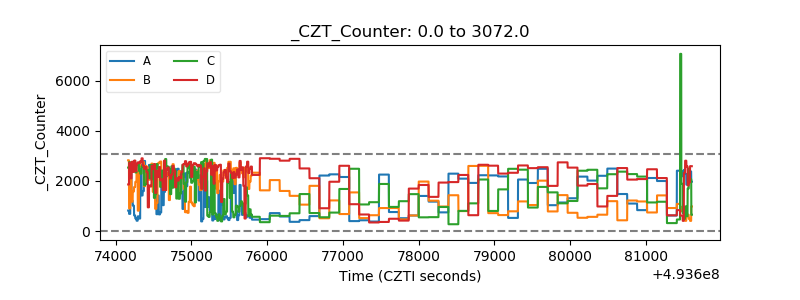 |
| +2.5 Volts monitor | 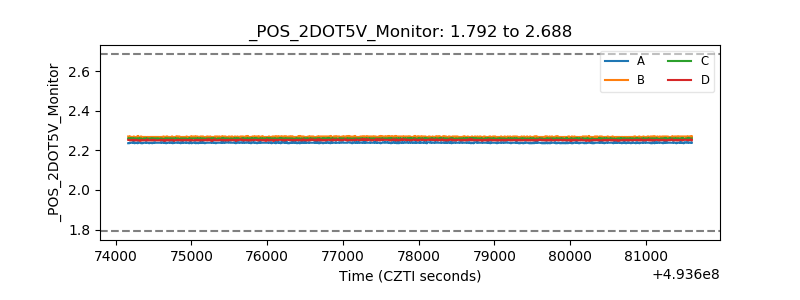 |
| +5 Volts monitor |  |
| _ROLL_ROT | 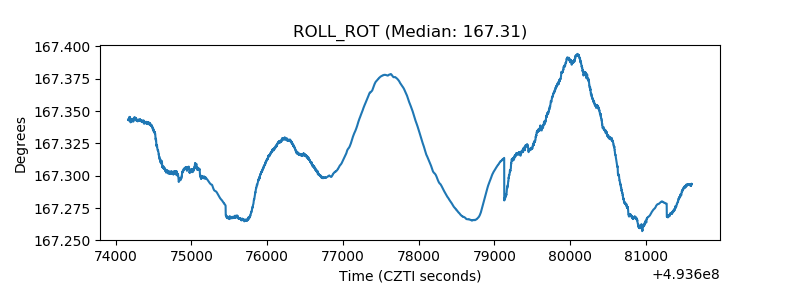 |
| _Roll_DEC | 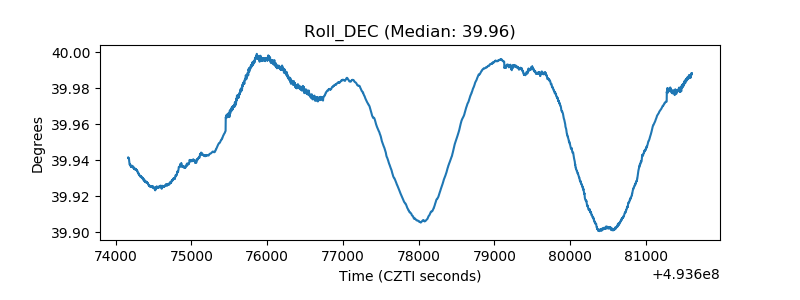 |
| _Roll_RA | 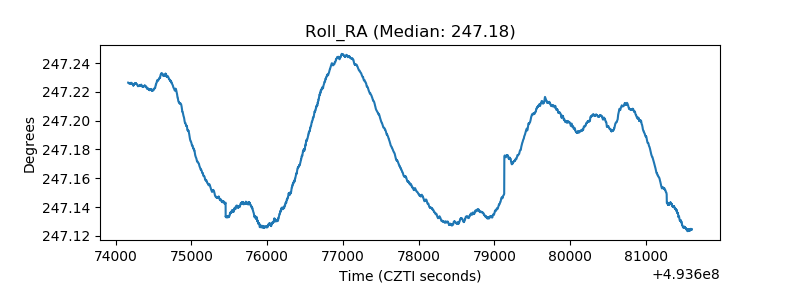 |
| Veto Counter | 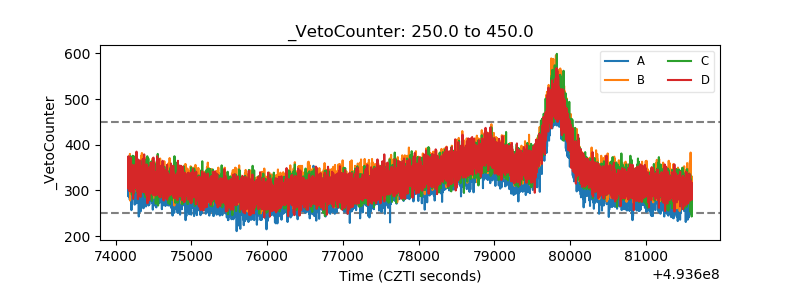 |