| Param | Original file | Final file |
|---|---|---|
| Filename | modeM0/AS1A14_004T05_9000006502_53580cztM0_level2.fits | modeM0/AS1A14_004T05_9000006502_53580cztM0_level2_quad_clean.evt |
| Size (bytes) | 935,945,280 | 65,508,480 |
| Size | 892.6 MB | 62.5 MB |
| Events in quadrant A | 9,039,042 | 369,766 |
| Events in quadrant B | 5,818,929 | 574,319 |
| Events in quadrant C | 9,482,111 | 355,799 |
| Events in quadrant D | 9,824,839 | 249,203 |
| Mode M9 | |||
|---|---|---|---|
| Quadrant | BADHDUFLAG | Total packets | Discarded packets |
| A | 0 | 3 | 0 |
| B | 0 | 3 | 0 |
| C | 0 | 3 | 0 |
| D | 0 | 3 | 0 |
| Mode SS | |||
|---|---|---|---|
| Quadrant | BADHDUFLAG | Total packets | Discarded packets |
| A | 0 | 126 | 0 |
| B | 0 | 126 | 0 |
| C | 0 | 126 | 0 |
| D | 0 | 126 | 0 |
| Mode M0 | |||
|---|---|---|---|
| Quadrant | BADHDUFLAG | Total packets | Discarded packets |
| A | 0 | 31167 | 1 |
| B | 0 | 21648 | 1 |
| C | 0 | 32430 | 1 |
| D | 0 | 33540 | 2 |
| Quadrant | Total seconds | Saturated seconds | Saturation percentage |
|---|---|---|---|
| A | 6216 | 2706 | 43.532819% |
| B | 6217 | 807 | 12.980537% |
| C | 6217 | 2577 | 41.450861% |
| D | 6216 | 3351 | 53.909266% |
Noise dominated data is calculated using 1-second bins in cleaned event files. If a bin has >2000 counts, and if more than 50% of those come from <1% of pixels, then it is considered to be noise-dominated and hence unusable.
| Quadrant | # 1 sec bins | Bins with >0 counts | Bins with >2000 counts | High rate bins dominated by noise | Noise dominated (total time) | Noise dominated (detector-on time) | Marked lightcurve |
|---|---|---|---|---|---|---|---|
| A | 6531 | 6217 | 1646 | 1646 | 25.20% | 26.48% | 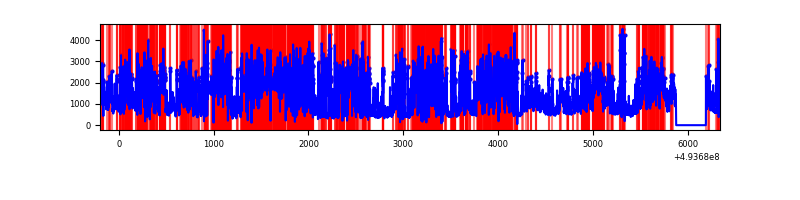 |
| B | 6532 | 6218 | 326 | 326 | 4.99% | 5.24% | 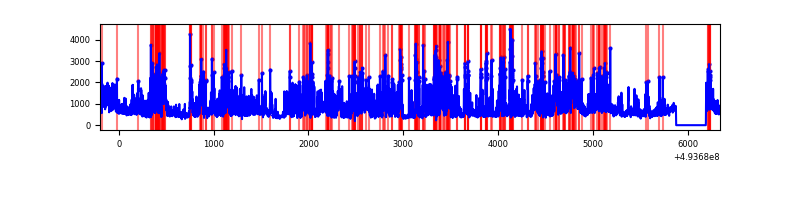 |
| C | 6532 | 6217 | 1962 | 1962 | 30.04% | 31.56% | 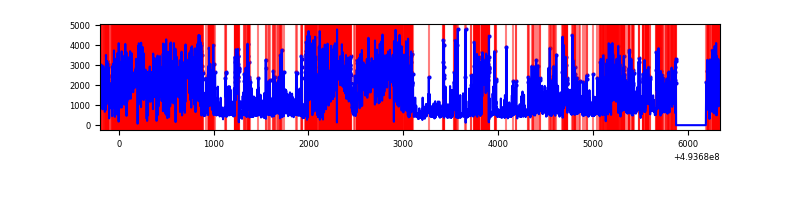 |
| D | 6530 | 6215 | 2452 | 2452 | 37.55% | 39.45% | 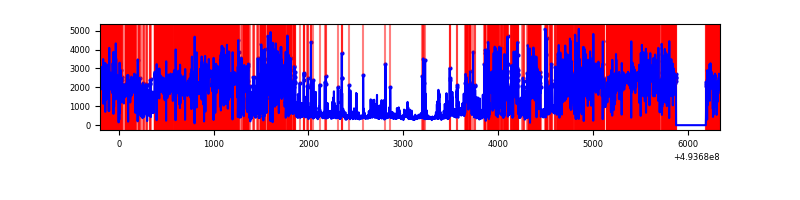 |
Top three noisy pixels from each quadrant. If the there are fewer than three noisy pixels in the level2.evt file, extra rows are filled as -1
| Pixel properties | Quadrant properties | ||||||
|---|---|---|---|---|---|---|---|
| Quadrant | DetID | PixID | Counts | Sigma | Mean | Median | Sigma |
| A | 3 | 63 | 4506325 | 32777.4 | 551 | 536 | 137.5 |
| A | 3 | 62 | 1520242 | 11055.11 | 551 | 536 | 137.5 |
| A | 15 | 174 | 270005 | 1960.25 | 551 | 536 | 137.5 |
| B | 4 | 206 | 2149797 | 15337.31 | 652 | 628 | 140.1 |
| B | 2 | 249 | 216169 | 1538.18 | 652 | 628 | 140.1 |
| B | 10 | 28 | 191787 | 1364.18 | 652 | 628 | 140.1 |
| C | 15 | 224 | 3312725 | 23058.79 | 521 | 517 | 143.6 |
| C | 1 | 241 | 2584901 | 17991.86 | 521 | 517 | 143.6 |
| C | 15 | 177 | 332955 | 2314.35 | 521 | 517 | 143.6 |
| D | 8 | 176 | 7376646 | 67117.57 | 376 | 359 | 109.9 |
| D | 12 | 1 | 388915 | 3535.51 | 376 | 359 | 109.9 |
| D | 7 | 70 | 151882 | 1378.72 | 376 | 359 | 109.9 |
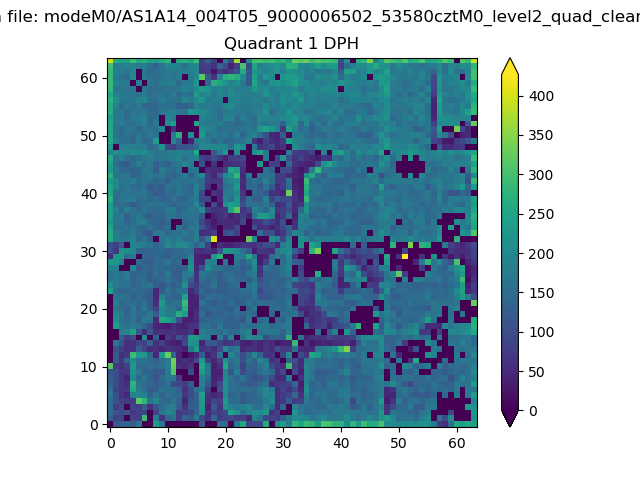
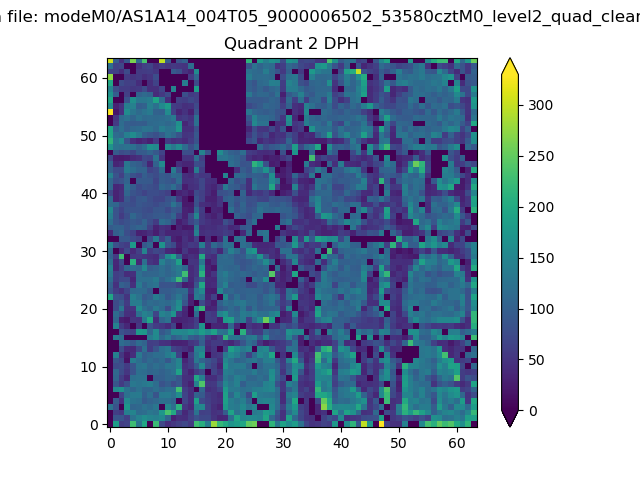
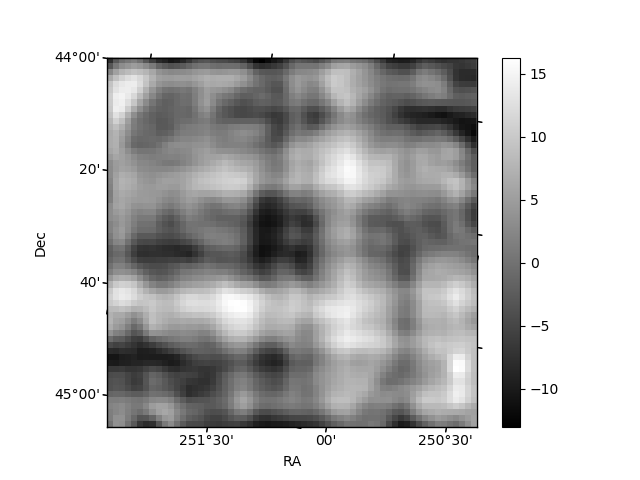
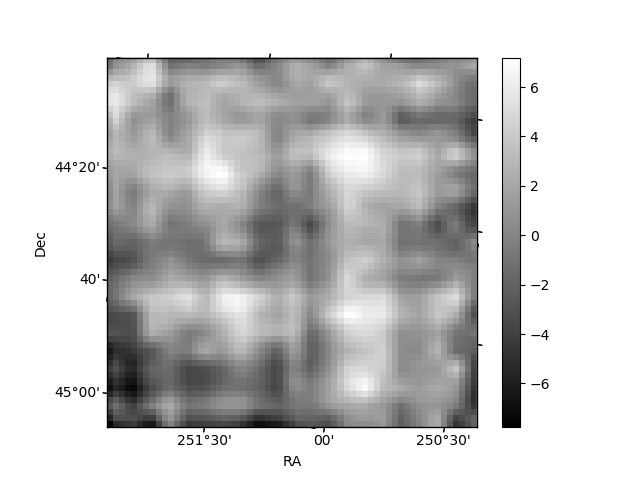
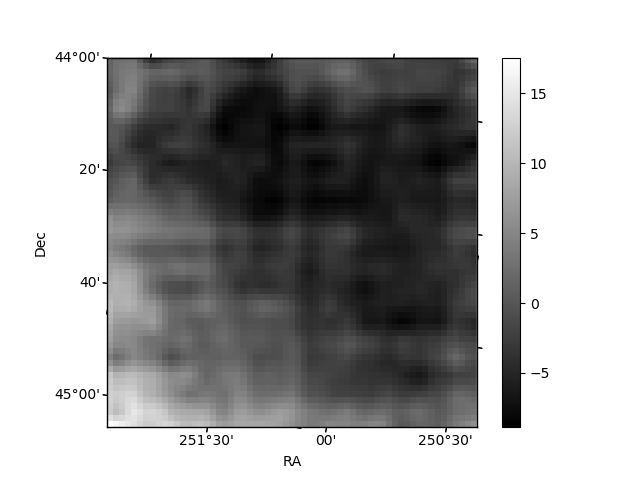
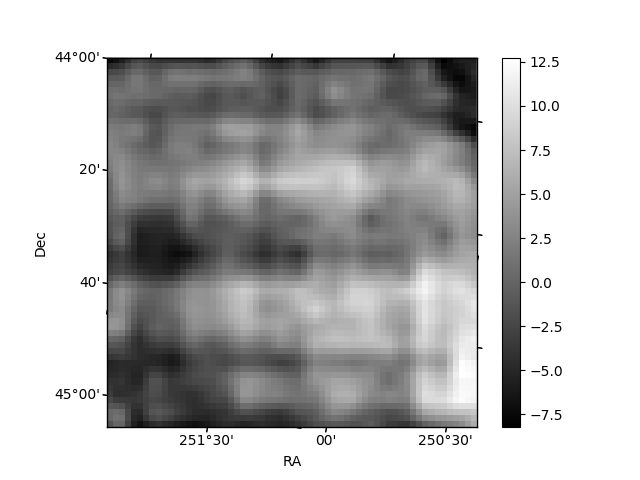
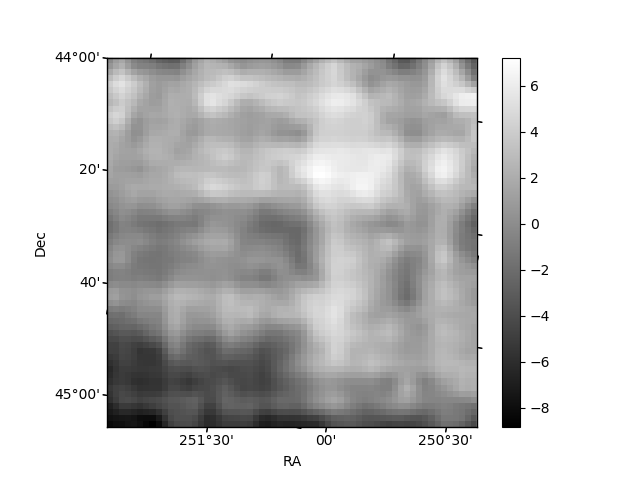
Histogram calculated using DETX and DETY for each event in the final _common_clean file
| Quadrant A |  |
 |
Quadrant B |
|---|---|---|---|
| Quadrant D | 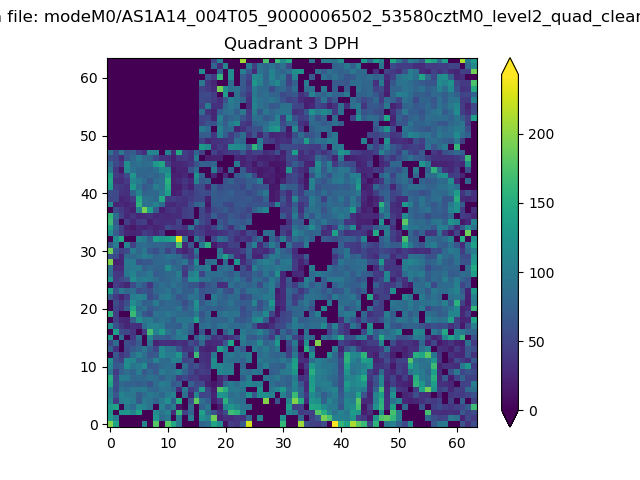 |
 |
Quadrant C |
| Plot type | Count rate plots | Images |
|---|---|---|
| Comparison with Poisson distribution Blue bars denote a histogram of data divided into 1 sec bins. Red curve is a Poisson curve with rate = median count rate of data. |
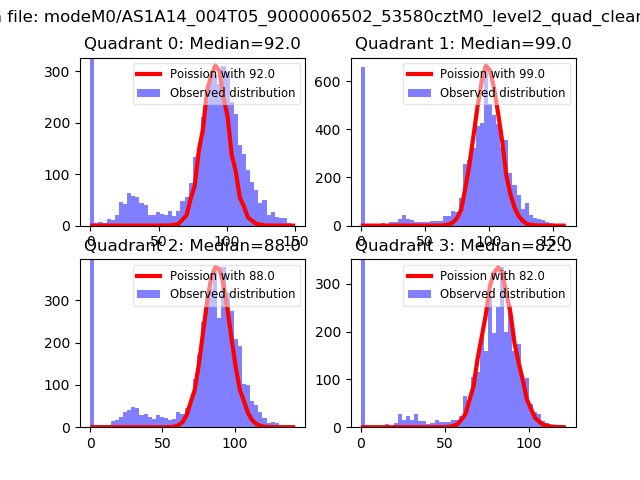 |
 |
| Quadrant-wise count rates Data is divided into 100 sec bins |
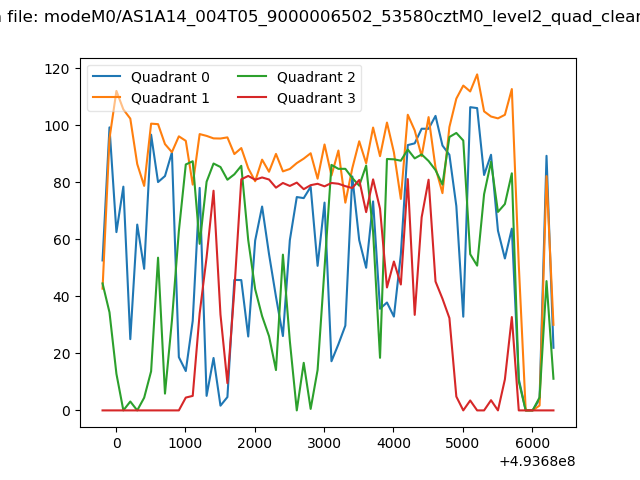 |
|
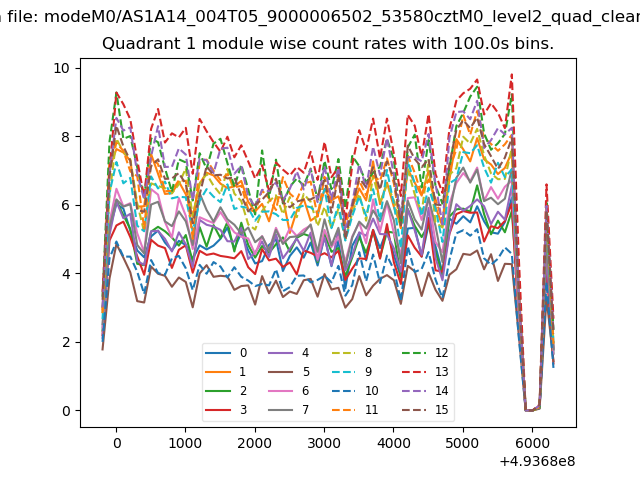
| Module-wise count rates for Quadrant A Data is divided into 100 sec bins |
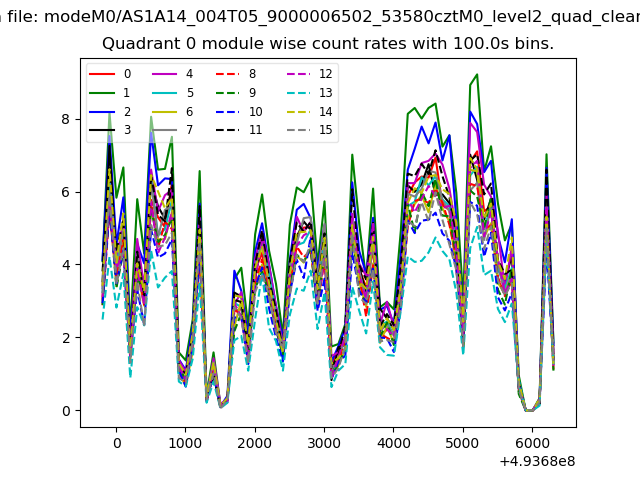 |
 |
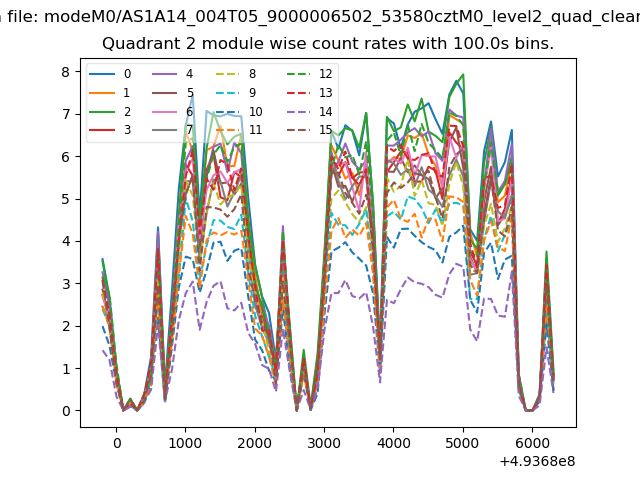
| Module-wise count rates for Quadrant B Data is divided into 100 sec bins |
 |
 |
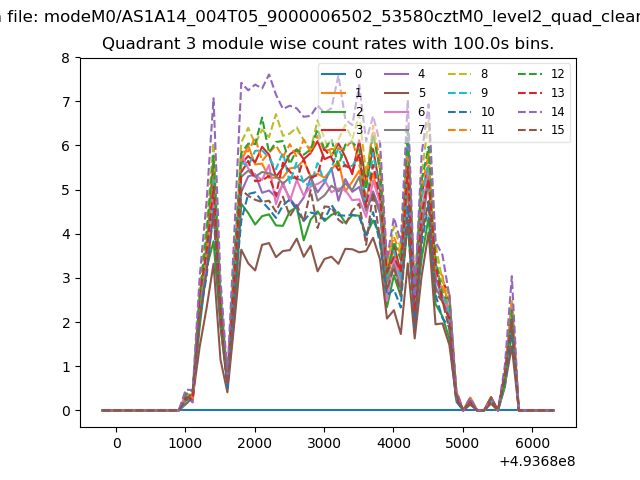
| Module-wise count rates for Quadrant C Data is divided into 100 sec bins |
 |
 |
| Module-wise count rates for Quadrant D Data is divided into 100 sec bins |
 |
 |
| Parameter | Plot |
|---|---|
| CZT HV Monitor | 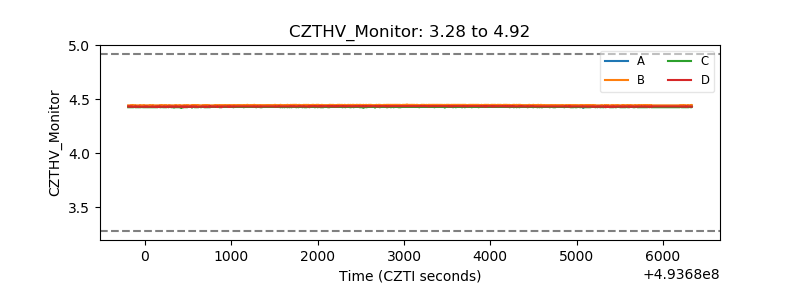 |
| D_VDD | 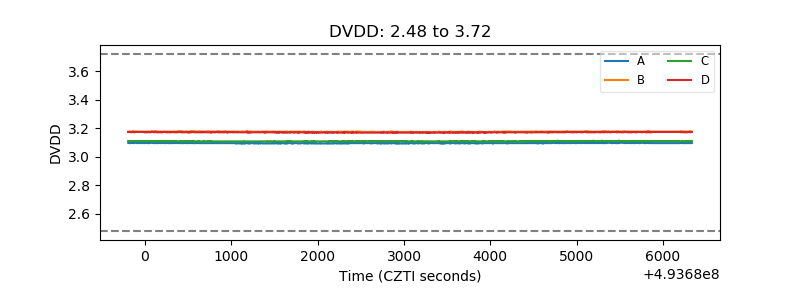 |
| Temperature 1 | 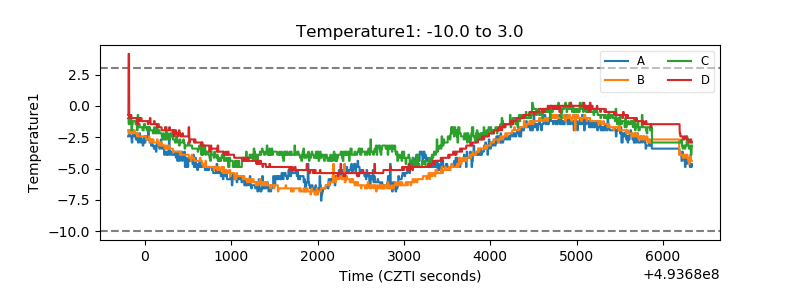 |
| Veto HV Monitor | 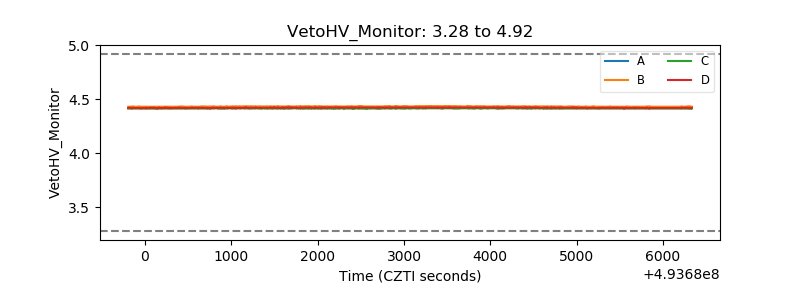 |
| Veto LLD | 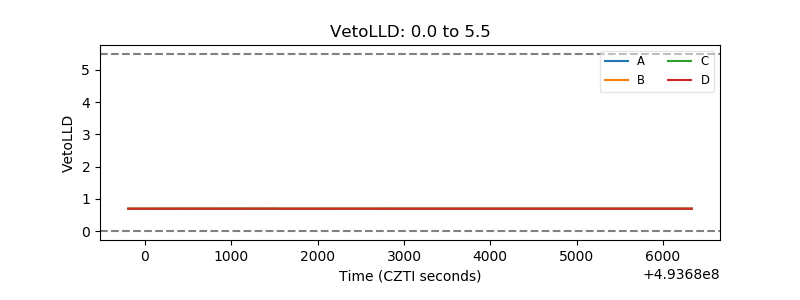 |
| Alpha Counter | 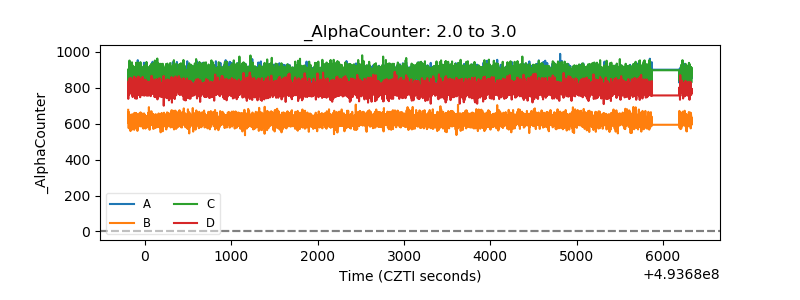 |
| _CPM_Rate | 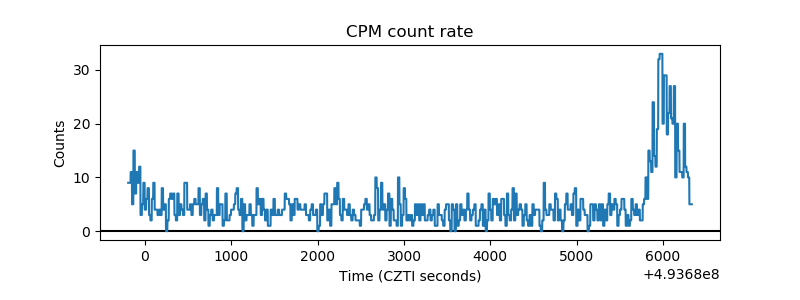 |
| CZT Counter | 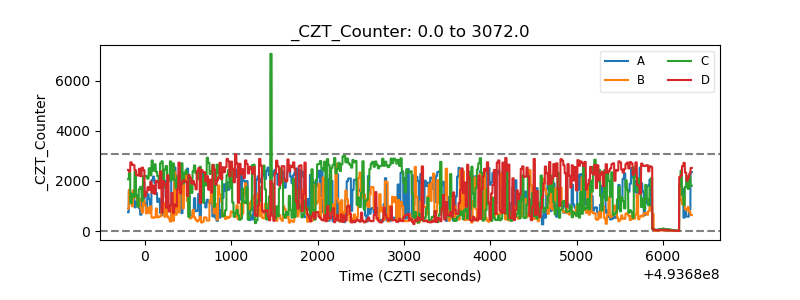 |
| +2.5 Volts monitor |  |
| +5 Volts monitor |  |
| _ROLL_ROT | 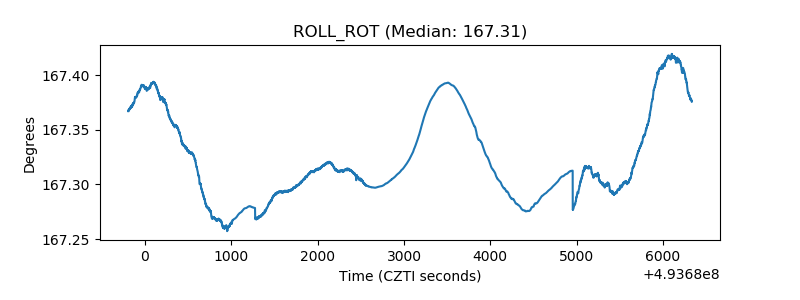 |
| _Roll_DEC | 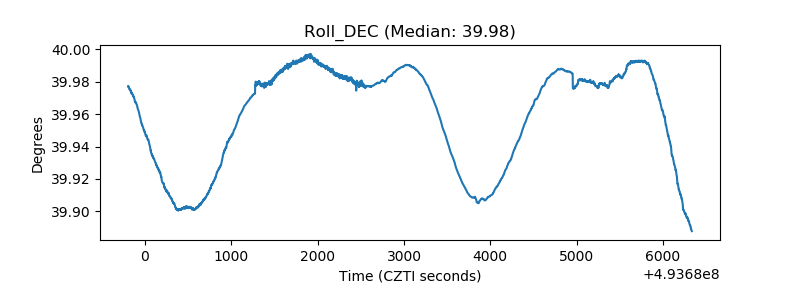 |
| _Roll_RA | 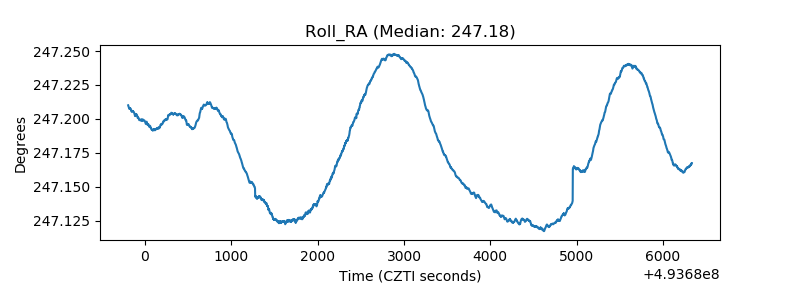 |
| Veto Counter | 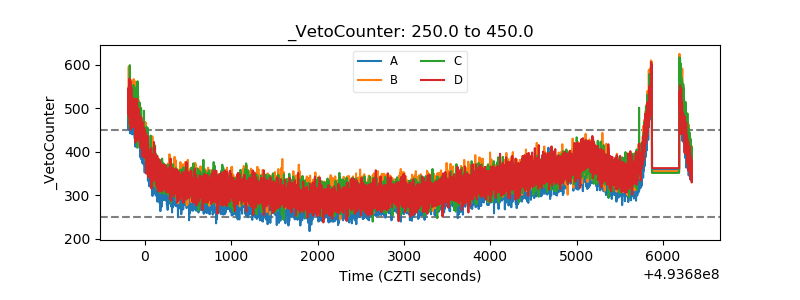 |