| Param | Original file | Final file |
|---|---|---|
| Filename | modeM0/AS1A14_004T05_9000006502_53581cztM0_level2.fits | modeM0/AS1A14_004T05_9000006502_53581cztM0_level2_quad_clean.evt |
| Size (bytes) | 1,560,752,640 | 147,974,400 |
| Size | 1.5 GB | 141.1 MB |
| Events in quadrant A | 8,259,603 | 1,161,530 |
| Events in quadrant B | 14,230,575 | 1,037,491 |
| Events in quadrant C | 10,383,253 | 1,059,725 |
| Events in quadrant D | 23,915,165 | 339,464 |
| Mode M9 | |||
|---|---|---|---|
| Quadrant | BADHDUFLAG | Total packets | Discarded packets |
| A | 0 | 14 | 0 |
| B | 0 | 14 | 0 |
| C | 0 | 14 | 0 |
| D | 0 | 14 | 0 |
| Mode SS | |||
|---|---|---|---|
| Quadrant | BADHDUFLAG | Total packets | Discarded packets |
| A | 0 | 258 | 0 |
| B | 0 | 258 | 0 |
| C | 0 | 258 | 0 |
| D | 0 | 258 | 0 |
| Mode M0 | |||
|---|---|---|---|
| Quadrant | BADHDUFLAG | Total packets | Discarded packets |
| A | 0 | 33491 | 2 |
| B | 0 | 51218 | 2 |
| C | 0 | 39708 | 3 |
| D | 0 | 79830 | 8 |
| Quadrant | Total seconds | Saturated seconds | Saturation percentage |
|---|---|---|---|
| A | 12755 | 546 | 4.280674% |
| B | 12756 | 2761 | 21.644716% |
| C | 12755 | 1152 | 9.031752% |
| D | 12754 | 8922 | 69.954524% |
Noise dominated data is calculated using 1-second bins in cleaned event files. If a bin has >2000 counts, and if more than 50% of those come from <1% of pixels, then it is considered to be noise-dominated and hence unusable.
| Quadrant | # 1 sec bins | Bins with >0 counts | Bins with >2000 counts | High rate bins dominated by noise | Noise dominated (total time) | Noise dominated (detector-on time) | Marked lightcurve |
|---|---|---|---|---|---|---|---|
| A | 14120 | 12757 | 287 | 287 | 2.03% | 2.25% | 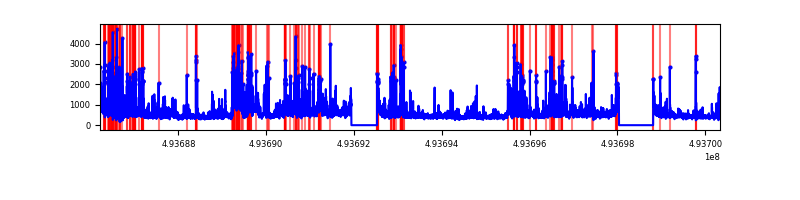 |
| B | 14121 | 12757 | 1798 | 1798 | 12.73% | 14.09% | 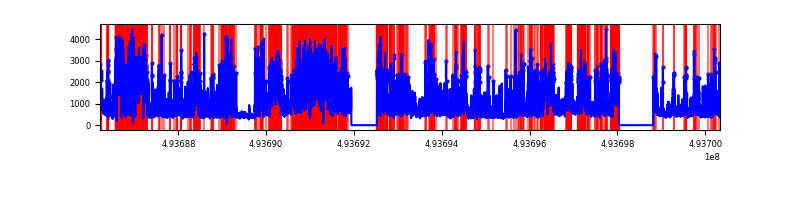 |
| C | 14120 | 12757 | 846 | 846 | 5.99% | 6.63% | 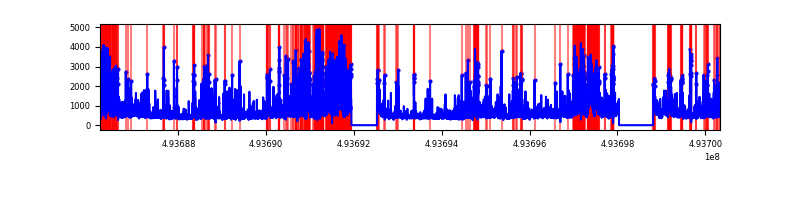 |
| D | 14120 | 12754 | 6360 | 6360 | 45.04% | 49.87% | 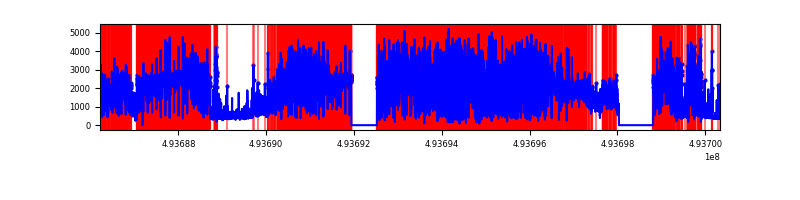 |
Top three noisy pixels from each quadrant. If the there are fewer than three noisy pixels in the level2.evt file, extra rows are filled as -1
| Pixel properties | Quadrant properties | ||||||
|---|---|---|---|---|---|---|---|
| Quadrant | DetID | PixID | Counts | Sigma | Mean | Median | Sigma |
| A | 15 | 174 | 1440868 | 4290.15 | 1351 | 1319 | 335.5 |
| A | 3 | 63 | 490826 | 1458.83 | 1351 | 1319 | 335.5 |
| A | 0 | 8 | 286118 | 848.76 | 1351 | 1319 | 335.5 |
| B | 4 | 206 | 5603325 | 21231.63 | 1239 | 1195 | 263.9 |
| B | 10 | 28 | 1732477 | 6561.42 | 1239 | 1195 | 263.9 |
| B | 2 | 249 | 533461 | 2017.25 | 1239 | 1195 | 263.9 |
| C | 15 | 224 | 3008793 | 8466.53 | 1291 | 1279 | 355.2 |
| C | 1 | 241 | 897141 | 2521.96 | 1291 | 1279 | 355.2 |
| C | 12 | 252 | 296894 | 832.19 | 1291 | 1279 | 355.2 |
| D | 8 | 176 | 20446836 | 120116.35 | 585 | 559 | 170.2 |
| D | 12 | 34 | 238939 | 1400.42 | 585 | 559 | 170.2 |
| D | 7 | 70 | 178326 | 1044.33 | 585 | 559 | 170.2 |
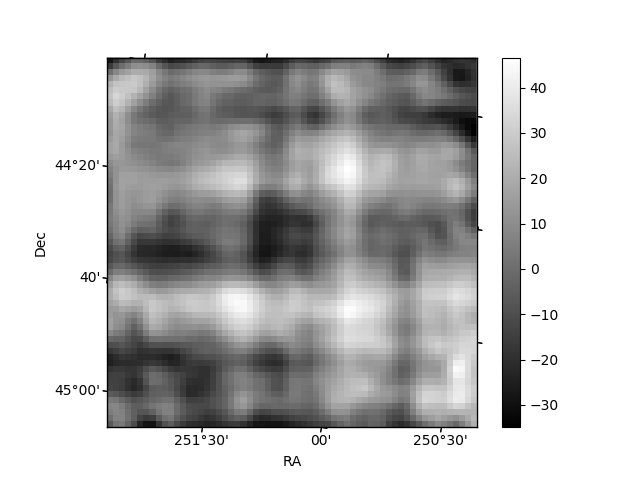
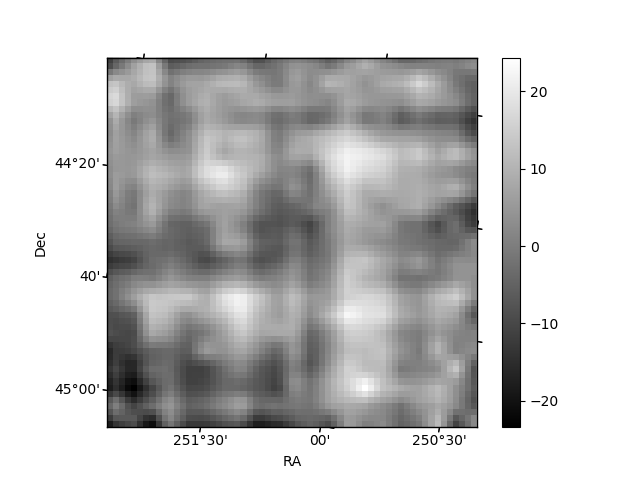
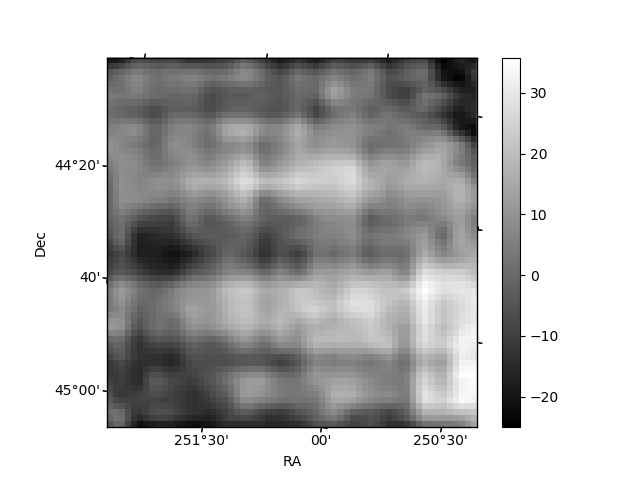
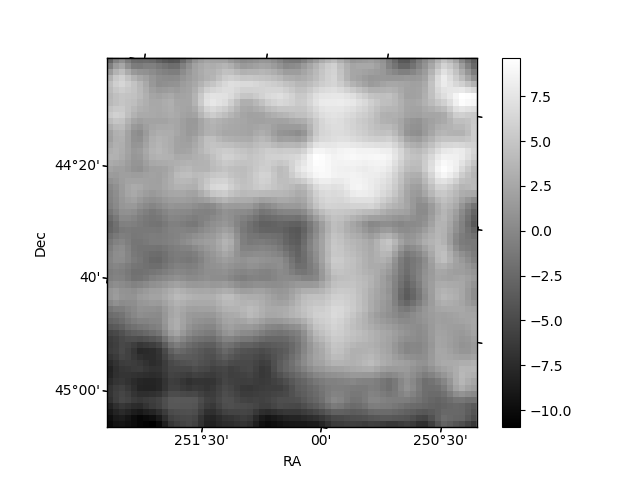
Histogram calculated using DETX and DETY for each event in the final _common_clean file
| Quadrant A | 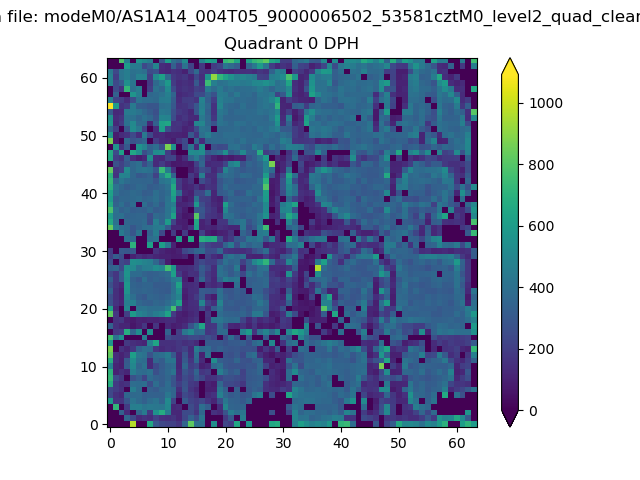 |
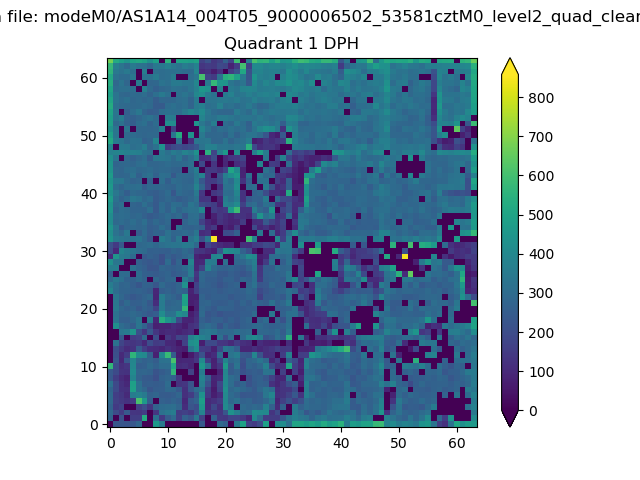 |
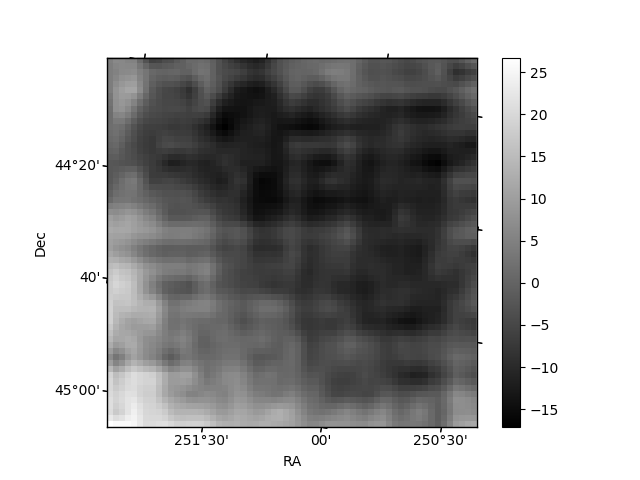
Quadrant B |
|---|---|---|---|
| Quadrant D | 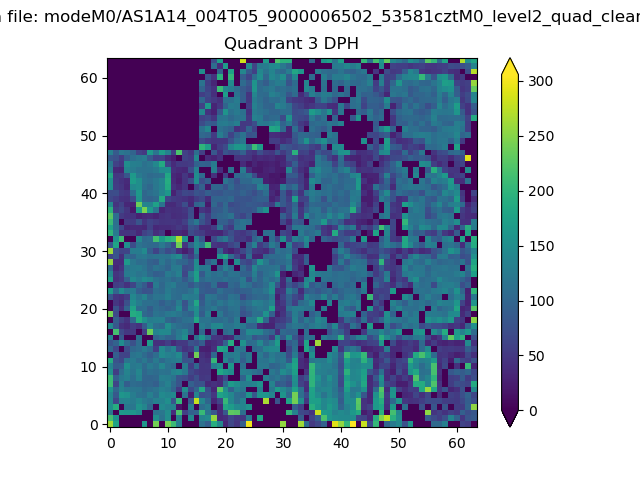 |
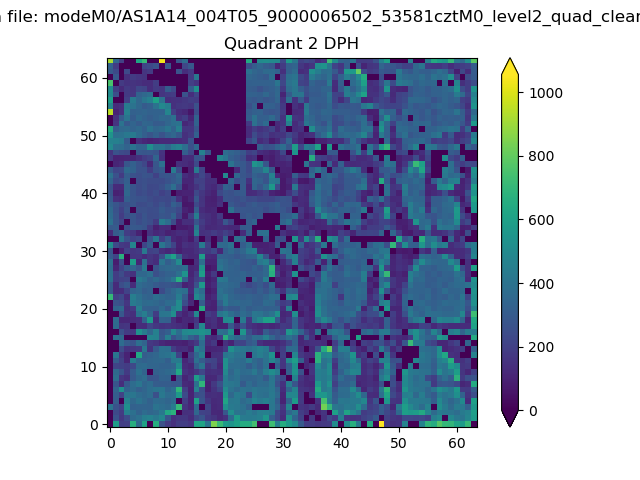 |
Quadrant C |
| Plot type | Count rate plots | Images |
|---|---|---|
| Comparison with Poisson distribution Blue bars denote a histogram of data divided into 1 sec bins. Red curve is a Poisson curve with rate = median count rate of data. |
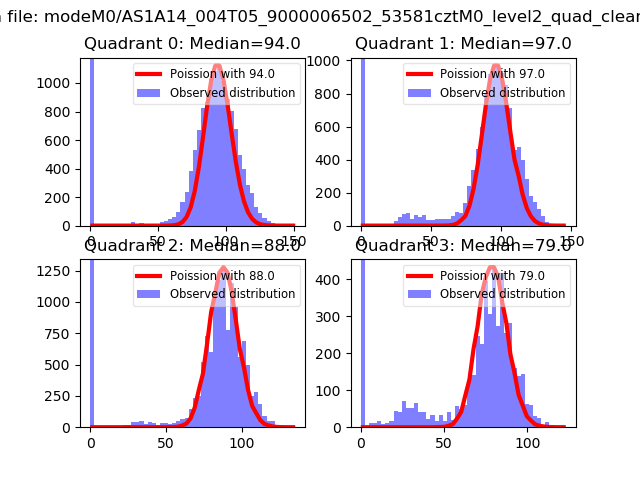 |
 |
| Quadrant-wise count rates Data is divided into 100 sec bins |
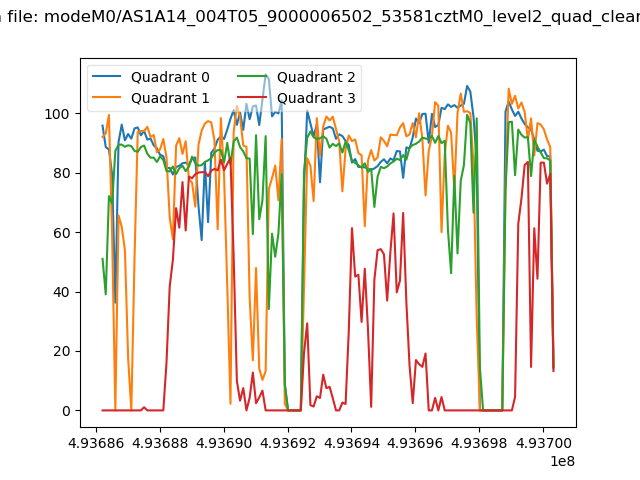 |
|
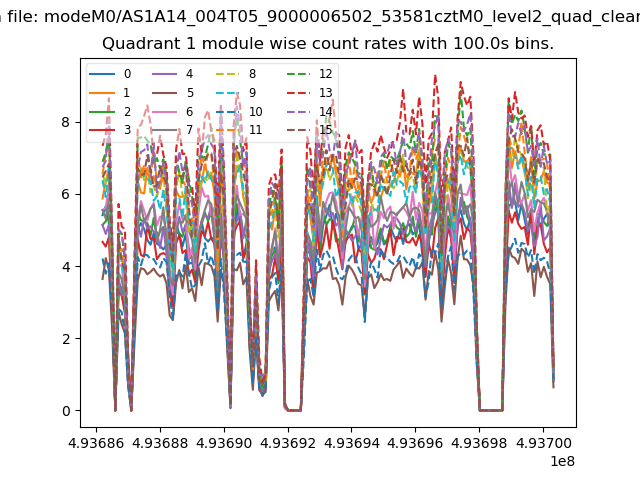
| Module-wise count rates for Quadrant A Data is divided into 100 sec bins |
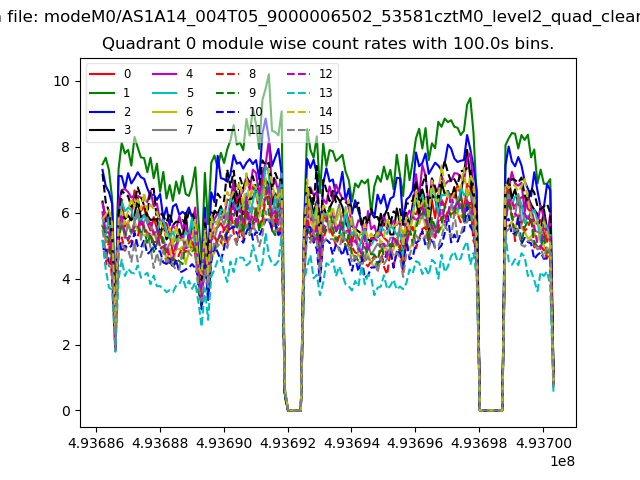 |
 |
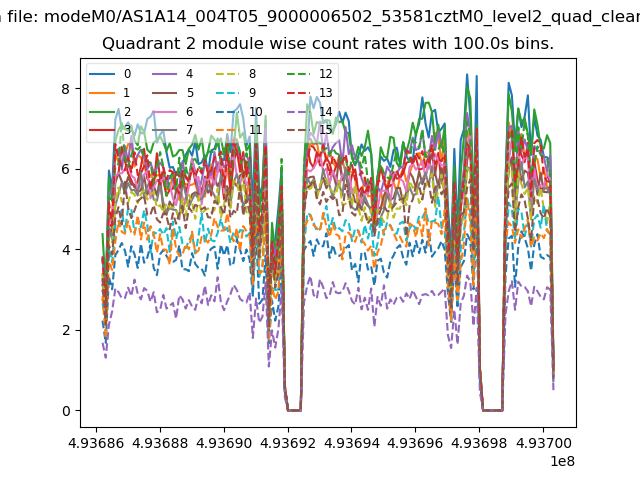
| Module-wise count rates for Quadrant B Data is divided into 100 sec bins |
 |
 |
| Module-wise count rates for Quadrant C Data is divided into 100 sec bins |
 |
 |
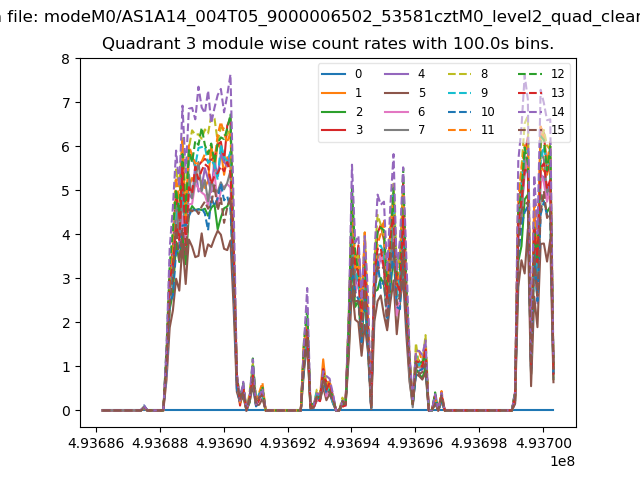
| Module-wise count rates for Quadrant D Data is divided into 100 sec bins |
 |
 |
| Parameter | Plot |
|---|---|
| CZT HV Monitor | 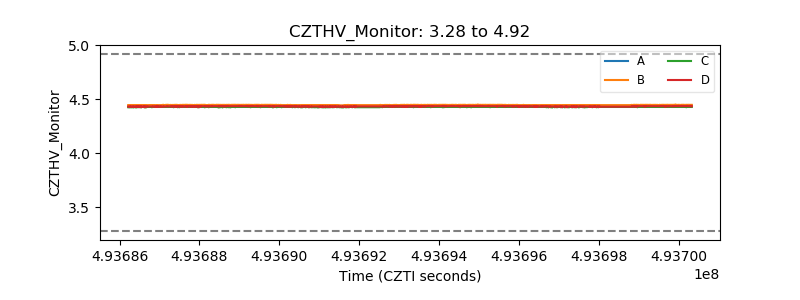 |
| D_VDD | 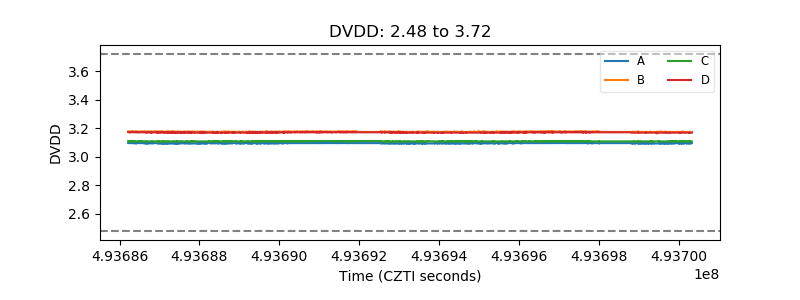 |
| Temperature 1 | 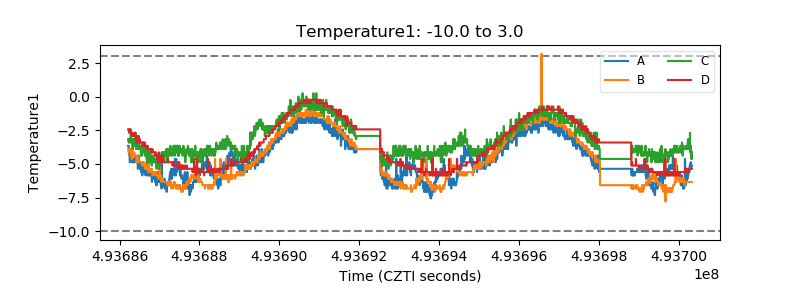 |
| Veto HV Monitor | 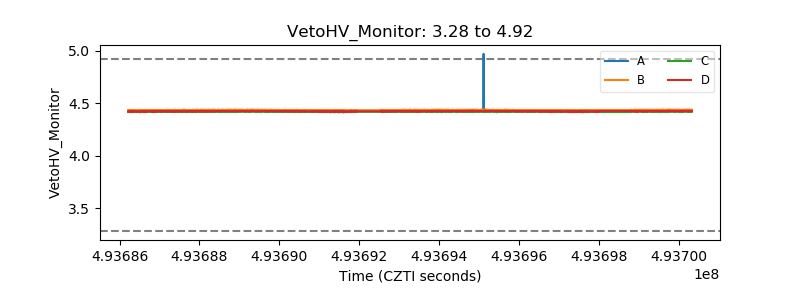 |
| Veto LLD | 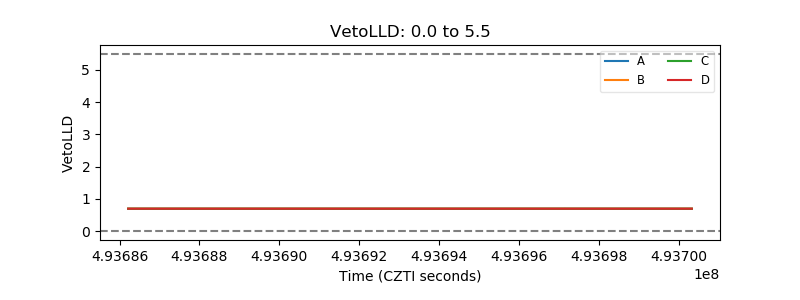 |
| Alpha Counter | 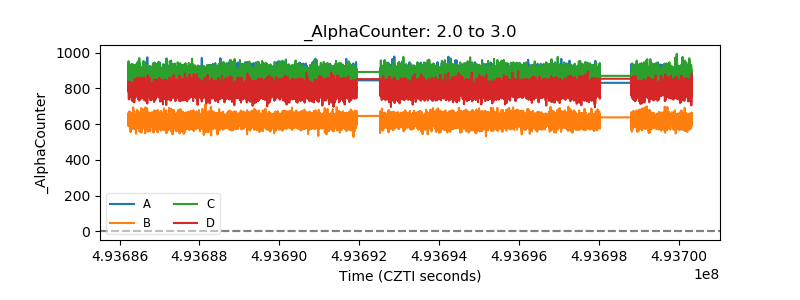 |
| _CPM_Rate | 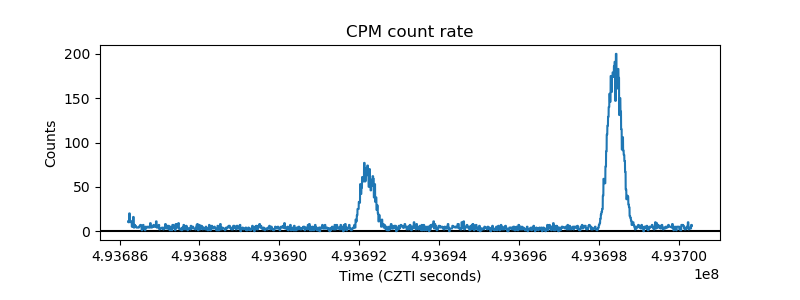 |
| CZT Counter | 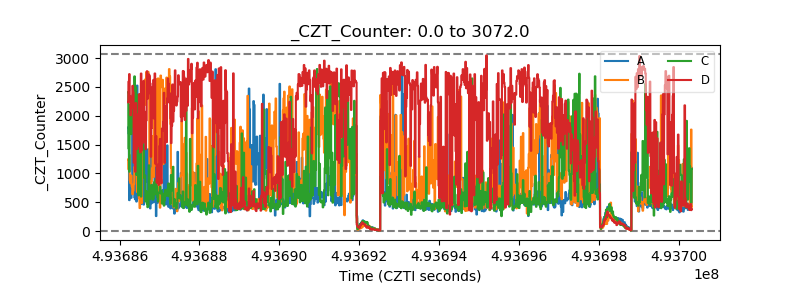 |
| +2.5 Volts monitor |  |
| +5 Volts monitor |  |
| _ROLL_ROT | 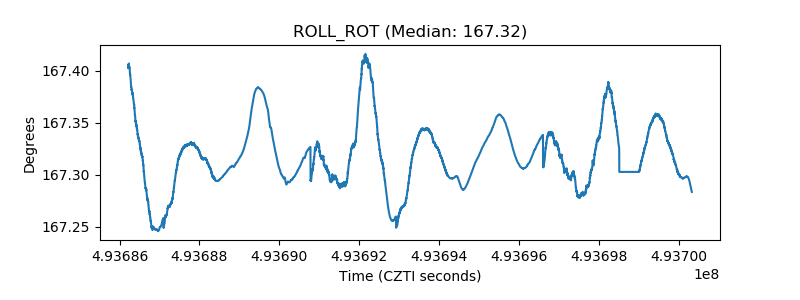 |
| _Roll_DEC | 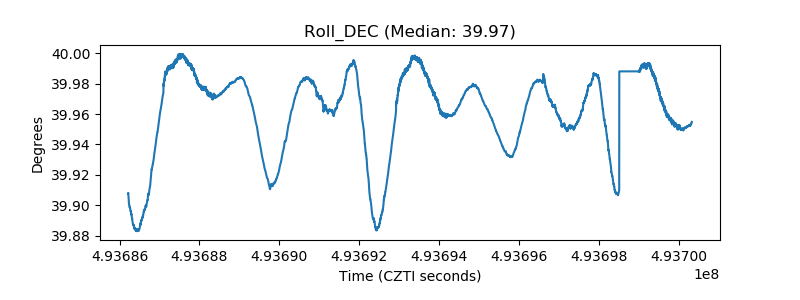 |
| _Roll_RA | 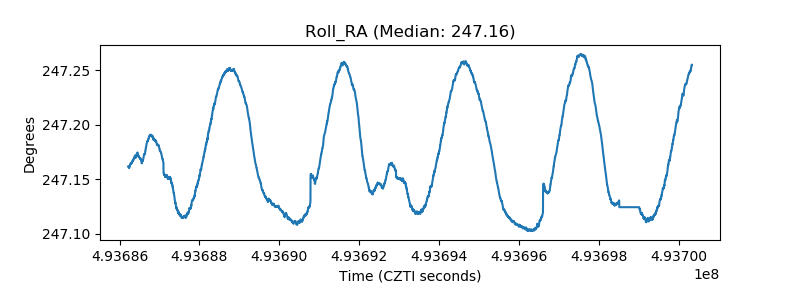 |
| Veto Counter | 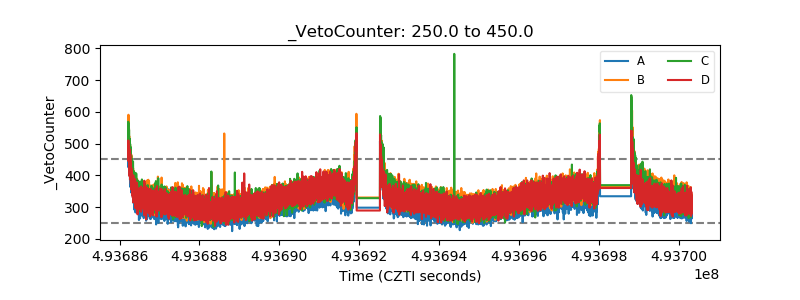 |