| Param | Original file | Final file |
|---|---|---|
| Filename | modeM0/AS1A14_004T05_9000006502_53582cztM0_level2.fits | modeM0/AS1A14_004T05_9000006502_53582cztM0_level2_quad_clean.evt |
| Size (bytes) | 742,374,720 | 88,018,560 |
| Size | 708.0 MB | 83.9 MB |
| Events in quadrant A | 4,518,267 | 642,398 |
| Events in quadrant B | 7,323,762 | 601,411 |
| Events in quadrant C | 5,066,427 | 616,492 |
| Events in quadrant D | 10,036,120 | 323,550 |
| Mode M9 | |||
|---|---|---|---|
| Quadrant | BADHDUFLAG | Total packets | Discarded packets |
| A | 0 | 18 | 0 |
| B | 0 | 18 | 0 |
| C | 0 | 18 | 0 |
| D | 0 | 18 | 0 |
| Mode SS | |||
|---|---|---|---|
| Quadrant | BADHDUFLAG | Total packets | Discarded packets |
| A | 0 | 140 | 0 |
| B | 0 | 140 | 0 |
| C | 0 | 140 | 0 |
| D | 0 | 140 | 0 |
| Mode M0 | |||
|---|---|---|---|
| Quadrant | BADHDUFLAG | Total packets | Discarded packets |
| A | 0 | 18259 | 2 |
| B | 0 | 26511 | 2 |
| C | 0 | 19887 | 2 |
| D | 0 | 34670 | 2 |
| Quadrant | Total seconds | Saturated seconds | Saturation percentage |
|---|---|---|---|
| A | 6912 | 355 | 5.135995% |
| B | 6913 | 1329 | 19.224649% |
| C | 6912 | 358 | 5.179398% |
| D | 6912 | 3162 | 45.746528% |
Noise dominated data is calculated using 1-second bins in cleaned event files. If a bin has >2000 counts, and if more than 50% of those come from <1% of pixels, then it is considered to be noise-dominated and hence unusable.
| Quadrant | # 1 sec bins | Bins with >0 counts | Bins with >2000 counts | High rate bins dominated by noise | Noise dominated (total time) | Noise dominated (detector-on time) | Marked lightcurve |
|---|---|---|---|---|---|---|---|
| A | 8627 | 6914 | 188 | 188 | 2.18% | 2.72% | 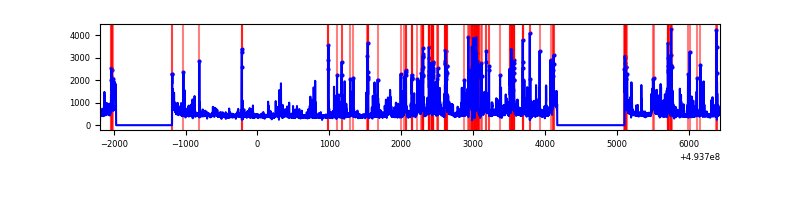 |
| B | 8628 | 6914 | 775 | 775 | 8.98% | 11.21% | 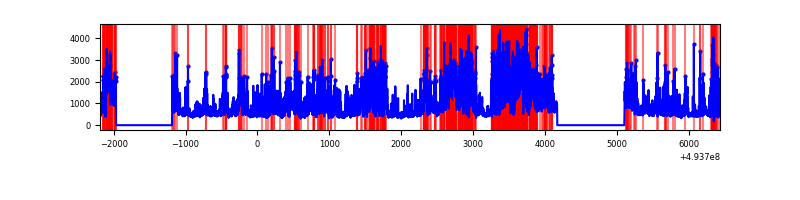 |
| C | 8627 | 6914 | 246 | 246 | 2.85% | 3.56% | 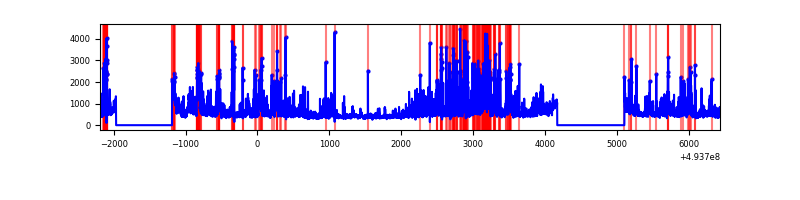 |
| D | 8627 | 6912 | 2399 | 2399 | 27.81% | 34.71% | 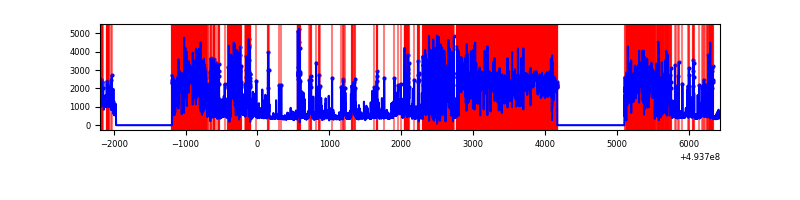 |
Top three noisy pixels from each quadrant. If the there are fewer than three noisy pixels in the level2.evt file, extra rows are filled as -1
| Pixel properties | Quadrant properties | ||||||
|---|---|---|---|---|---|---|---|
| Quadrant | DetID | PixID | Counts | Sigma | Mean | Median | Sigma |
| A | 15 | 174 | 678436 | 3624.86 | 751 | 732 | 187.0 |
| A | 3 | 62 | 426478 | 2277.2 | 751 | 732 | 187.0 |
| A | 4 | 239 | 230986 | 1231.57 | 751 | 732 | 187.0 |
| B | 4 | 206 | 2828835 | 18732.04 | 704 | 680 | 151.0 |
| B | 10 | 28 | 818457 | 5416.47 | 704 | 680 | 151.0 |
| B | 2 | 249 | 382889 | 2531.53 | 704 | 680 | 151.0 |
| C | 15 | 224 | 1163562 | 5795.77 | 734 | 730 | 200.6 |
| C | 1 | 241 | 395403 | 1967.12 | 734 | 730 | 200.6 |
| C | 15 | 178 | 184488 | 915.88 | 734 | 730 | 200.6 |
| D | 8 | 176 | 6977736 | 52332.79 | 455 | 433 | 133.3 |
| D | 12 | 3 | 505603 | 3788.99 | 455 | 433 | 133.3 |
| D | 12 | 1 | 179866 | 1345.83 | 455 | 433 | 133.3 |
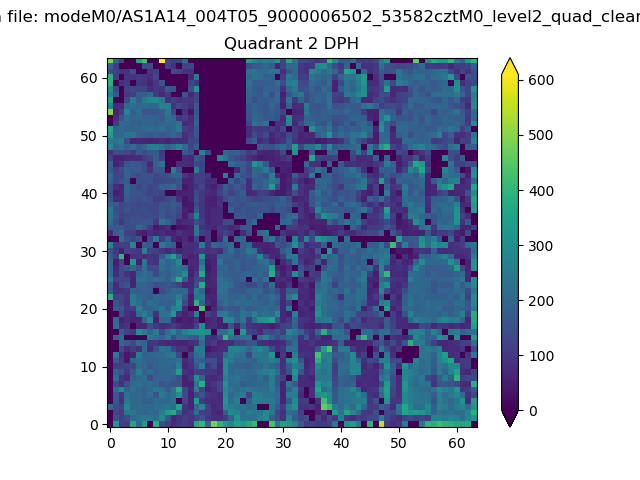
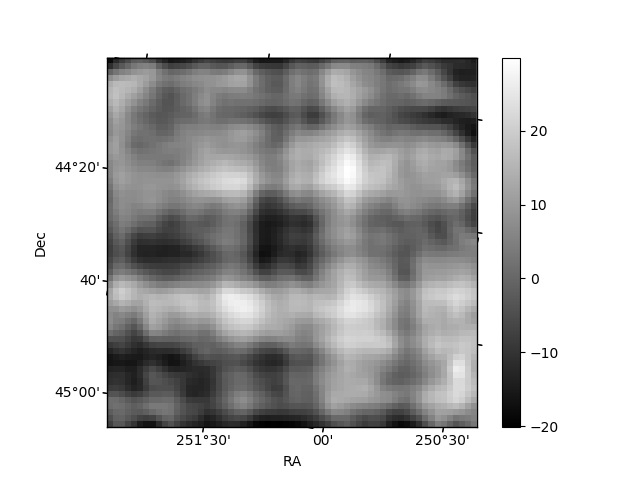
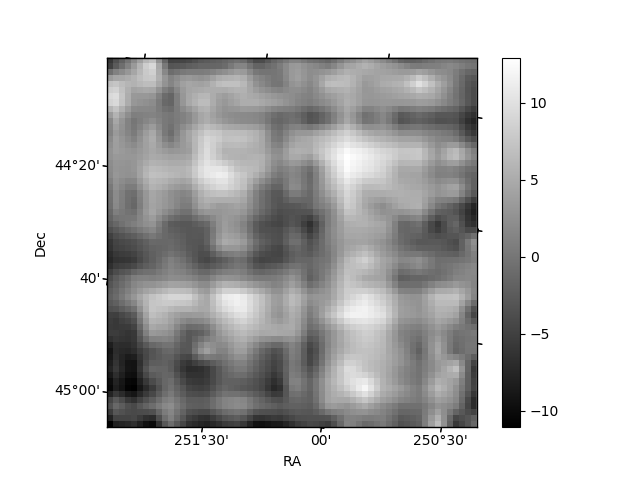
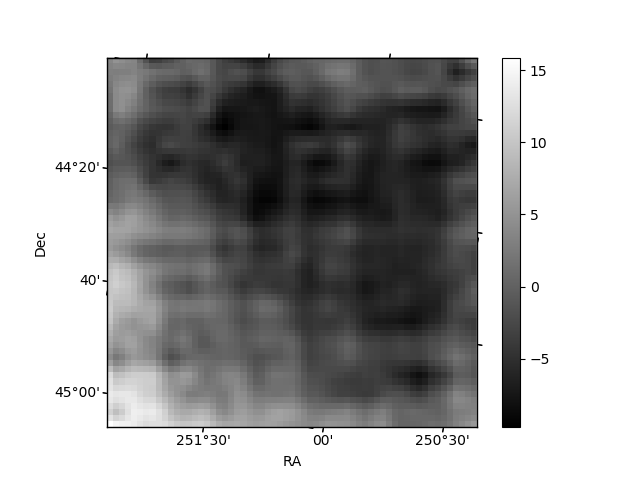
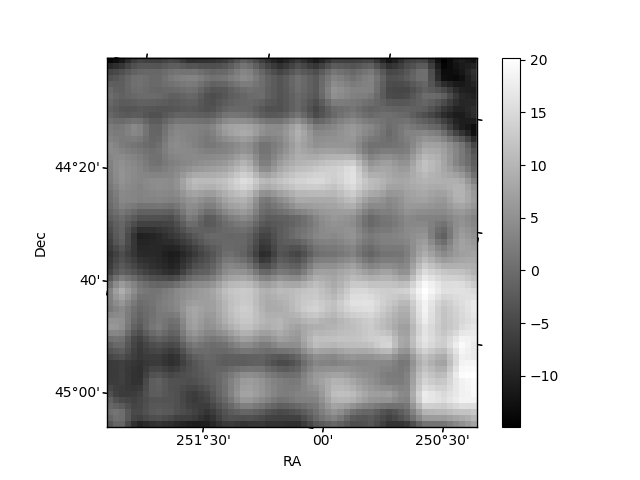
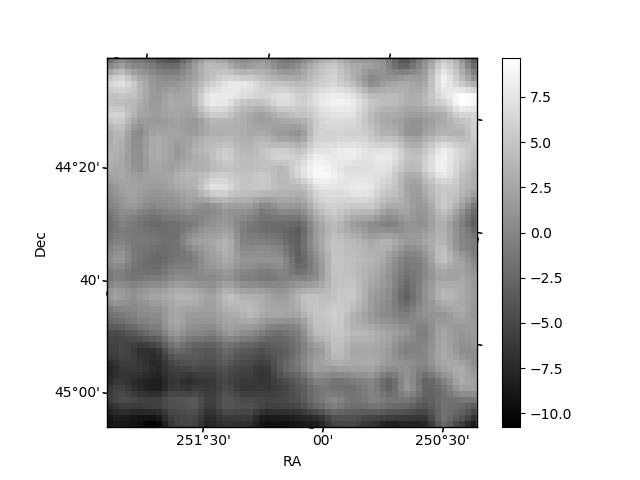
Histogram calculated using DETX and DETY for each event in the final _common_clean file
| Quadrant A | 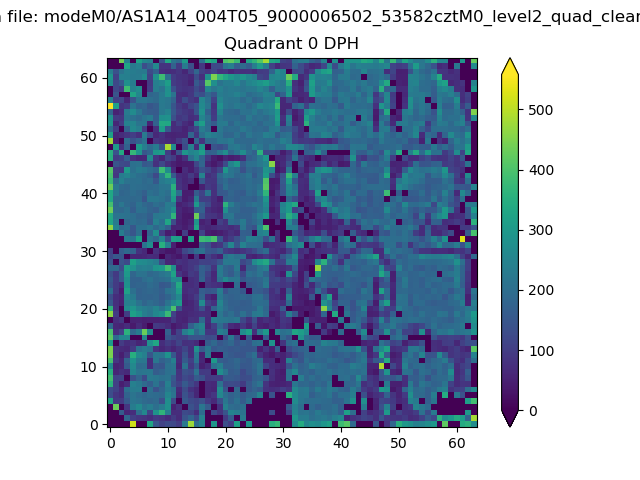 |
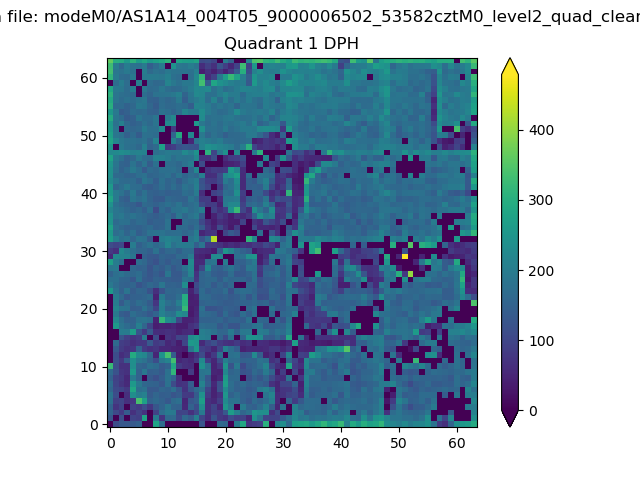 |
Quadrant B |
|---|---|---|---|
| Quadrant D | 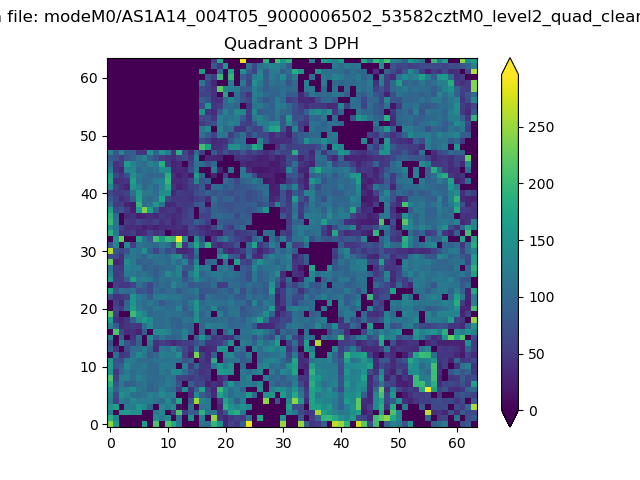 |
 |
Quadrant C |
| Plot type | Count rate plots | Images |
|---|---|---|
| Comparison with Poisson distribution Blue bars denote a histogram of data divided into 1 sec bins. Red curve is a Poisson curve with rate = median count rate of data. |
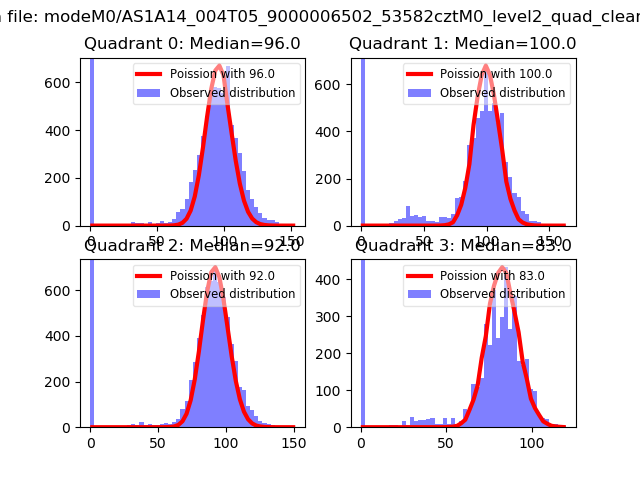 |
 |
| Quadrant-wise count rates Data is divided into 100 sec bins |
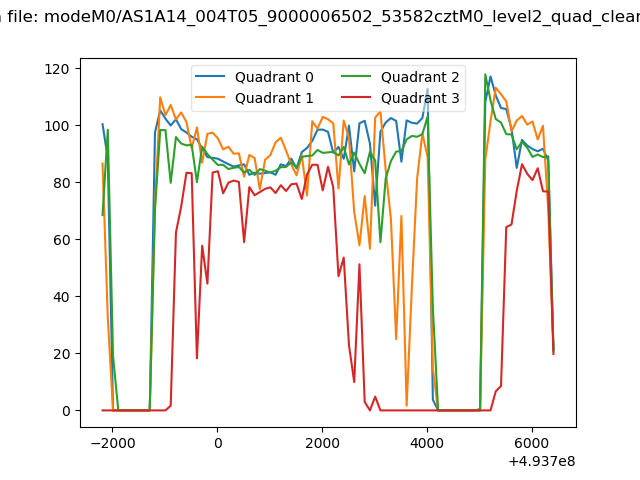 |
|
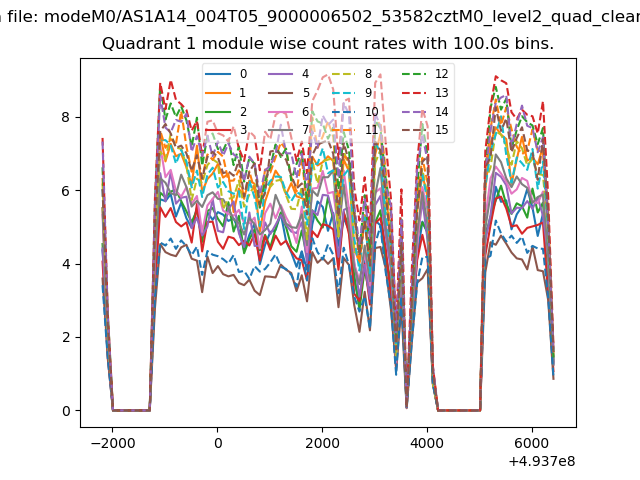
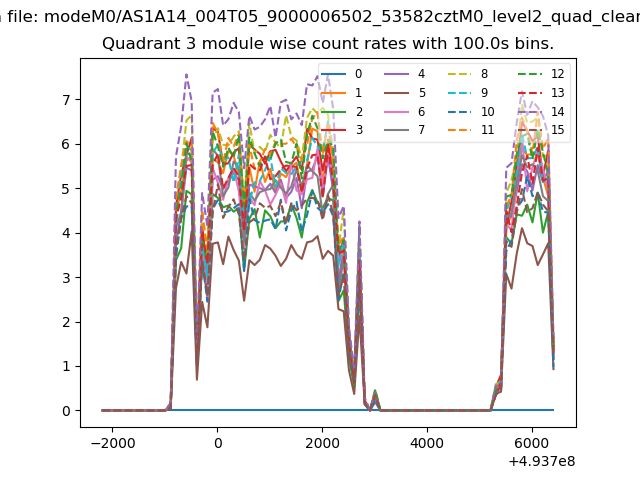
| Module-wise count rates for Quadrant A Data is divided into 100 sec bins |
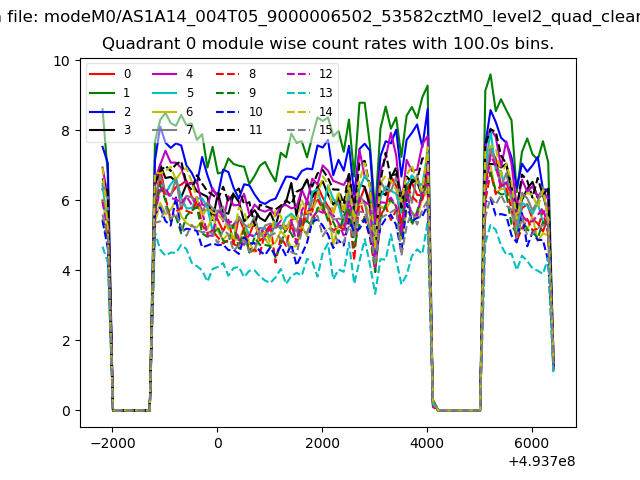 |
 |
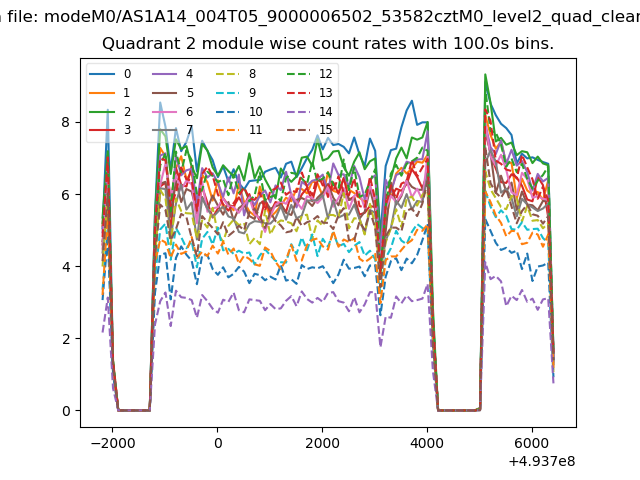
| Module-wise count rates for Quadrant B Data is divided into 100 sec bins |
 |
 |
| Module-wise count rates for Quadrant C Data is divided into 100 sec bins |
 |
 |
| Module-wise count rates for Quadrant D Data is divided into 100 sec bins |
 |
 |
| Parameter | Plot |
|---|---|
| CZT HV Monitor | 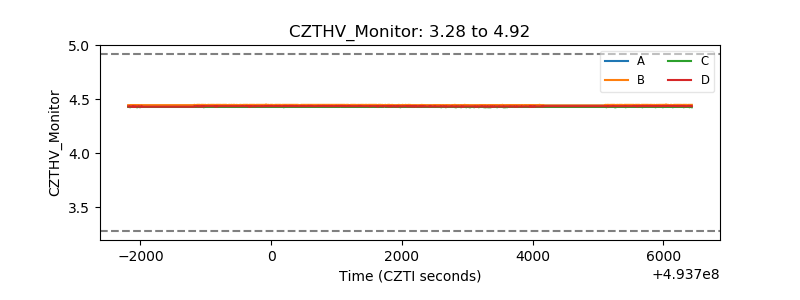 |
| D_VDD | 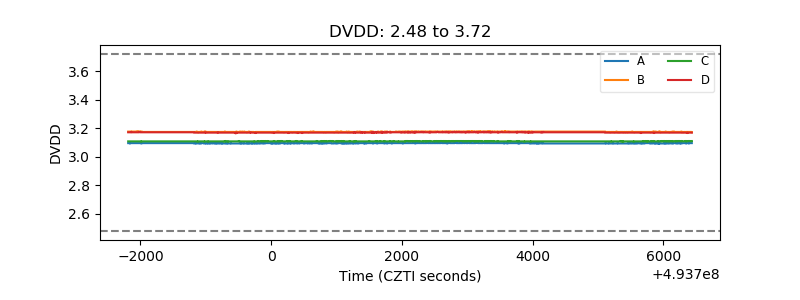 |
| Temperature 1 | 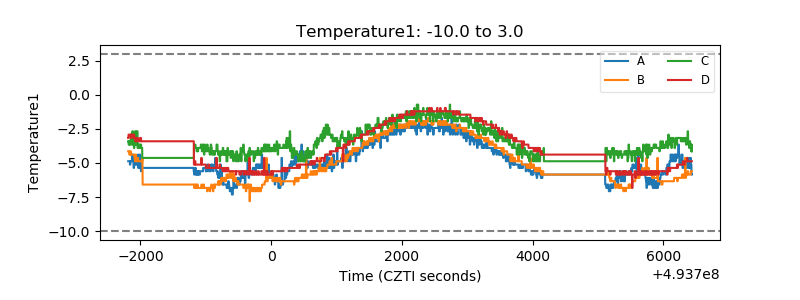 |
| Veto HV Monitor | 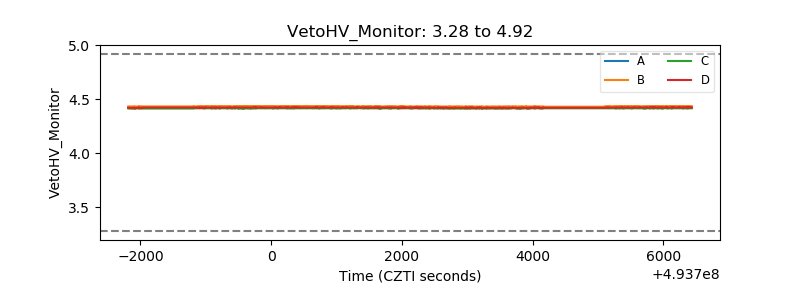 |
| Veto LLD | 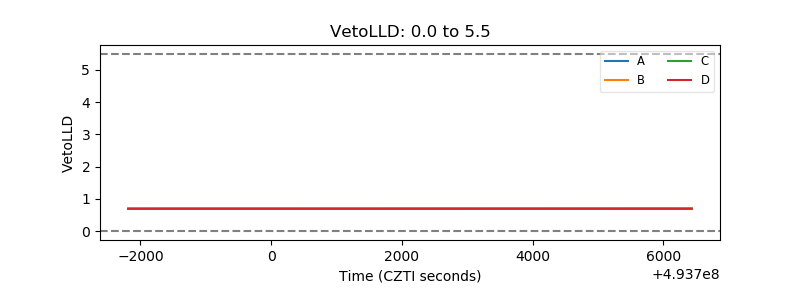 |
| Alpha Counter | 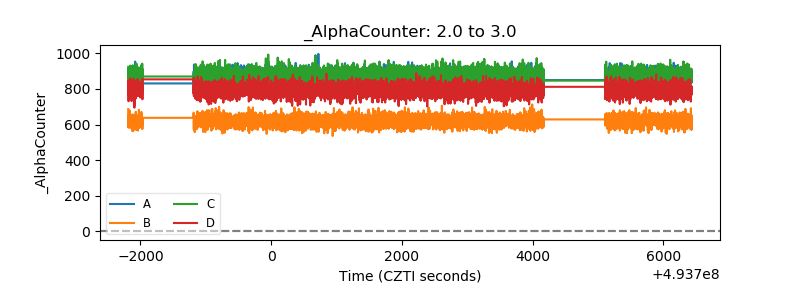 |
| _CPM_Rate | 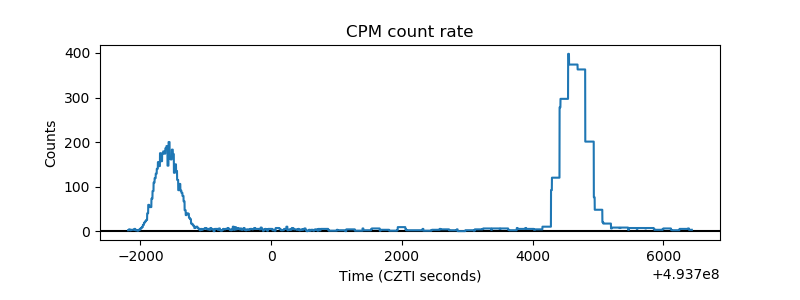 |
| CZT Counter | 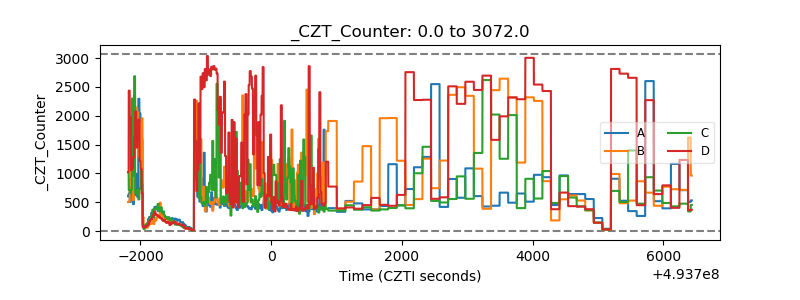 |
| +2.5 Volts monitor |  |
| +5 Volts monitor |  |
| _ROLL_ROT | 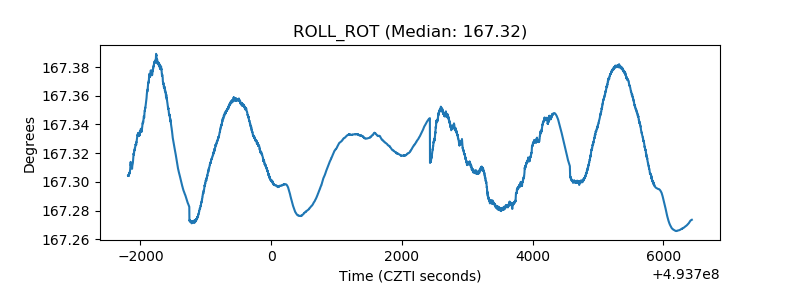 |
| _Roll_DEC | 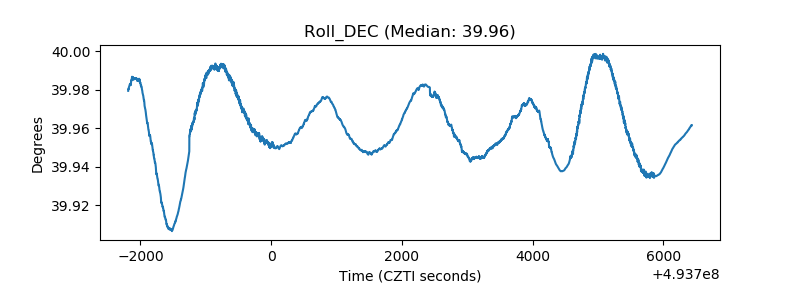 |
| _Roll_RA | 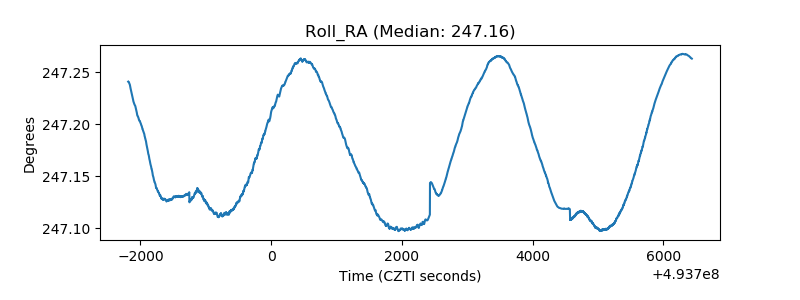 |
| Veto Counter | 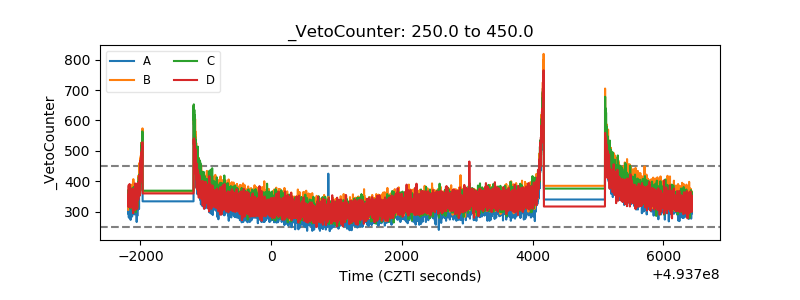 |