| Param | Original file | Final file |
|---|---|---|
| Filename | modeM0/AS1A14_004T05_9000006502_53584cztM0_level2.fits | modeM0/AS1A14_004T05_9000006502_53584cztM0_level2_quad_clean.evt |
| Size (bytes) | 730,163,520 | 83,943,360 |
| Size | 696.3 MB | 80.1 MB |
| Events in quadrant A | 6,026,722 | 571,145 |
| Events in quadrant B | 7,145,445 | 600,733 |
| Events in quadrant C | 5,658,266 | 572,516 |
| Events in quadrant D | 7,690,956 | 341,207 |
| Mode M9 | |||
|---|---|---|---|
| Quadrant | BADHDUFLAG | Total packets | Discarded packets |
| A | 0 | 17 | 0 |
| B | 0 | 17 | 0 |
| C | 0 | 18 | 0 |
| D | 0 | 18 | 0 |
| Mode SS | |||
|---|---|---|---|
| Quadrant | BADHDUFLAG | Total packets | Discarded packets |
| A | 0 | 132 | 0 |
| B | 0 | 132 | 0 |
| C | 0 | 132 | 0 |
| D | 0 | 132 | 0 |
| Mode M0 | |||
|---|---|---|---|
| Quadrant | BADHDUFLAG | Total packets | Discarded packets |
| A | 0 | 22300 | 2 |
| B | 0 | 25742 | 2 |
| C | 0 | 21336 | 6 |
| D | 0 | 27481 | 2 |
| Quadrant | Total seconds | Saturated seconds | Saturation percentage |
|---|---|---|---|
| A | 6538 | 959 | 14.668094% |
| B | 6538 | 1198 | 18.323646% |
| C | 6537 | 628 | 9.606853% |
| D | 6537 | 2732 | 41.792871% |
Noise dominated data is calculated using 1-second bins in cleaned event files. If a bin has >2000 counts, and if more than 50% of those come from <1% of pixels, then it is considered to be noise-dominated and hence unusable.
| Quadrant | # 1 sec bins | Bins with >0 counts | Bins with >2000 counts | High rate bins dominated by noise | Noise dominated (total time) | Noise dominated (detector-on time) | Marked lightcurve |
|---|---|---|---|---|---|---|---|
| A | 7608 | 6538 | 702 | 702 | 9.23% | 10.74% | 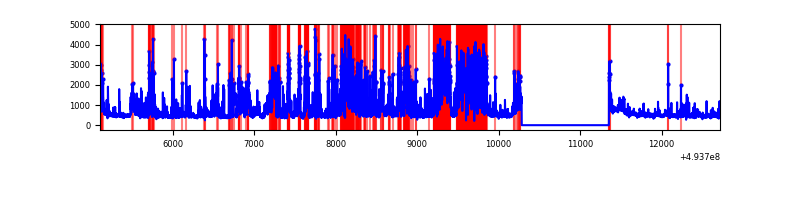 |
| B | 7608 | 6538 | 708 | 708 | 9.31% | 10.83% | 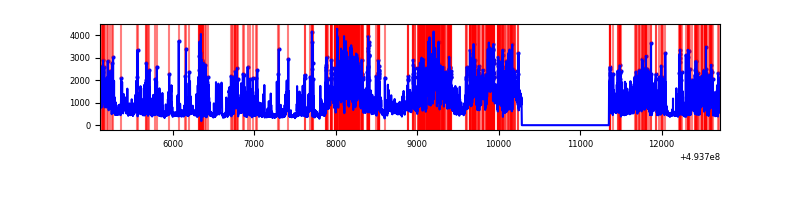 |
| C | 7607 | 6538 | 472 | 472 | 6.20% | 7.22% | 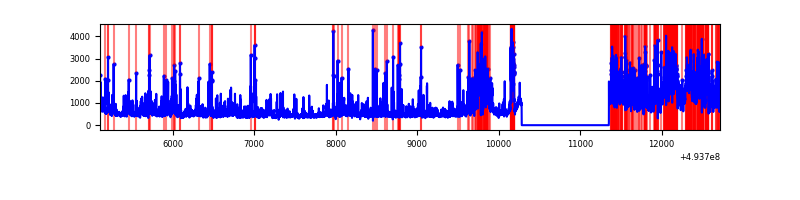 |
| D | 7607 | 6537 | 1436 | 1436 | 18.88% | 21.97% | 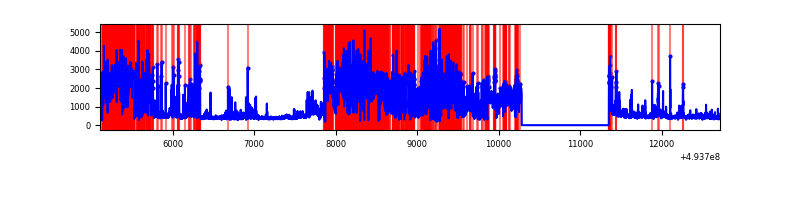 |
Top three noisy pixels from each quadrant. If the there are fewer than three noisy pixels in the level2.evt file, extra rows are filled as -1
| Pixel properties | Quadrant properties | ||||||
|---|---|---|---|---|---|---|---|
| Quadrant | DetID | PixID | Counts | Sigma | Mean | Median | Sigma |
| A | 3 | 62 | 1433857 | 8456.4 | 687 | 669 | 169.5 |
| A | 15 | 174 | 1381282 | 8146.19 | 687 | 669 | 169.5 |
| A | 0 | 8 | 191000 | 1123.03 | 687 | 669 | 169.5 |
| B | 4 | 206 | 3328953 | 22415.84 | 684 | 660 | 148.5 |
| B | 10 | 28 | 458546 | 3083.83 | 684 | 660 | 148.5 |
| B | 2 | 249 | 162011 | 1086.69 | 684 | 660 | 148.5 |
| C | 13 | 3 | 1401830 | 7474.08 | 683 | 679 | 187.5 |
| C | 15 | 224 | 746905 | 3980.55 | 683 | 679 | 187.5 |
| C | 10 | 22 | 207063 | 1100.9 | 683 | 679 | 187.5 |
| D | 8 | 176 | 4642149 | 35485.26 | 454 | 434 | 130.8 |
| D | 12 | 1 | 570771 | 4360.15 | 454 | 434 | 130.8 |
| D | 12 | 3 | 244647 | 1866.97 | 454 | 434 | 130.8 |
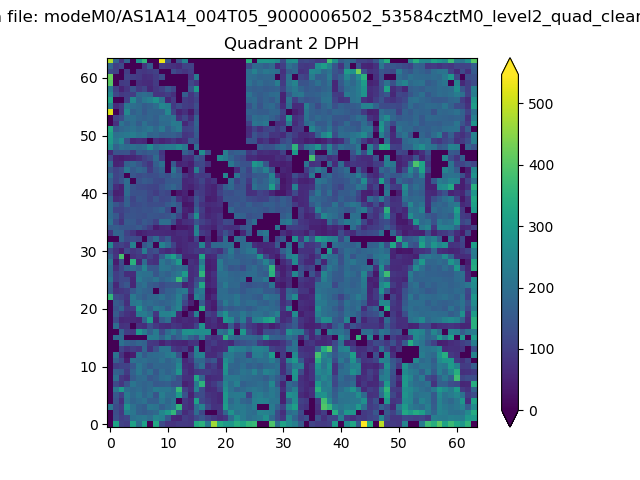
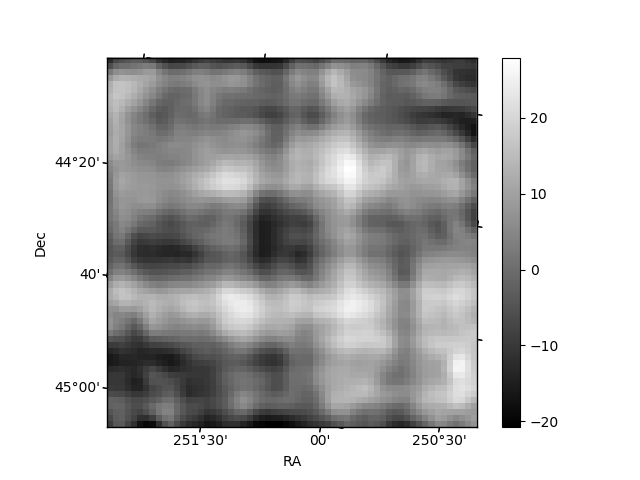
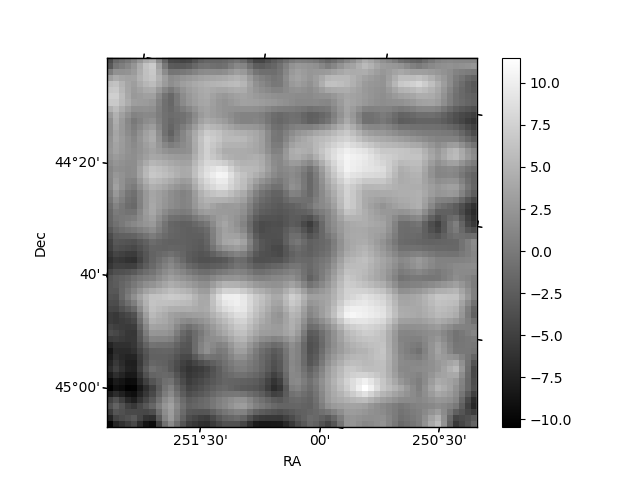
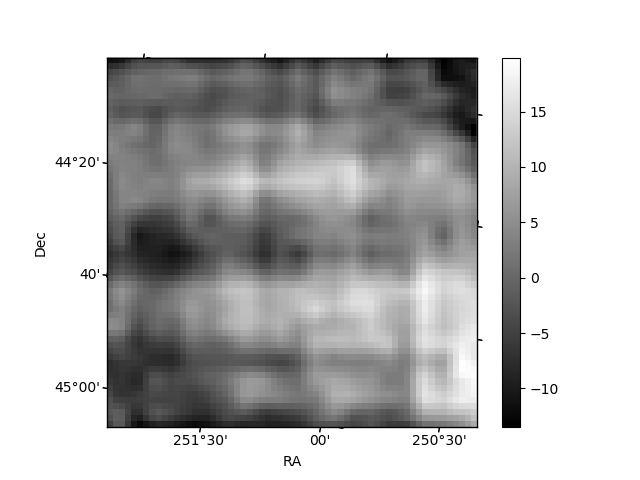
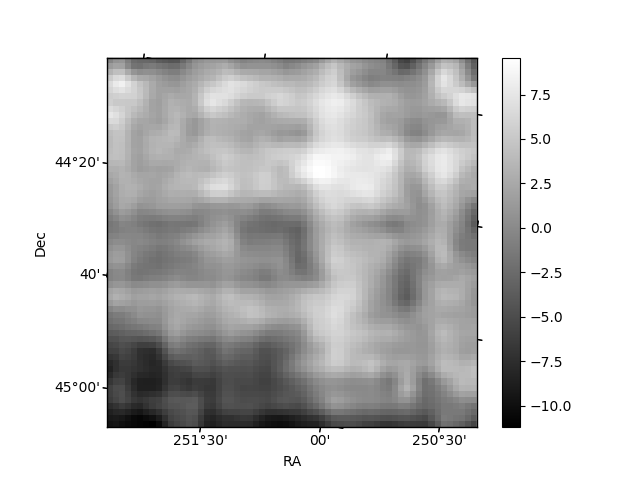
Histogram calculated using DETX and DETY for each event in the final _common_clean file
| Quadrant A | 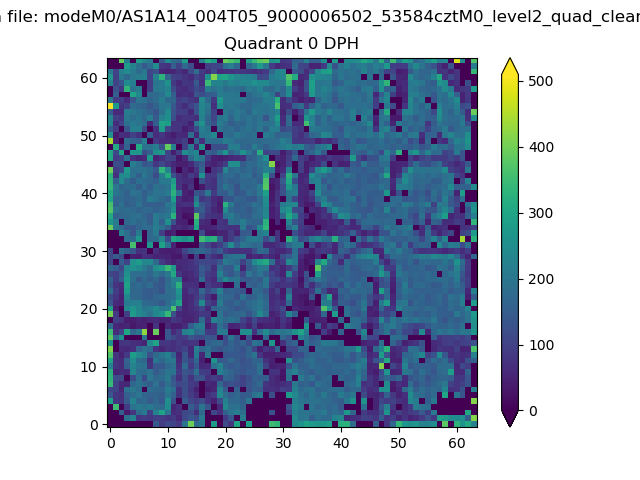 |
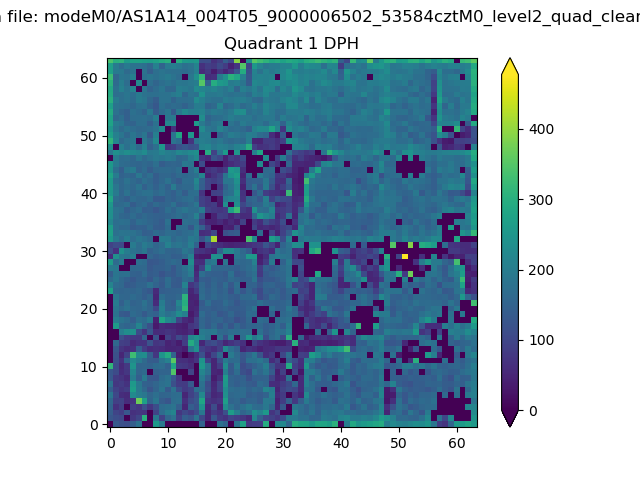 |
Quadrant B |
|---|---|---|---|
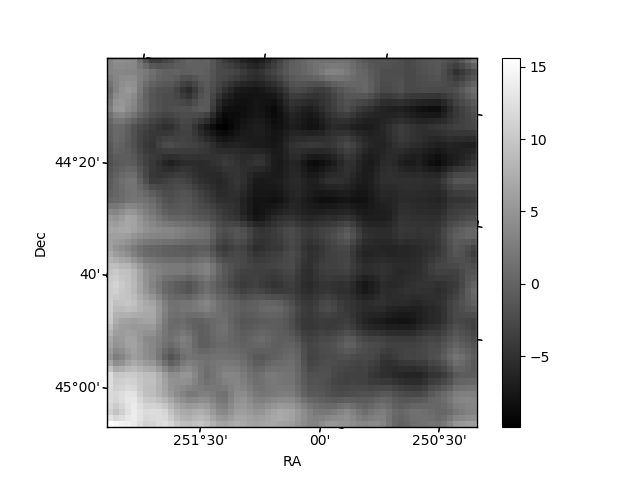
| Quadrant D | 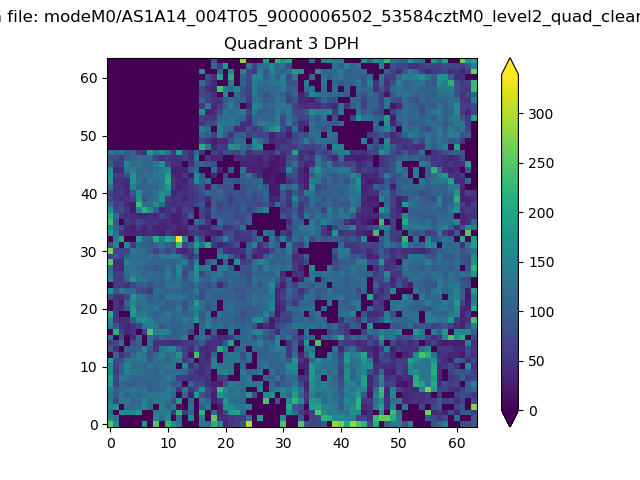 |
 |
Quadrant C |
| Plot type | Count rate plots | Images |
|---|---|---|
| Comparison with Poisson distribution Blue bars denote a histogram of data divided into 1 sec bins. Red curve is a Poisson curve with rate = median count rate of data. |
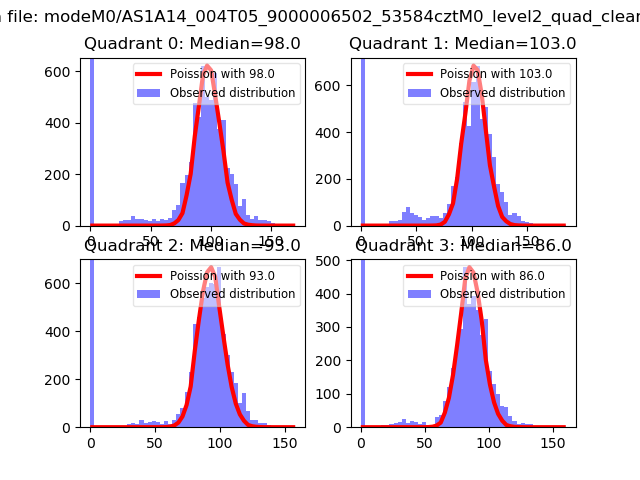 |
 |
| Quadrant-wise count rates Data is divided into 100 sec bins |
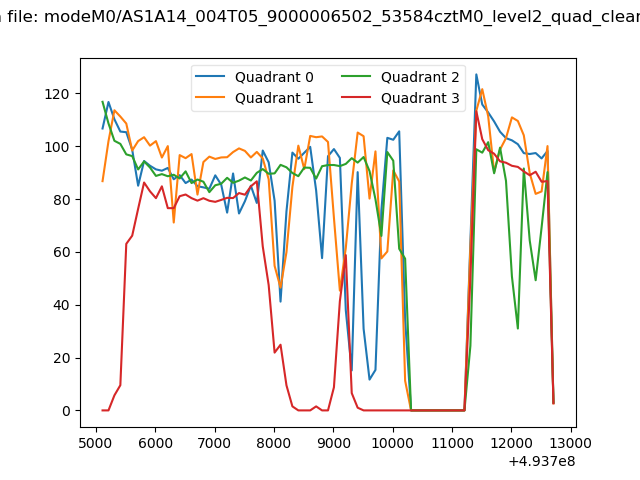 |
|
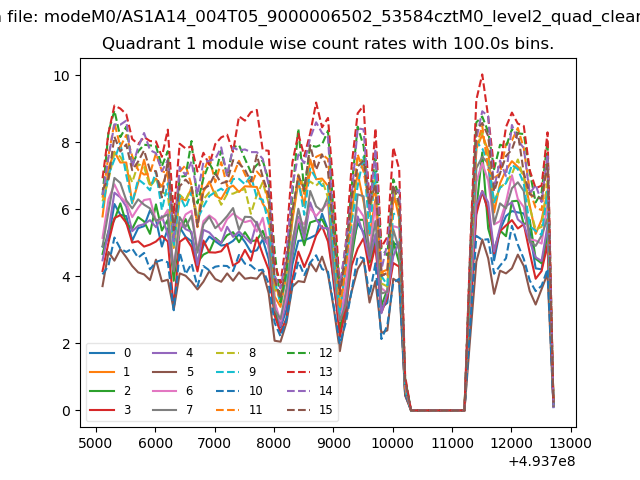
| Module-wise count rates for Quadrant A Data is divided into 100 sec bins |
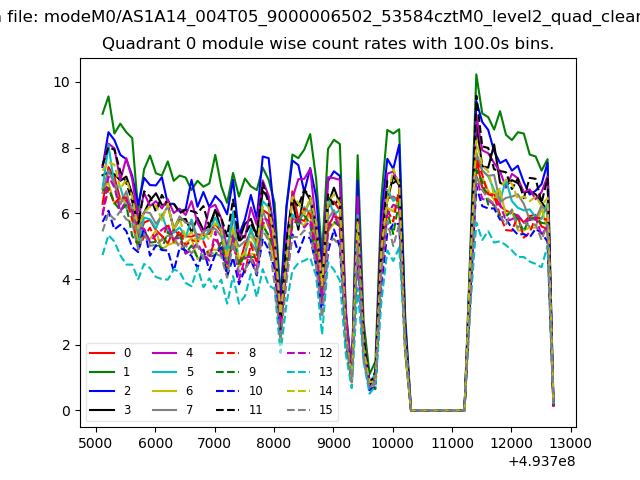 |
 |
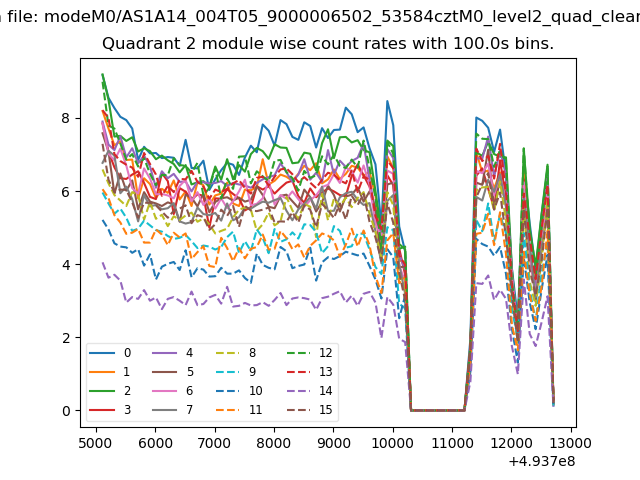
| Module-wise count rates for Quadrant B Data is divided into 100 sec bins |
 |
 |
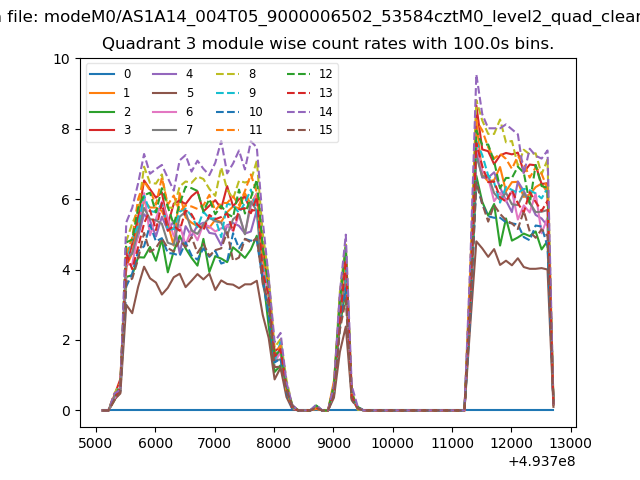
| Module-wise count rates for Quadrant C Data is divided into 100 sec bins |
 |
 |
| Module-wise count rates for Quadrant D Data is divided into 100 sec bins |
 |
 |
| Parameter | Plot |
|---|---|
| CZT HV Monitor | 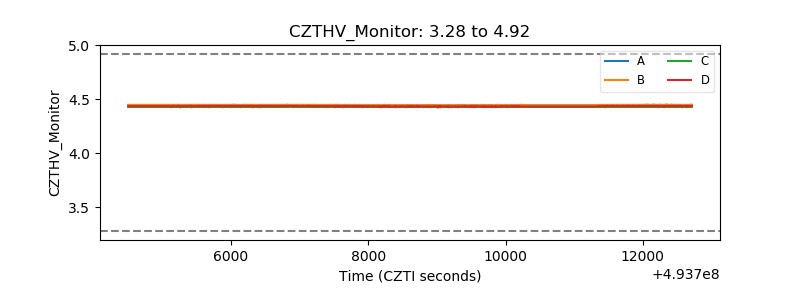 |
| D_VDD | 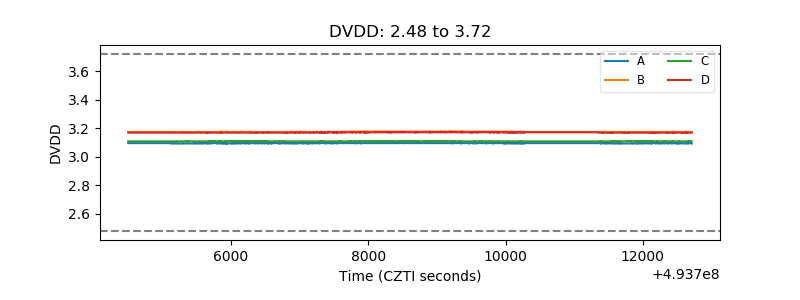 |
| Temperature 1 | 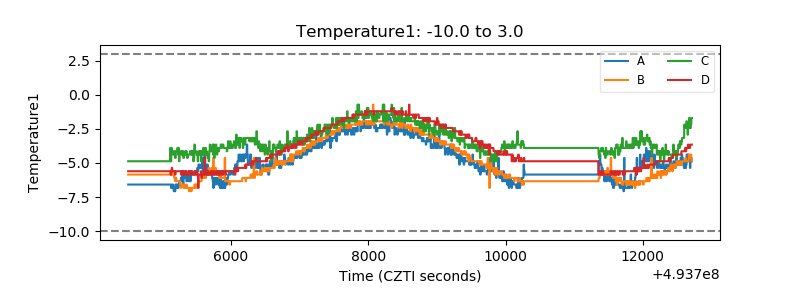 |
| Veto HV Monitor | 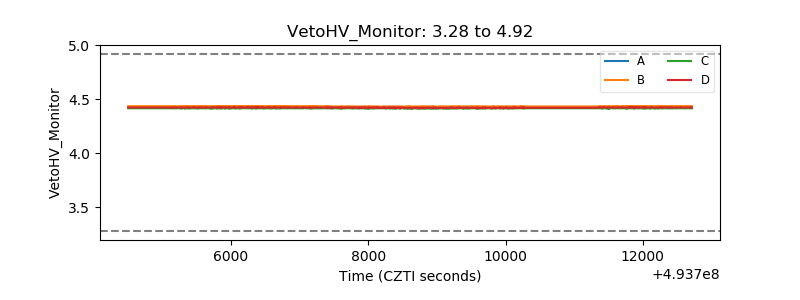 |
| Veto LLD | 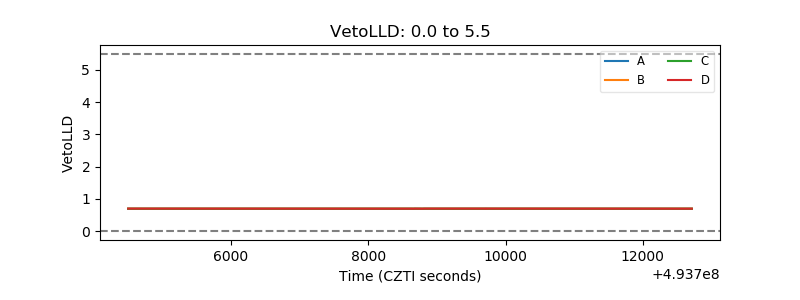 |
| Alpha Counter | 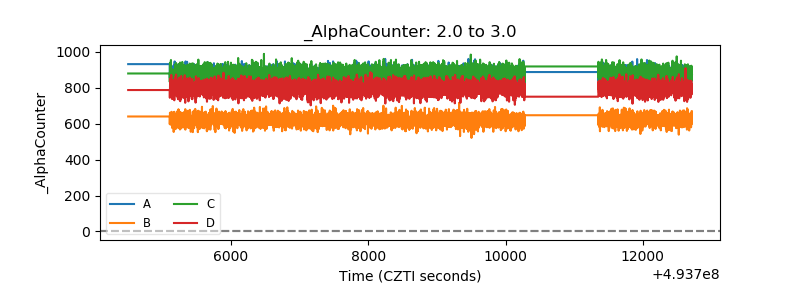 |
| _CPM_Rate | 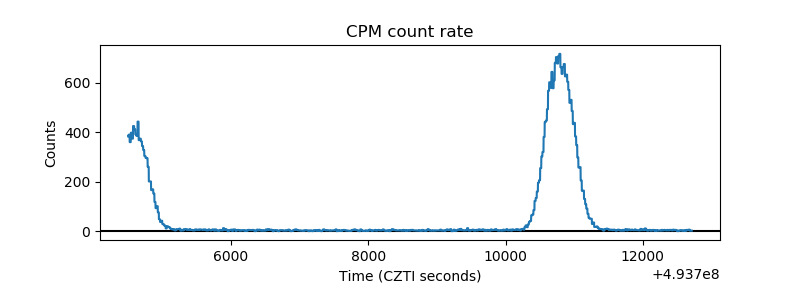 |
| CZT Counter | 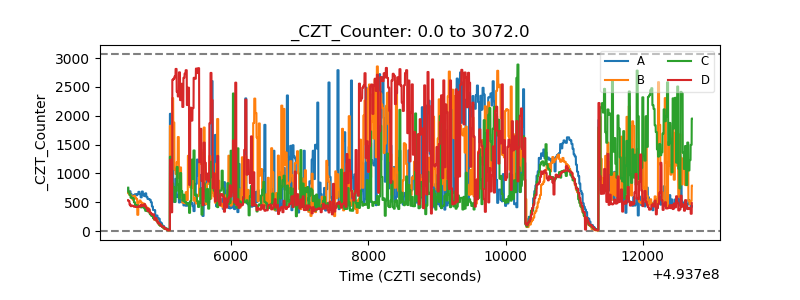 |
| +2.5 Volts monitor |  |
| +5 Volts monitor |  |
| _ROLL_ROT | 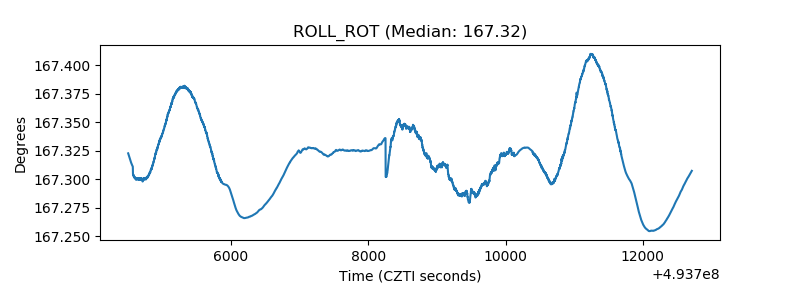 |
| _Roll_DEC | 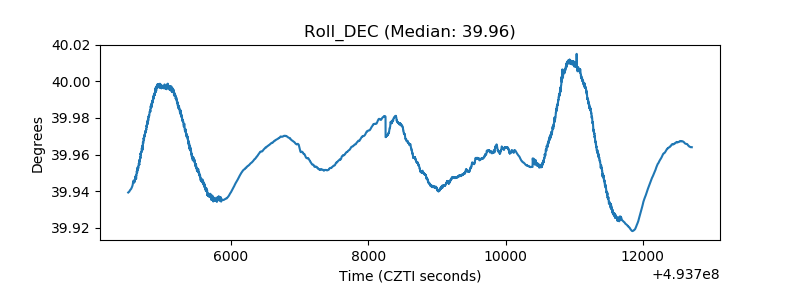 |
| _Roll_RA | 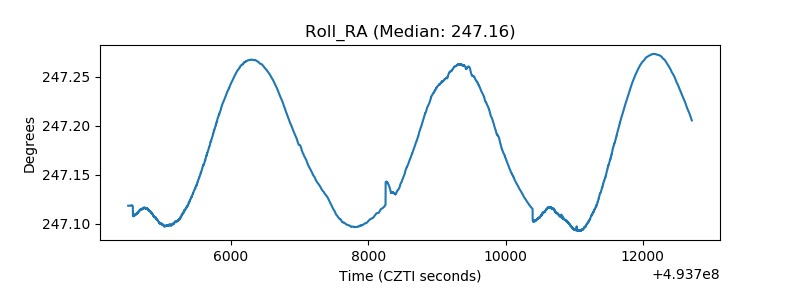 |
| Veto Counter | 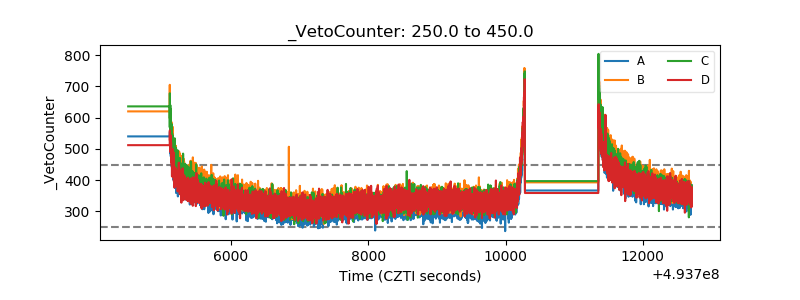 |