| Param | Original file | Final file |
|---|---|---|
| Filename | modeM0/AS1A14_004T05_9000006502_53585cztM0_level2.fits | modeM0/AS1A14_004T05_9000006502_53585cztM0_level2_quad_clean.evt |
| Size (bytes) | 792,218,880 | 86,414,400 |
| Size | 755.5 MB | 82.4 MB |
| Events in quadrant A | 4,559,111 | 637,120 |
| Events in quadrant B | 6,649,663 | 635,548 |
| Events in quadrant C | 9,433,101 | 498,393 |
| Events in quadrant D | 8,179,575 | 391,217 |
| Mode M9 | |||
|---|---|---|---|
| Quadrant | BADHDUFLAG | Total packets | Discarded packets |
| A | 0 | 14 | 0 |
| B | 0 | 15 | 0 |
| C | 0 | 15 | 0 |
| D | 0 | 15 | 0 |
| Mode SS | |||
|---|---|---|---|
| Quadrant | BADHDUFLAG | Total packets | Discarded packets |
| A | 0 | 132 | 0 |
| B | 0 | 132 | 0 |
| C | 0 | 132 | 0 |
| D | 0 | 132 | 0 |
| Mode M0 | |||
|---|---|---|---|
| Quadrant | BADHDUFLAG | Total packets | Discarded packets |
| A | 0 | 17928 | 2 |
| B | 0 | 24143 | 3 |
| C | 0 | 32616 | 2 |
| D | 0 | 28821 | 2 |
| Quadrant | Total seconds | Saturated seconds | Saturation percentage |
|---|---|---|---|
| A | 6511 | 458 | 7.034250% |
| B | 6510 | 1132 | 17.388633% |
| C | 6510 | 1784 | 27.403994% |
| D | 6510 | 2406 | 36.958525% |
Noise dominated data is calculated using 1-second bins in cleaned event files. If a bin has >2000 counts, and if more than 50% of those come from <1% of pixels, then it is considered to be noise-dominated and hence unusable.
| Quadrant | # 1 sec bins | Bins with >0 counts | Bins with >2000 counts | High rate bins dominated by noise | Noise dominated (total time) | Noise dominated (detector-on time) | Marked lightcurve |
|---|---|---|---|---|---|---|---|
| A | 7621 | 6512 | 265 | 265 | 3.48% | 4.07% | 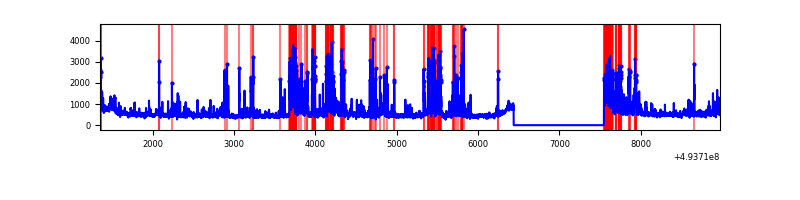 |
| B | 7620 | 6511 | 575 | 575 | 7.55% | 8.83% | 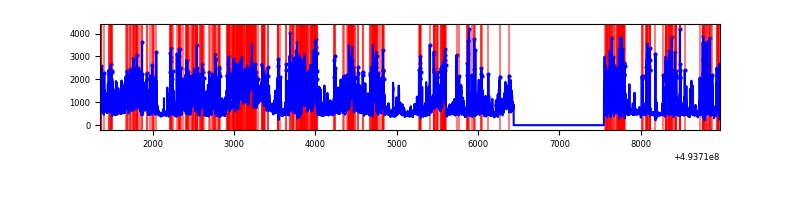 |
| C | 7620 | 6511 | 1311 | 1311 | 17.20% | 20.14% | 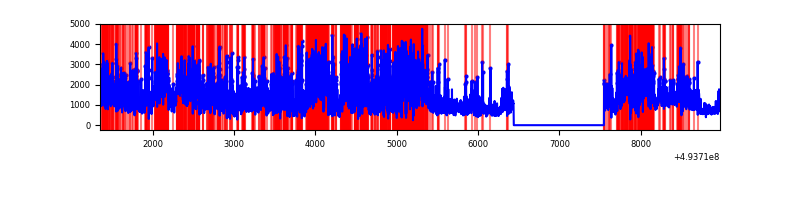 |
| D | 7620 | 6510 | 1457 | 1457 | 19.12% | 22.38% | 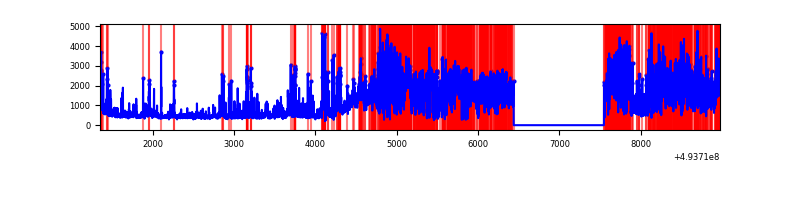 |
Top three noisy pixels from each quadrant. If the there are fewer than three noisy pixels in the level2.evt file, extra rows are filled as -1
| Pixel properties | Quadrant properties | ||||||
|---|---|---|---|---|---|---|---|
| Quadrant | DetID | PixID | Counts | Sigma | Mean | Median | Sigma |
| A | 3 | 62 | 676987 | 3716.36 | 737 | 718 | 182.0 |
| A | 15 | 174 | 555001 | 3046.0 | 737 | 718 | 182.0 |
| A | 3 | 63 | 129088 | 705.44 | 737 | 718 | 182.0 |
| B | 4 | 206 | 2407148 | 16018.66 | 701 | 677 | 150.2 |
| B | 4 | 81 | 519007 | 3450.26 | 701 | 677 | 150.2 |
| B | 5 | 185 | 423293 | 2813.14 | 701 | 677 | 150.2 |
| C | 13 | 3 | 3037585 | 17103.14 | 650 | 645 | 177.6 |
| C | 15 | 224 | 2697386 | 15187.24 | 650 | 645 | 177.6 |
| C | 1 | 241 | 428611 | 2410.18 | 650 | 645 | 177.6 |
| D | 8 | 176 | 5255360 | 35160.65 | 518 | 494 | 149.5 |
| D | 7 | 70 | 172981 | 1154.12 | 518 | 494 | 149.5 |
| D | 13 | 153 | 170998 | 1140.85 | 518 | 494 | 149.5 |
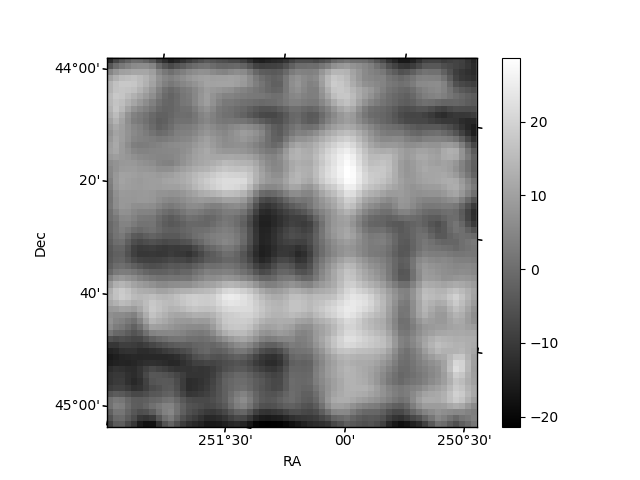
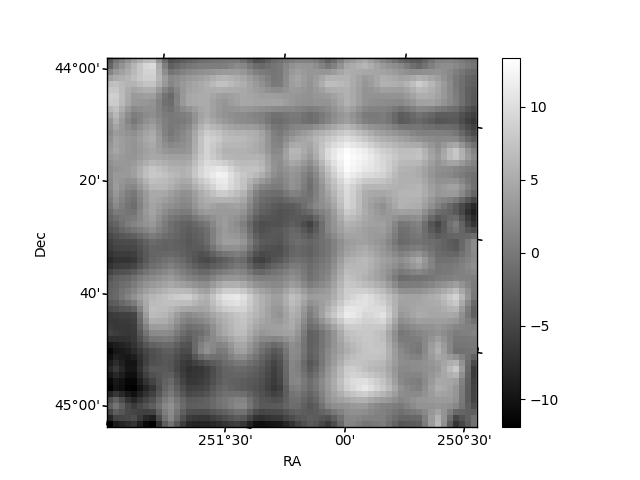
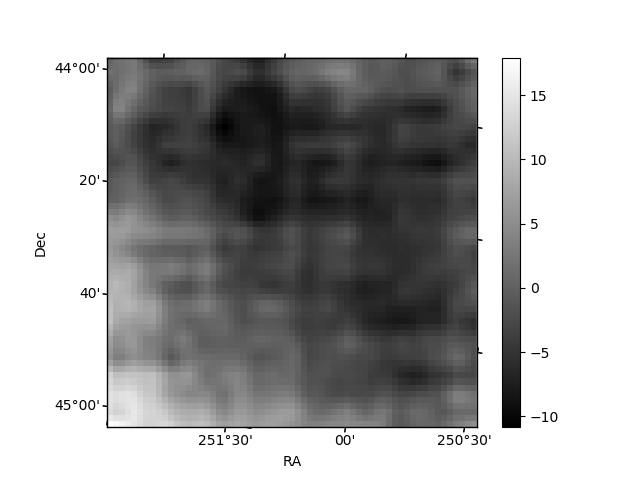
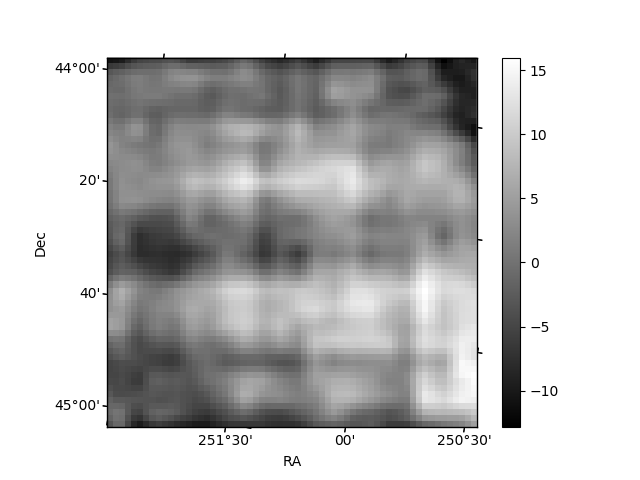
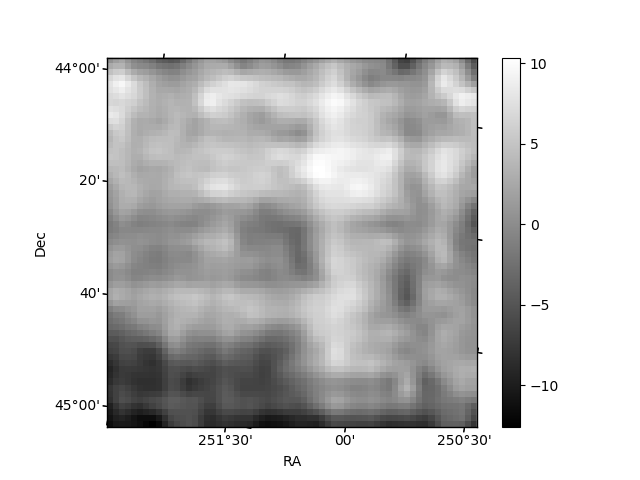
Histogram calculated using DETX and DETY for each event in the final _common_clean file
| Quadrant A | 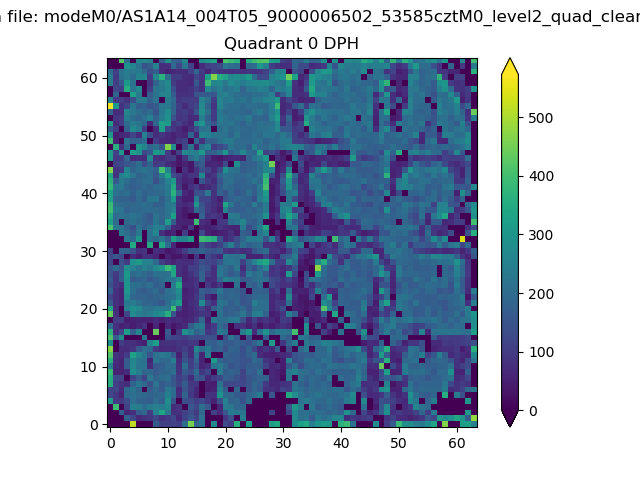 |
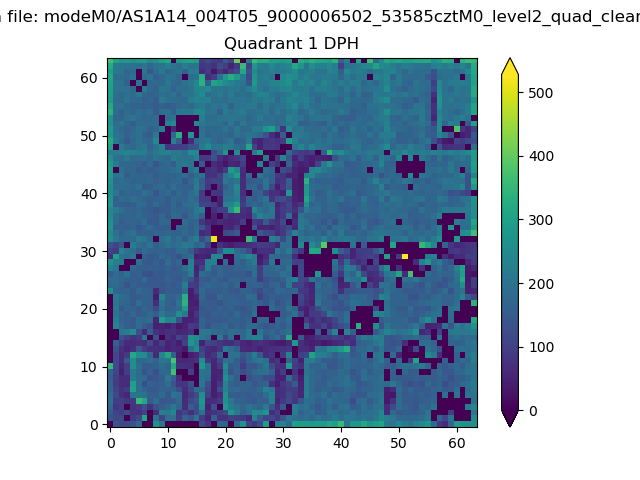 |
Quadrant B |
|---|---|---|---|
| Quadrant D | 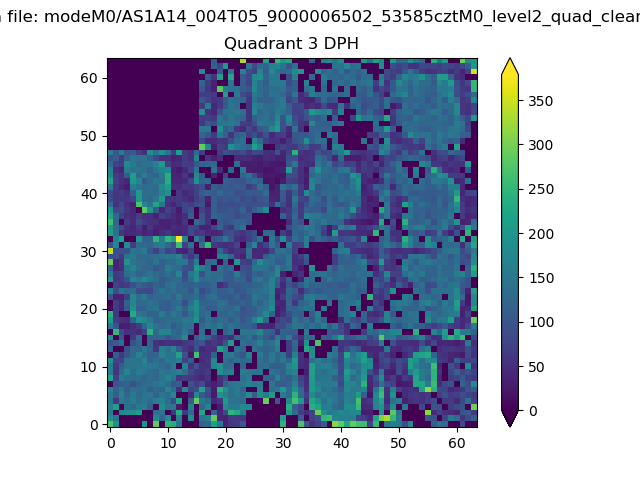 |
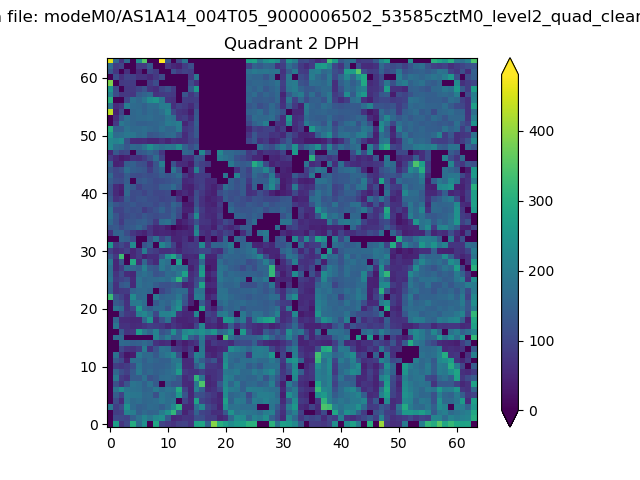 |
Quadrant C |
| Plot type | Count rate plots | Images |
|---|---|---|
| Comparison with Poisson distribution Blue bars denote a histogram of data divided into 1 sec bins. Red curve is a Poisson curve with rate = median count rate of data. |
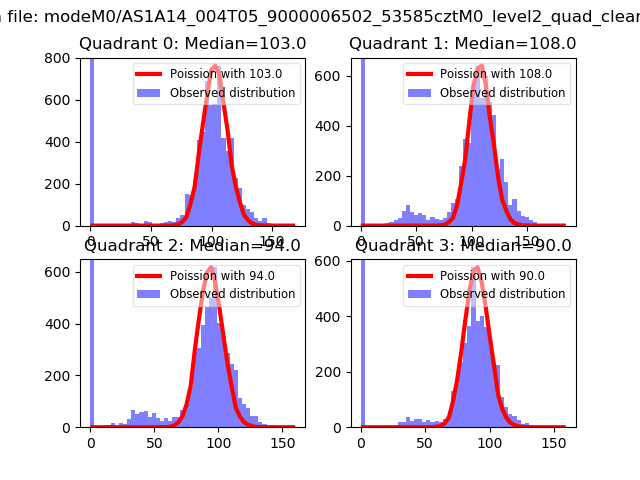 |
 |
| Quadrant-wise count rates Data is divided into 100 sec bins |
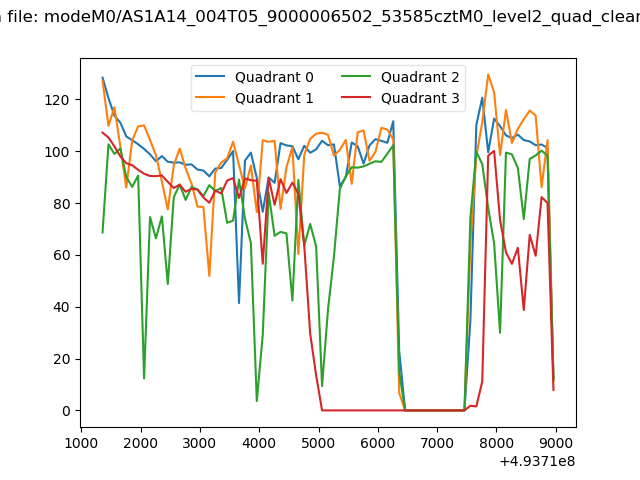 |
|
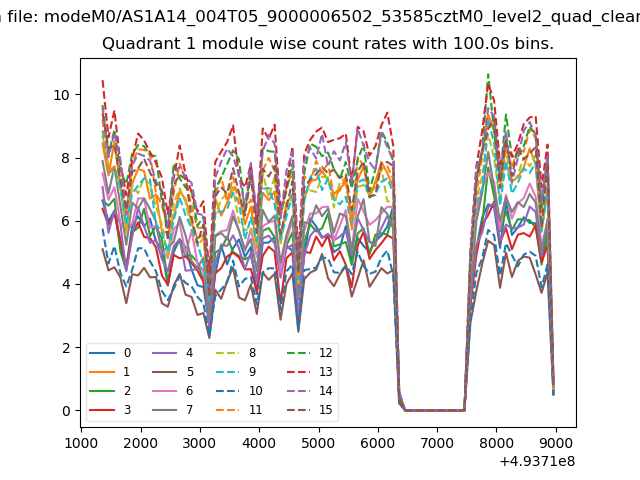
| Module-wise count rates for Quadrant A Data is divided into 100 sec bins |
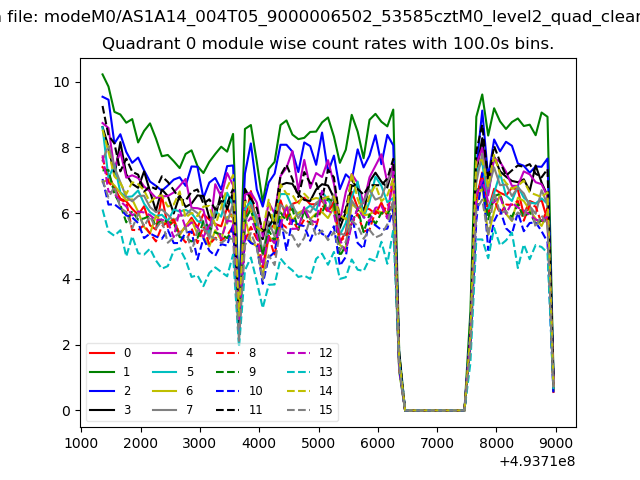 |
 |
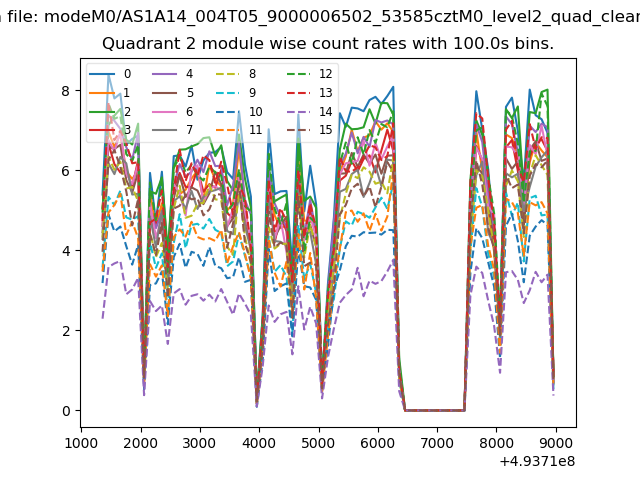
| Module-wise count rates for Quadrant B Data is divided into 100 sec bins |
 |
 |
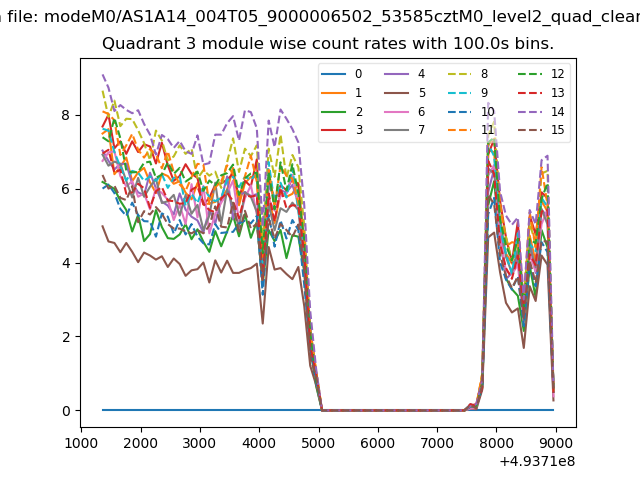
| Module-wise count rates for Quadrant C Data is divided into 100 sec bins |
 |
 |
| Module-wise count rates for Quadrant D Data is divided into 100 sec bins |
 |
 |
| Parameter | Plot |
|---|---|
| CZT HV Monitor | 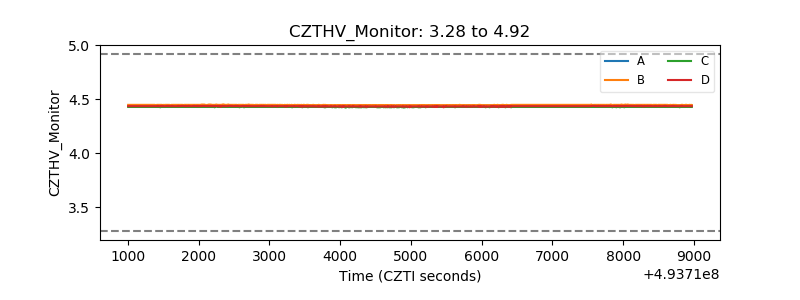 |
| D_VDD | 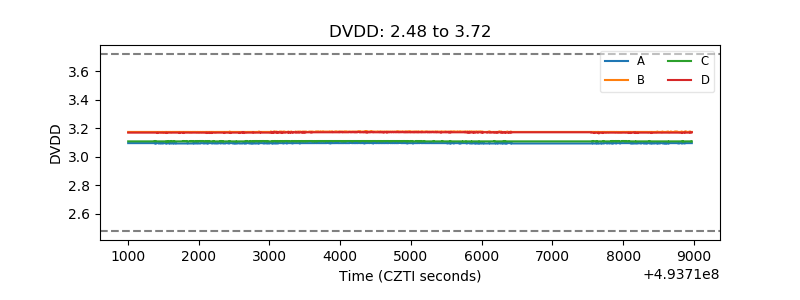 |
| Temperature 1 | 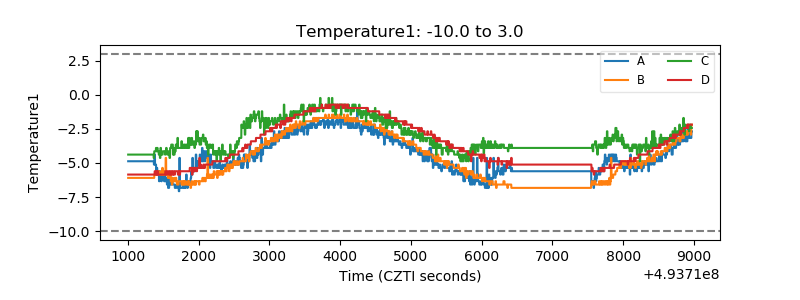 |
| Veto HV Monitor | 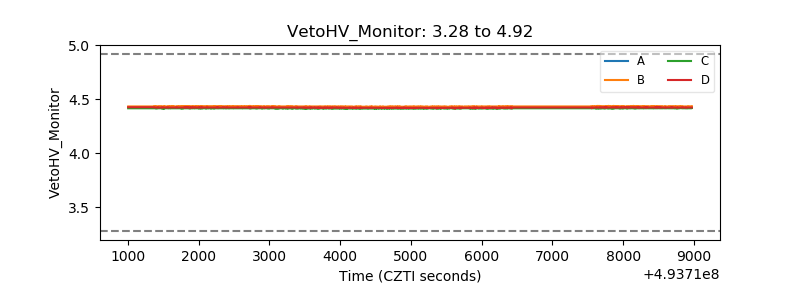 |
| Veto LLD | 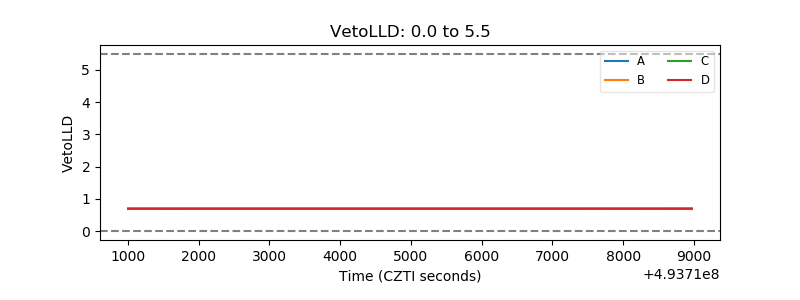 |
| Alpha Counter | 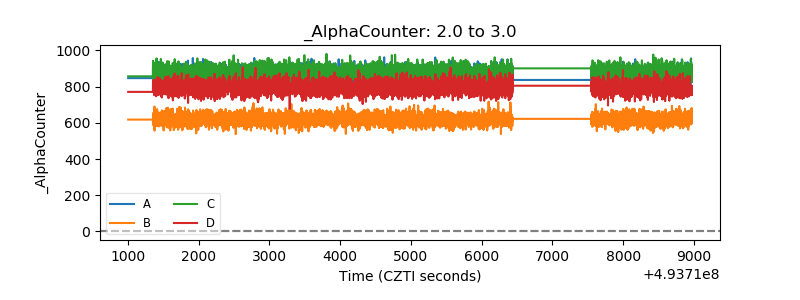 |
| _CPM_Rate | 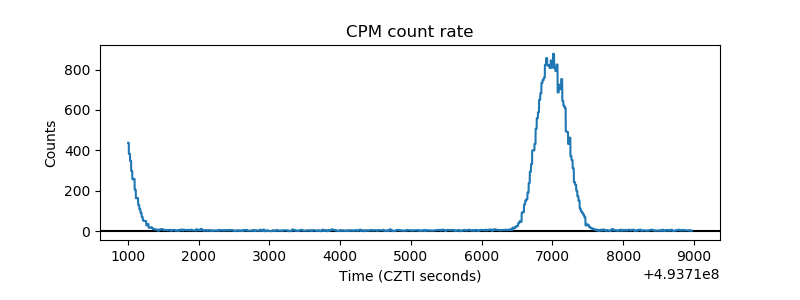 |
| CZT Counter | 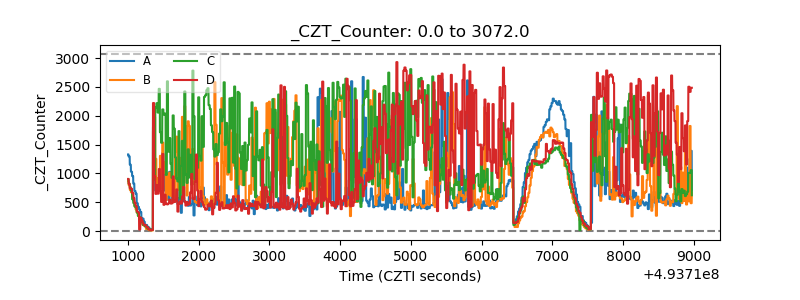 |
| +2.5 Volts monitor | 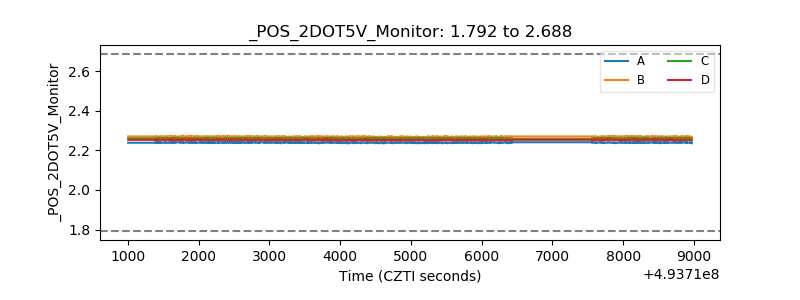 |
| +5 Volts monitor | 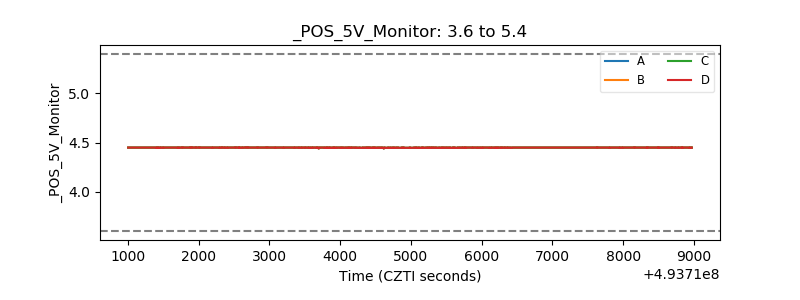 |
| _ROLL_ROT | 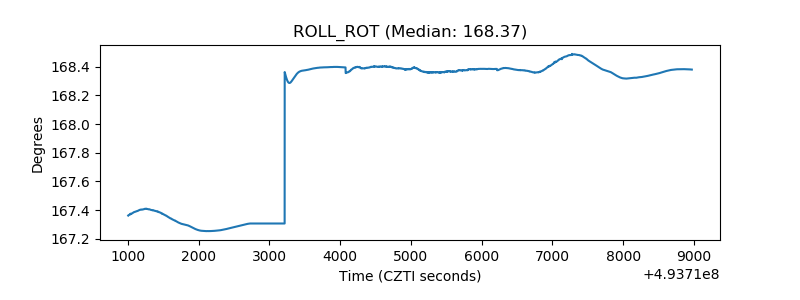 |
| _Roll_DEC | 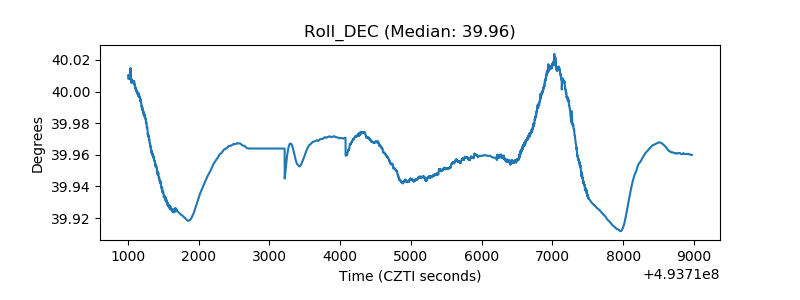 |
| _Roll_RA | 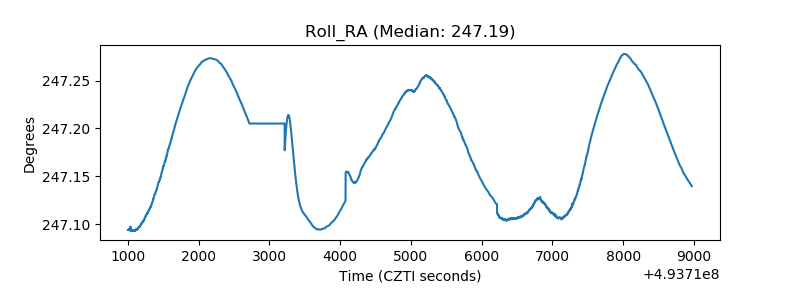 |
| Veto Counter | 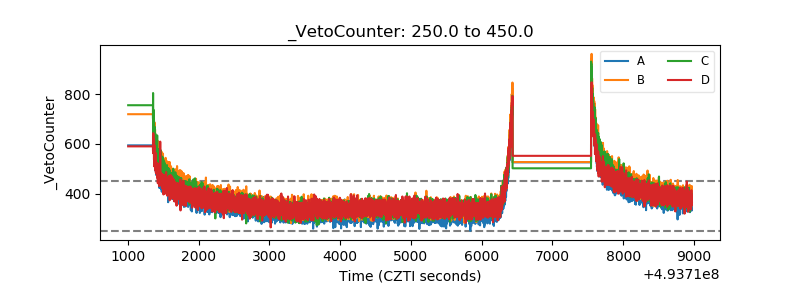 |