| Param | Original file | Final file |
|---|---|---|
| Filename | modeM0/AS1A14_004T05_9000006502_53586cztM0_level2.fits | modeM0/AS1A14_004T05_9000006502_53586cztM0_level2_quad_clean.evt |
| Size (bytes) | 879,353,280 | 83,655,360 |
| Size | 838.6 MB | 79.8 MB |
| Events in quadrant A | 8,041,172 | 495,509 |
| Events in quadrant B | 6,495,092 | 650,036 |
| Events in quadrant C | 7,209,659 | 580,358 |
| Events in quadrant D | 10,304,982 | 355,440 |
| Mode M9 | |||
|---|---|---|---|
| Quadrant | BADHDUFLAG | Total packets | Discarded packets |
| A | 0 | 15 | 0 |
| B | 0 | 16 | 0 |
| C | 0 | 16 | 0 |
| D | 0 | 16 | 0 |
| Mode SS | |||
|---|---|---|---|
| Quadrant | BADHDUFLAG | Total packets | Discarded packets |
| A | 0 | 132 | 0 |
| B | 0 | 132 | 0 |
| C | 0 | 132 | 0 |
| D | 0 | 132 | 0 |
| Mode M0 | |||
|---|---|---|---|
| Quadrant | BADHDUFLAG | Total packets | Discarded packets |
| A | 0 | 28287 | 2 |
| B | 0 | 23666 | 2 |
| C | 0 | 25947 | 2 |
| D | 0 | 35020 | 2 |
| Quadrant | Total seconds | Saturated seconds | Saturation percentage |
|---|---|---|---|
| A | 6469 | 2046 | 31.627763% |
| B | 6468 | 1050 | 16.233766% |
| C | 6468 | 930 | 14.378479% |
| D | 6468 | 3011 | 46.552257% |
Noise dominated data is calculated using 1-second bins in cleaned event files. If a bin has >2000 counts, and if more than 50% of those come from <1% of pixels, then it is considered to be noise-dominated and hence unusable.
| Quadrant | # 1 sec bins | Bins with >0 counts | Bins with >2000 counts | High rate bins dominated by noise | Noise dominated (total time) | Noise dominated (detector-on time) | Marked lightcurve |
|---|---|---|---|---|---|---|---|
| A | 7633 | 6468 | 1448 | 1448 | 18.97% | 22.39% | 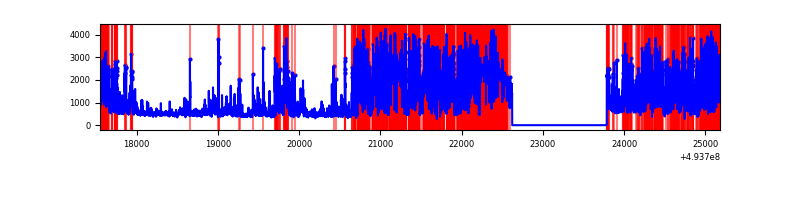 |
| B | 7633 | 6468 | 607 | 607 | 7.95% | 9.38% | 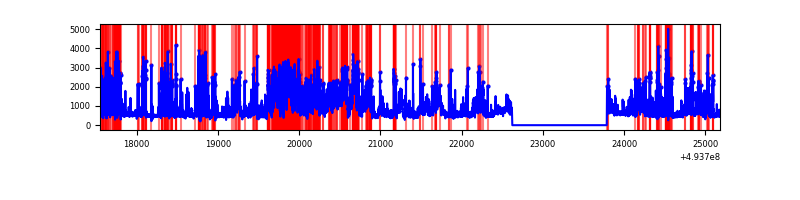 |
| C | 7633 | 6469 | 634 | 634 | 8.31% | 9.80% | 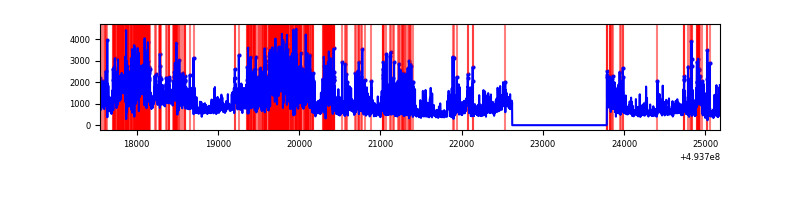 |
| D | 7633 | 6468 | 2375 | 2375 | 31.11% | 36.72% | 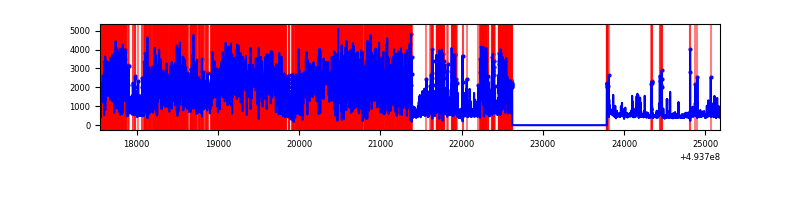 |
Top three noisy pixels from each quadrant. If the there are fewer than three noisy pixels in the level2.evt file, extra rows are filled as -1
| Pixel properties | Quadrant properties | ||||||
|---|---|---|---|---|---|---|---|
| Quadrant | DetID | PixID | Counts | Sigma | Mean | Median | Sigma |
| A | 3 | 62 | 4250751 | 26621.09 | 646 | 630 | 159.7 |
| A | 3 | 63 | 415543 | 2598.85 | 646 | 630 | 159.7 |
| A | 15 | 174 | 407824 | 2550.5 | 646 | 630 | 159.7 |
| B | 4 | 206 | 1934649 | 12781.52 | 713 | 691 | 151.3 |
| B | 10 | 28 | 831847 | 5493.11 | 713 | 691 | 151.3 |
| B | 8 | 234 | 258961 | 1706.91 | 713 | 691 | 151.3 |
| C | 13 | 3 | 1331629 | 6950.73 | 697 | 689 | 191.5 |
| C | 15 | 224 | 1324258 | 6912.24 | 697 | 689 | 191.5 |
| C | 1 | 241 | 1041864 | 5437.46 | 697 | 689 | 191.5 |
| D | 8 | 176 | 7082863 | 45413.5 | 538 | 513 | 156.0 |
| D | 7 | 70 | 294503 | 1885.13 | 538 | 513 | 156.0 |
| D | 13 | 153 | 204252 | 1306.42 | 538 | 513 | 156.0 |
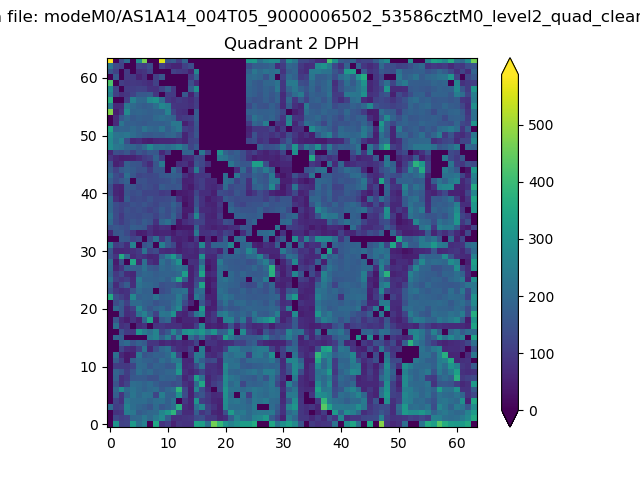
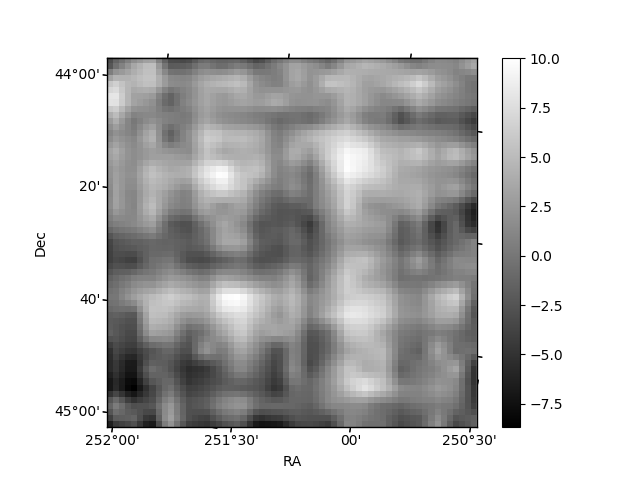
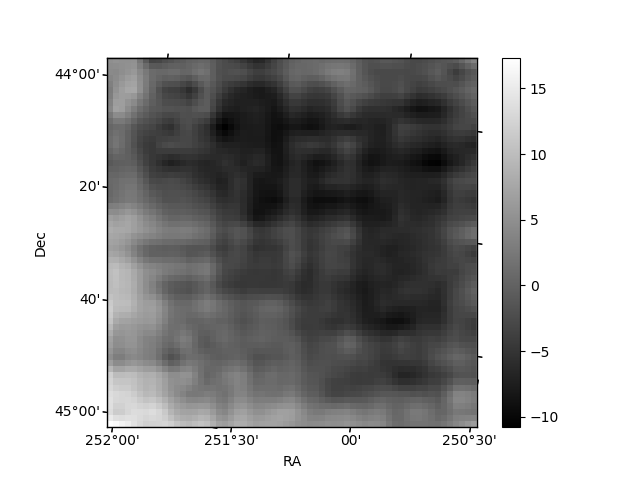
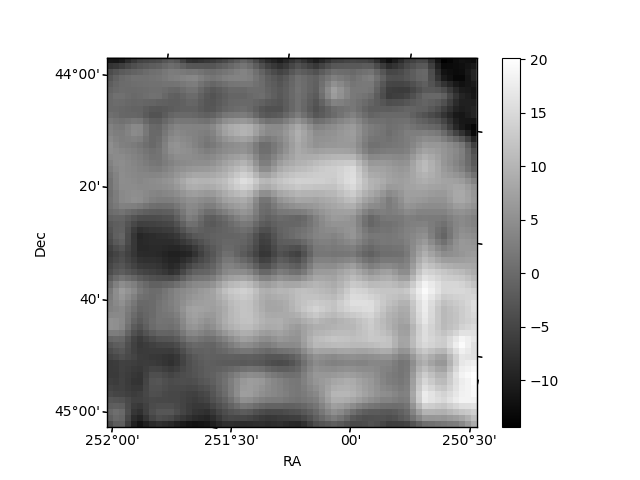
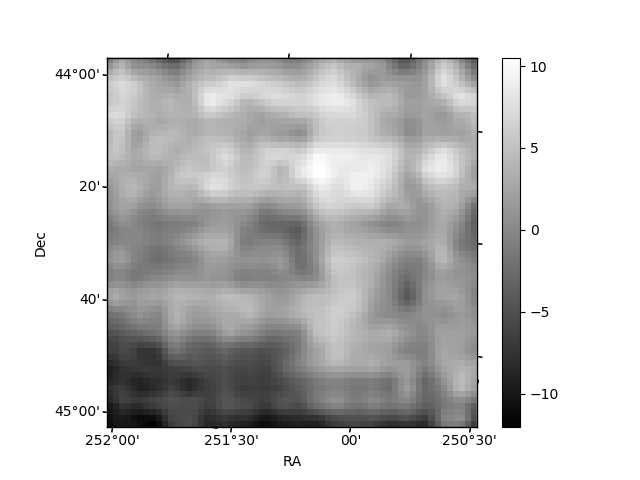
Histogram calculated using DETX and DETY for each event in the final _common_clean file
| Quadrant A | 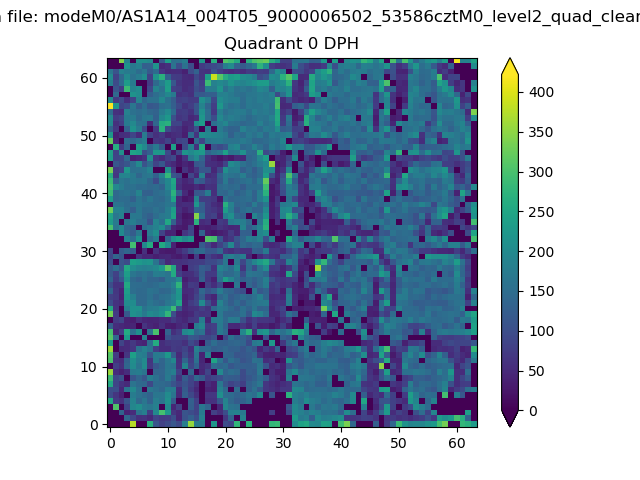 |
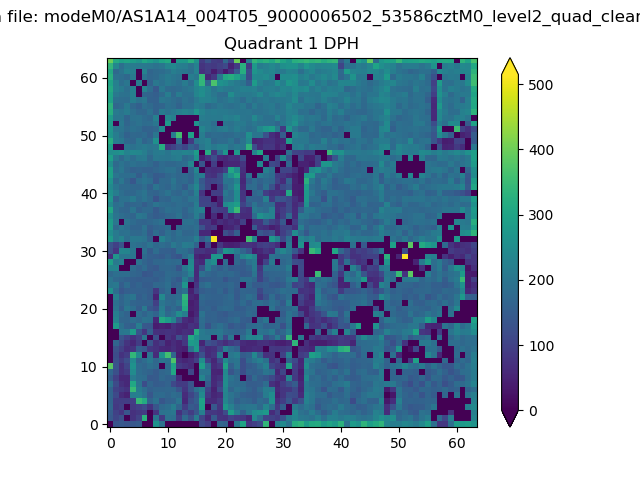 |
Quadrant B |
|---|---|---|---|
| Quadrant D | 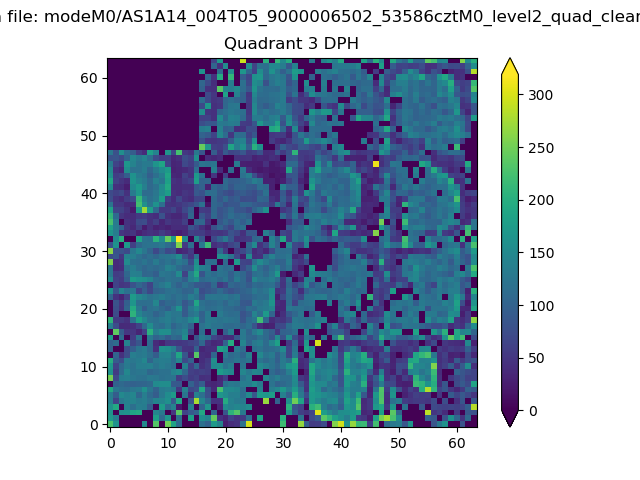 |
 |
Quadrant C |
| Plot type | Count rate plots | Images |
|---|---|---|
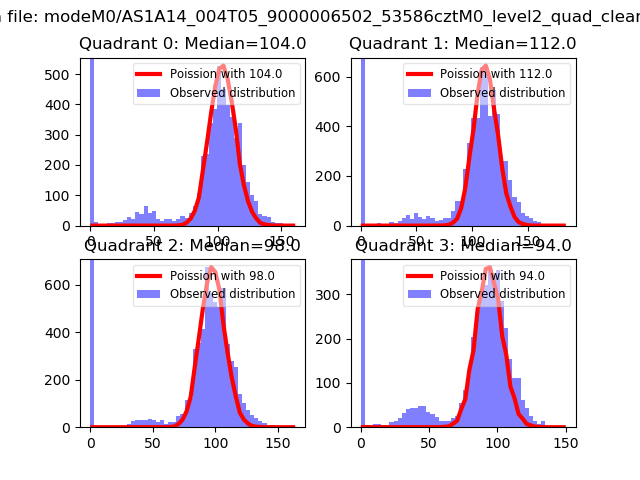
| Comparison with Poisson distribution Blue bars denote a histogram of data divided into 1 sec bins. Red curve is a Poisson curve with rate = median count rate of data. |
 |
 |
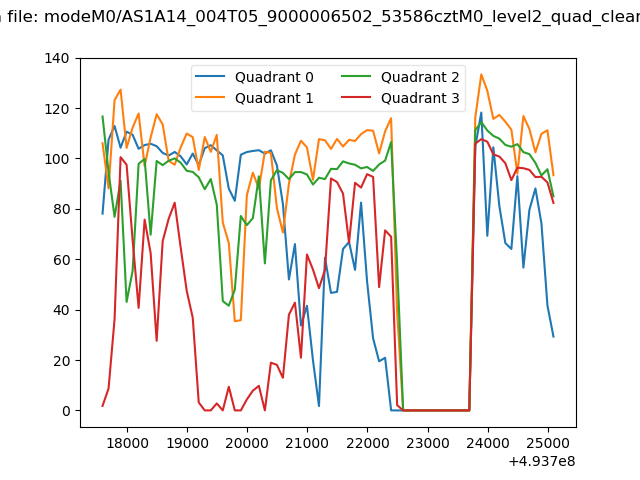
| Quadrant-wise count rates Data is divided into 100 sec bins |
 |
|
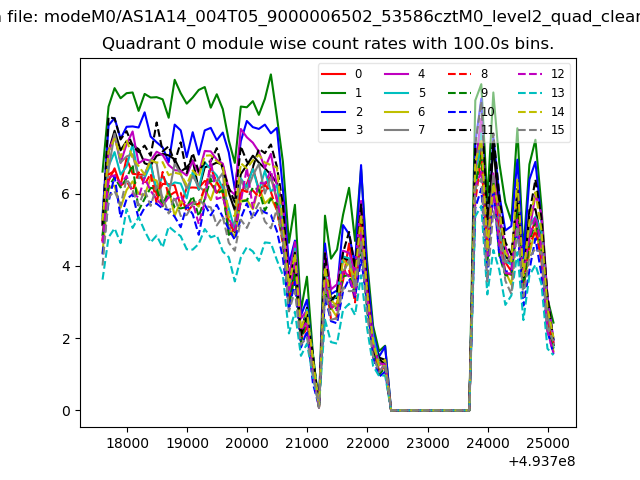
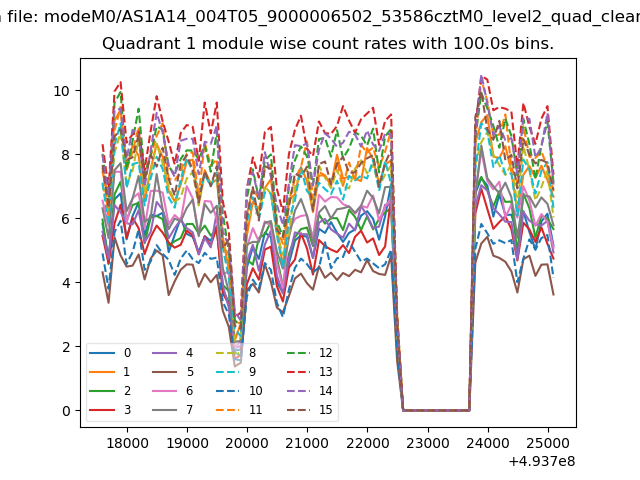
| Module-wise count rates for Quadrant A Data is divided into 100 sec bins |
 |
 |
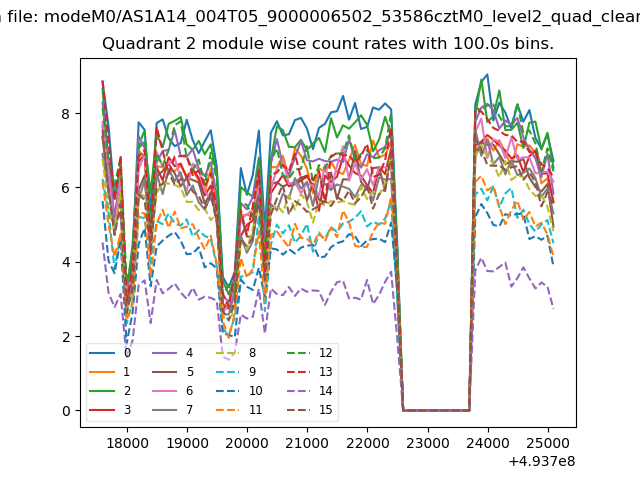
| Module-wise count rates for Quadrant B Data is divided into 100 sec bins |
 |
 |
| Module-wise count rates for Quadrant C Data is divided into 100 sec bins |
 |
 |
| Module-wise count rates for Quadrant D Data is divided into 100 sec bins |
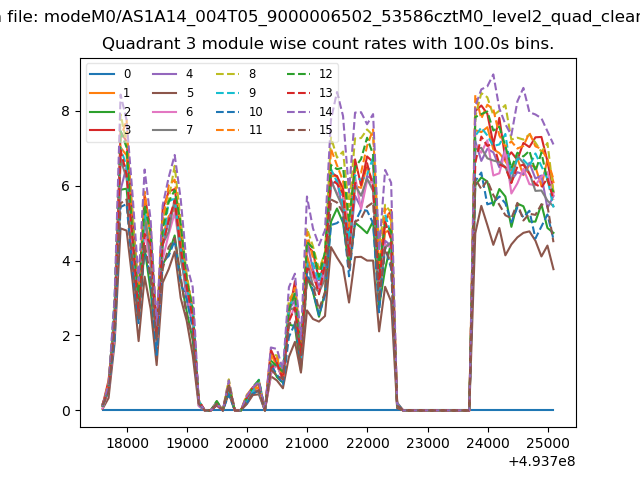 |
 |
| Parameter | Plot |
|---|---|
| CZT HV Monitor | 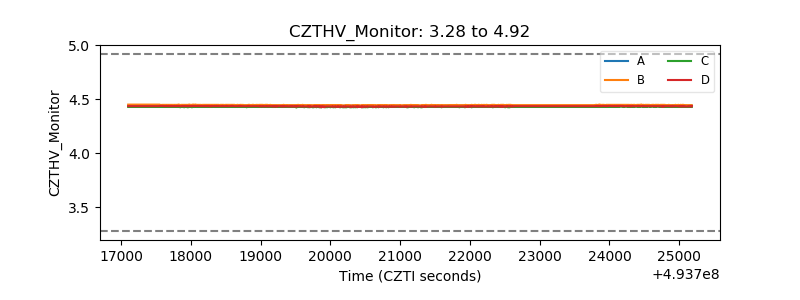 |
| D_VDD | 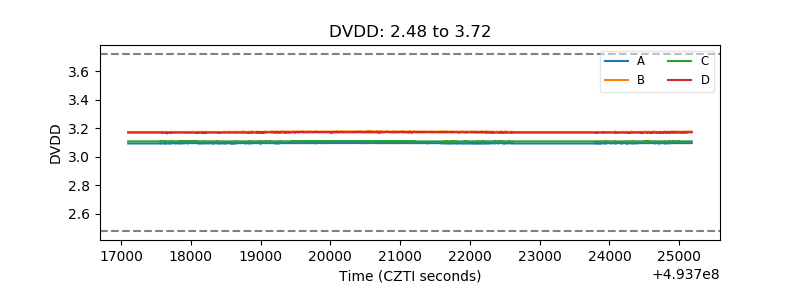 |
| Temperature 1 | 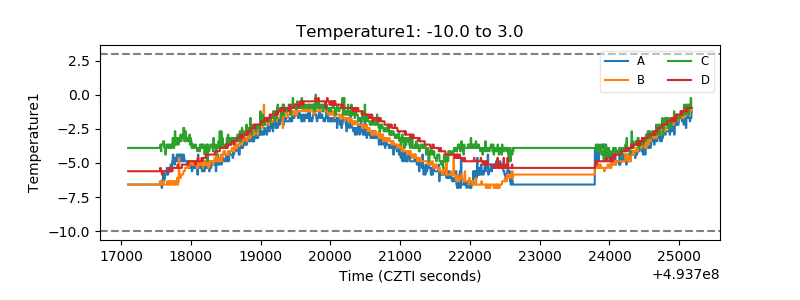 |
| Veto HV Monitor | 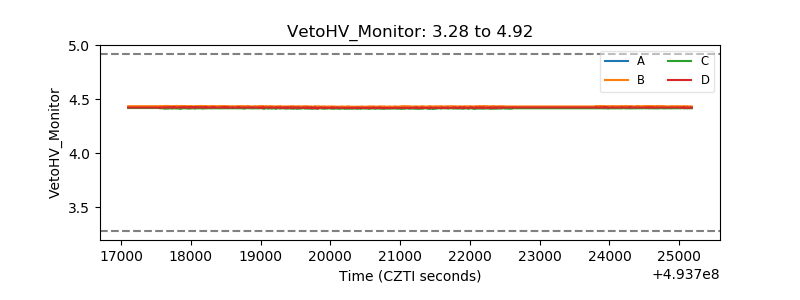 |
| Veto LLD | 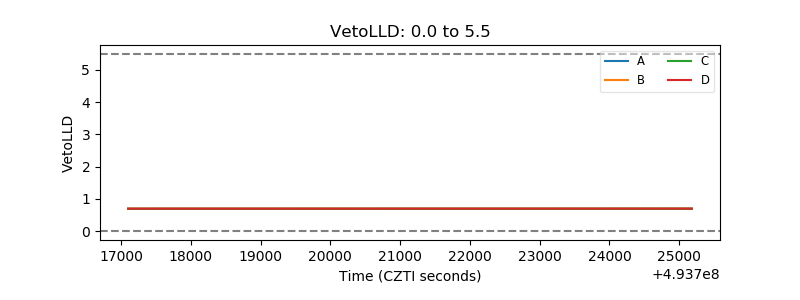 |
| Alpha Counter | 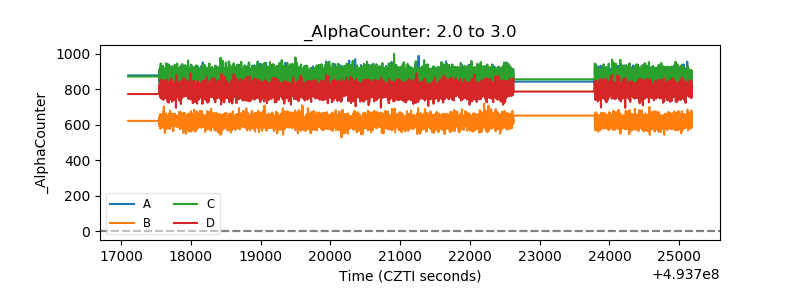 |
| _CPM_Rate | 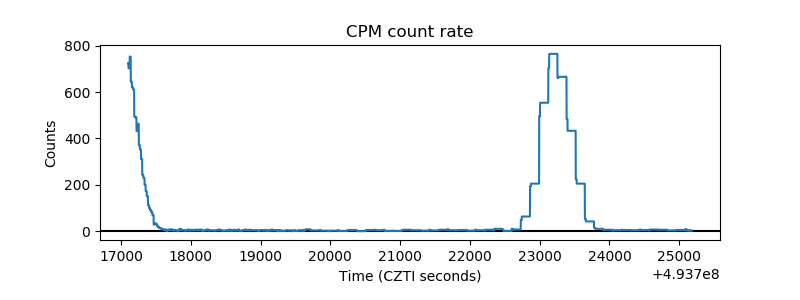 |
| CZT Counter | 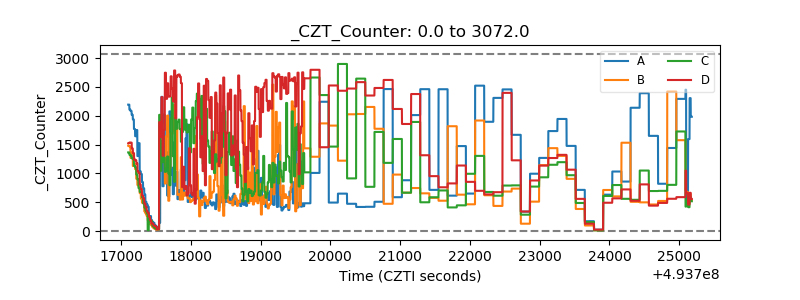 |
| +2.5 Volts monitor |  |
| +5 Volts monitor | 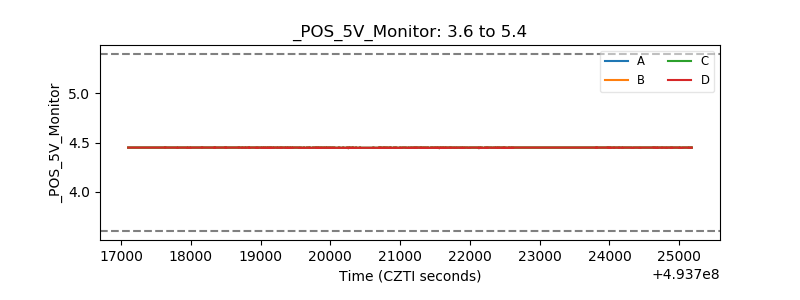 |
| _ROLL_ROT | 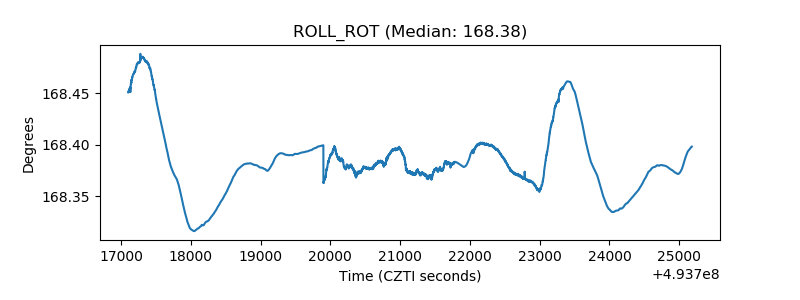 |
| _Roll_DEC | 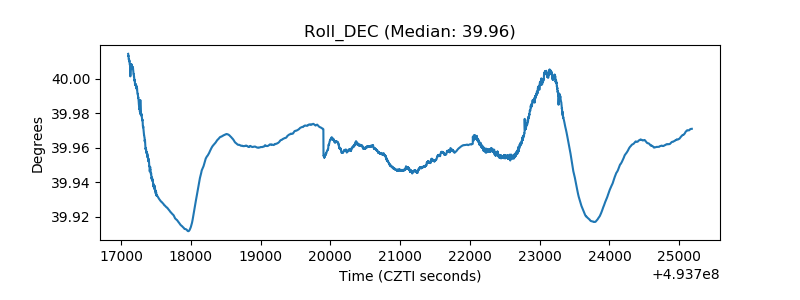 |
| _Roll_RA | 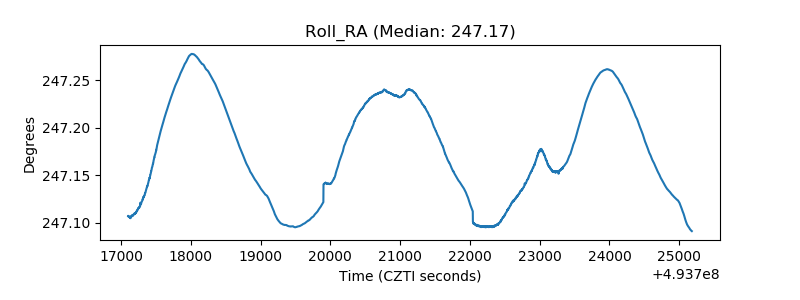 |
| Veto Counter | 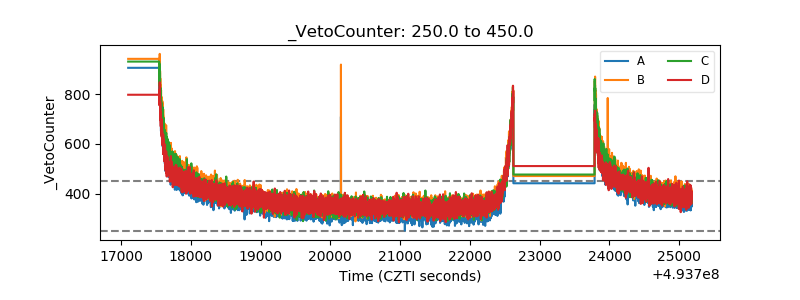 |