| Param | Original file | Final file |
|---|---|---|
| Filename | modeM0/AS1A14_004T05_9000006502_53587cztM0_level2.fits | modeM0/AS1A14_004T05_9000006502_53587cztM0_level2_quad_clean.evt |
| Size (bytes) | 812,064,960 | 74,937,600 |
| Size | 774.4 MB | 71.5 MB |
| Events in quadrant A | 11,915,669 | 232,771 |
| Events in quadrant B | 5,363,046 | 613,230 |
| Events in quadrant C | 7,192,940 | 501,574 |
| Events in quadrant D | 5,118,935 | 497,472 |
| Mode M9 | |||
|---|---|---|---|
| Quadrant | BADHDUFLAG | Total packets | Discarded packets |
| A | 0 | 11 | 0 |
| B | 0 | 11 | 0 |
| C | 0 | 11 | 0 |
| D | 0 | 11 | 0 |
| Mode SS | |||
|---|---|---|---|
| Quadrant | BADHDUFLAG | Total packets | Discarded packets |
| A | 0 | 124 | 0 |
| B | 0 | 124 | 0 |
| C | 0 | 124 | 0 |
| D | 0 | 124 | 0 |
| Mode M0 | |||
|---|---|---|---|
| Quadrant | BADHDUFLAG | Total packets | Discarded packets |
| A | 0 | 39508 | 1 |
| B | 0 | 20102 | 1 |
| C | 0 | 25565 | 1 |
| D | 0 | 19197 | 1 |
| Quadrant | Total seconds | Saturated seconds | Saturation percentage |
|---|---|---|---|
| A | 6065 | 4176 | 68.854081% |
| B | 6065 | 763 | 12.580379% |
| C | 6064 | 1167 | 19.244723% |
| D | 6064 | 840 | 13.852243% |
Noise dominated data is calculated using 1-second bins in cleaned event files. If a bin has >2000 counts, and if more than 50% of those come from <1% of pixels, then it is considered to be noise-dominated and hence unusable.
| Quadrant | # 1 sec bins | Bins with >0 counts | Bins with >2000 counts | High rate bins dominated by noise | Noise dominated (total time) | Noise dominated (detector-on time) | Marked lightcurve |
|---|---|---|---|---|---|---|---|
| A | 7169 | 6064 | 3311 | 3311 | 46.18% | 54.60% | 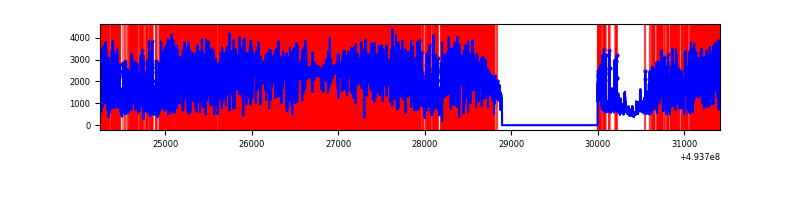 |
| B | 7170 | 6065 | 396 | 396 | 5.52% | 6.53% | 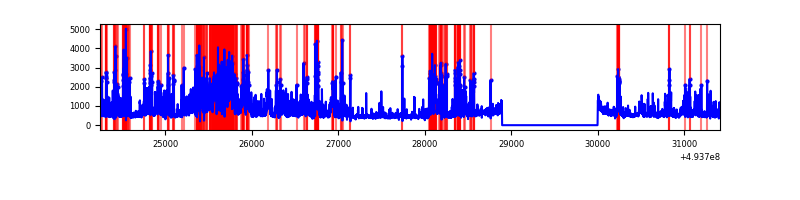 |
| C | 7169 | 6064 | 860 | 860 | 12.00% | 14.18% | 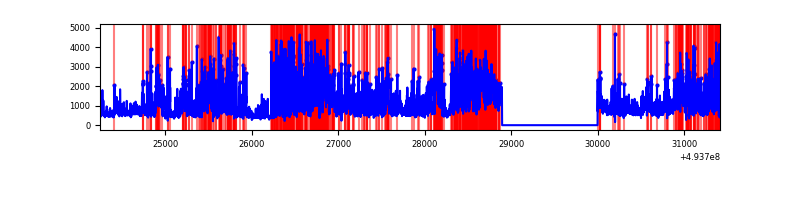 |
| D | 7169 | 6064 | 489 | 489 | 6.82% | 8.06% | 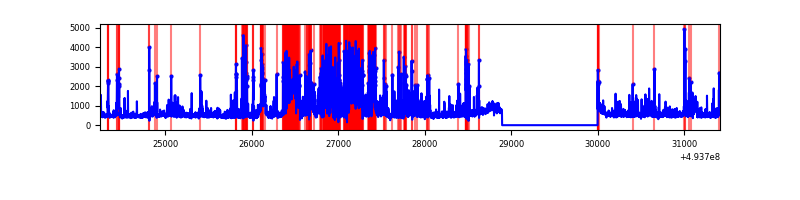 |
Top three noisy pixels from each quadrant. If the there are fewer than three noisy pixels in the level2.evt file, extra rows are filled as -1
| Pixel properties | Quadrant properties | ||||||
|---|---|---|---|---|---|---|---|
| Quadrant | DetID | PixID | Counts | Sigma | Mean | Median | Sigma |
| A | 3 | 62 | 8778069 | 74914.61 | 466 | 455 | 117.2 |
| A | 4 | 239 | 447009 | 3811.22 | 466 | 455 | 117.2 |
| A | 3 | 63 | 417792 | 3561.86 | 466 | 455 | 117.2 |
| B | 4 | 206 | 819752 | 5793.99 | 666 | 643 | 141.4 |
| B | 5 | 172 | 521280 | 3682.74 | 666 | 643 | 141.4 |
| B | 5 | 185 | 443166 | 3130.2 | 666 | 643 | 141.4 |
| C | 15 | 224 | 1694135 | 9958.93 | 614 | 608 | 170.1 |
| C | 13 | 3 | 1144823 | 6728.65 | 614 | 608 | 170.1 |
| C | 1 | 241 | 416012 | 2442.82 | 614 | 608 | 170.1 |
| D | 3 | 12 | 1358009 | 7437.07 | 642 | 611 | 182.5 |
| D | 7 | 70 | 407851 | 2231.23 | 642 | 611 | 182.5 |
| D | 12 | 3 | 148691 | 811.32 | 642 | 611 | 182.5 |
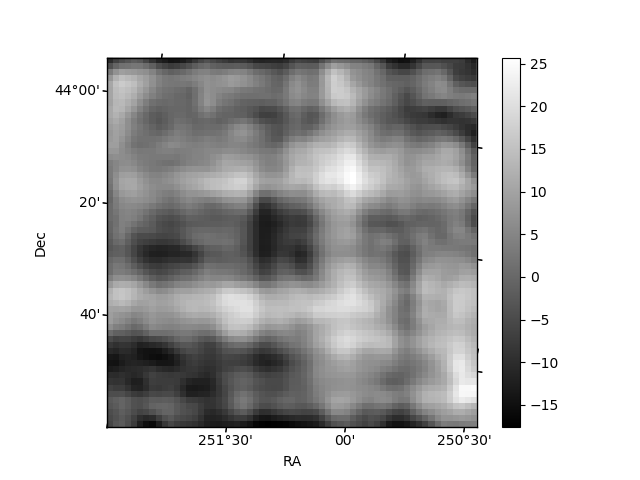
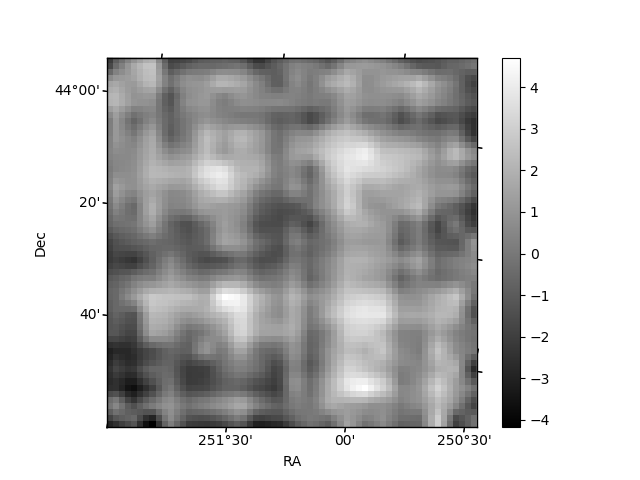
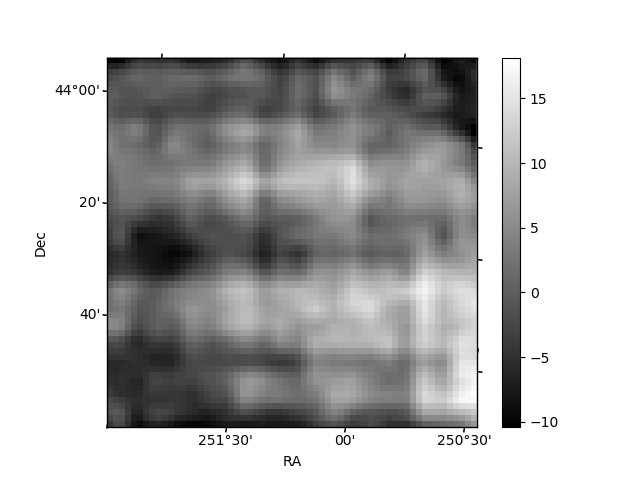
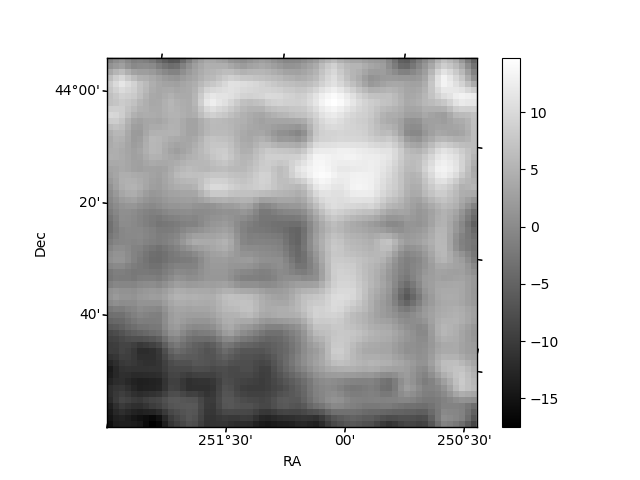
Histogram calculated using DETX and DETY for each event in the final _common_clean file
| Quadrant A | 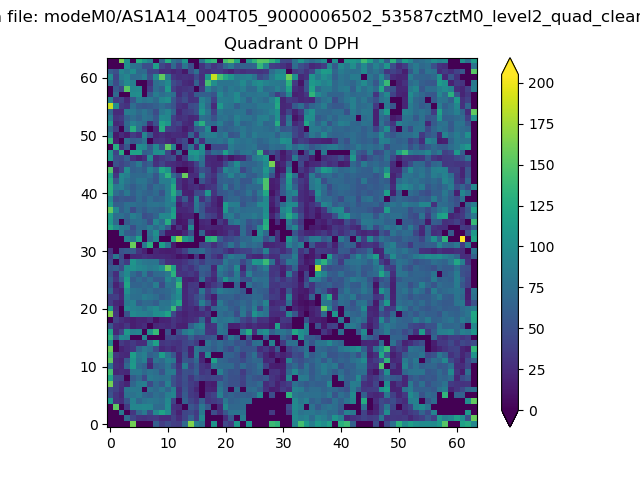 |
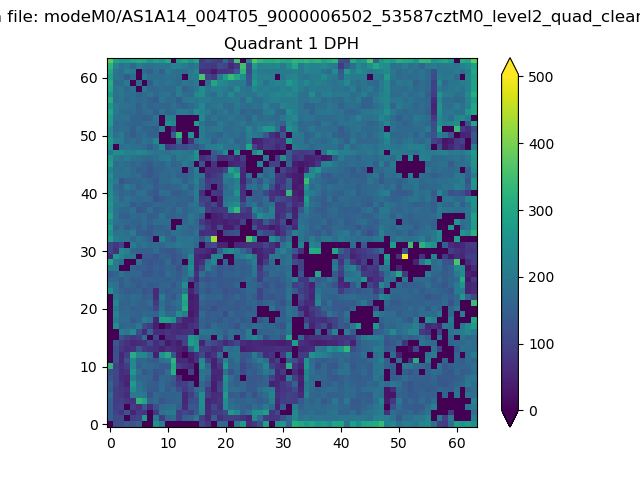 |
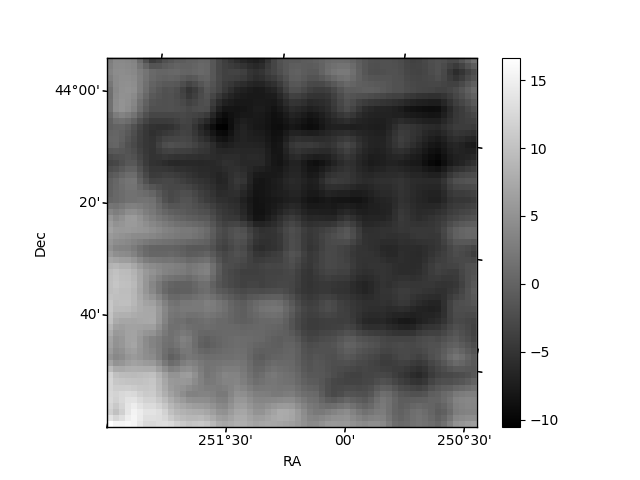
Quadrant B |
|---|---|---|---|
| Quadrant D | 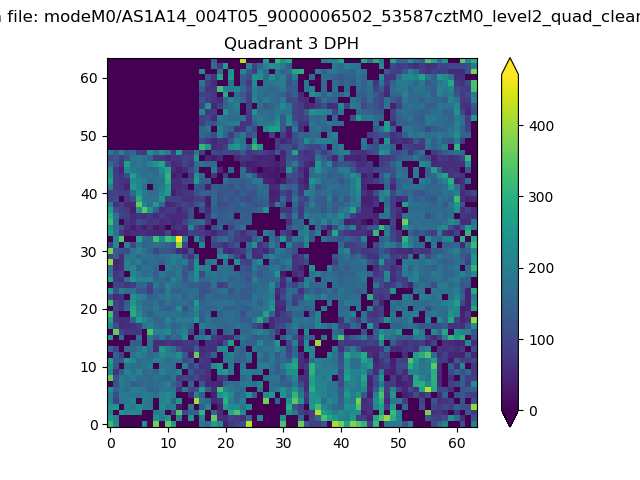 |
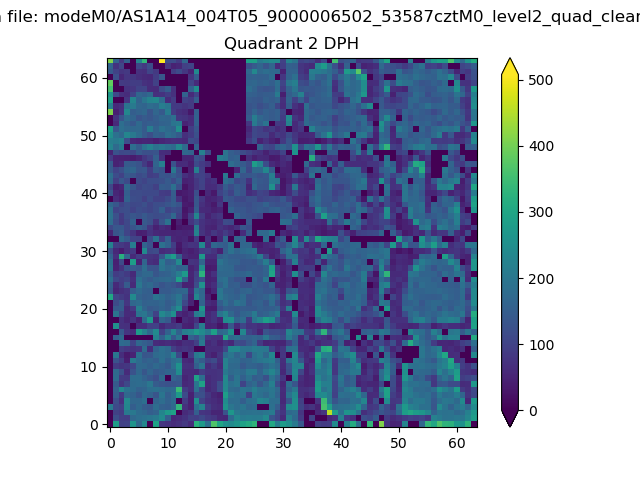 |
Quadrant C |
| Plot type | Count rate plots | Images |
|---|---|---|
| Comparison with Poisson distribution Blue bars denote a histogram of data divided into 1 sec bins. Red curve is a Poisson curve with rate = median count rate of data. |
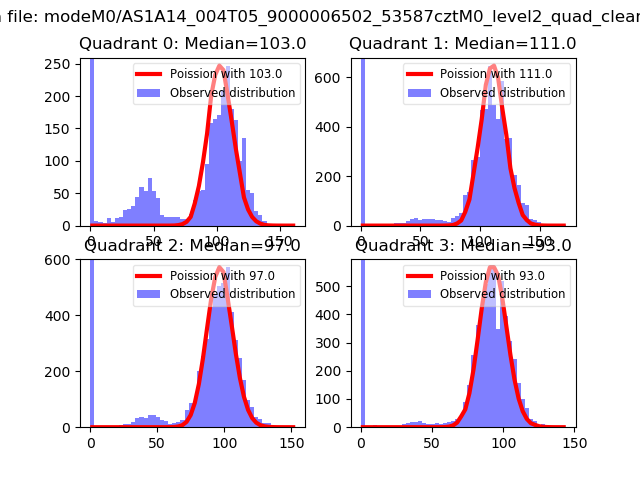 |
 |
| Quadrant-wise count rates Data is divided into 100 sec bins |
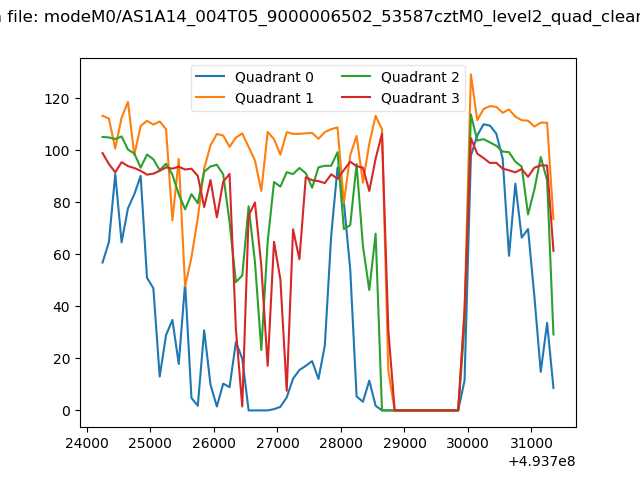 |
|
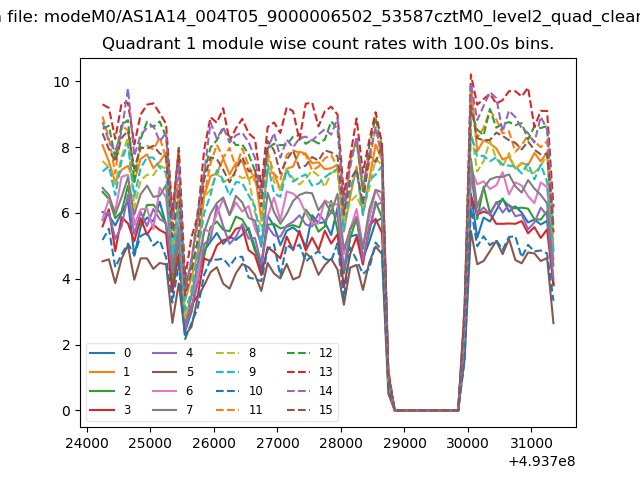
| Module-wise count rates for Quadrant A Data is divided into 100 sec bins |
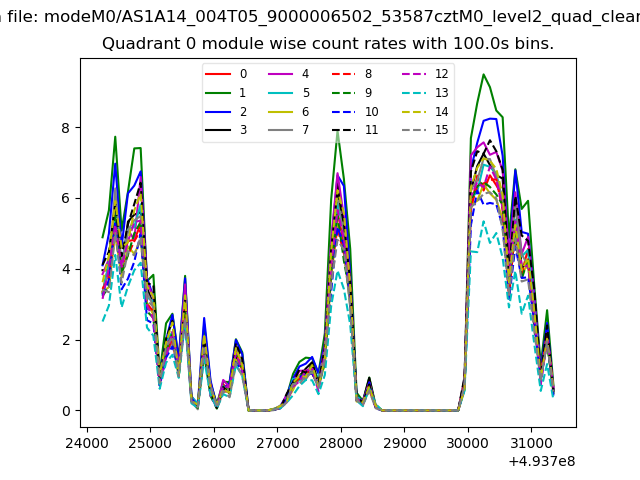 |
 |
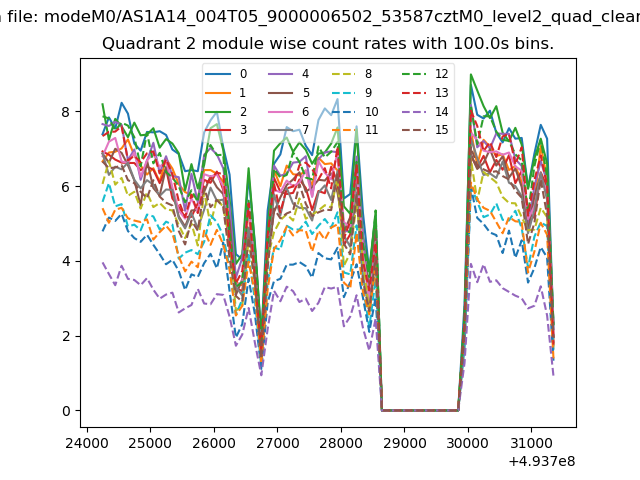
| Module-wise count rates for Quadrant B Data is divided into 100 sec bins |
 |
 |
| Module-wise count rates for Quadrant C Data is divided into 100 sec bins |
 |
 |
| Module-wise count rates for Quadrant D Data is divided into 100 sec bins |
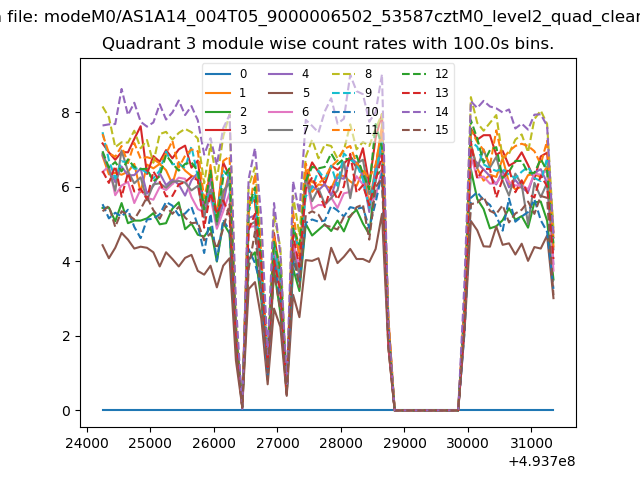 |
 |
| Parameter | Plot |
|---|---|
| CZT HV Monitor |  |
| D_VDD | 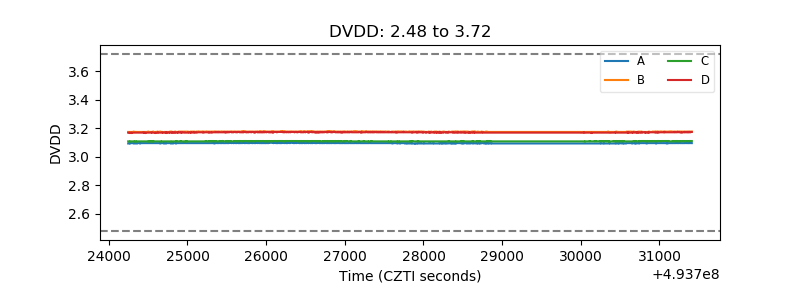 |
| Temperature 1 | 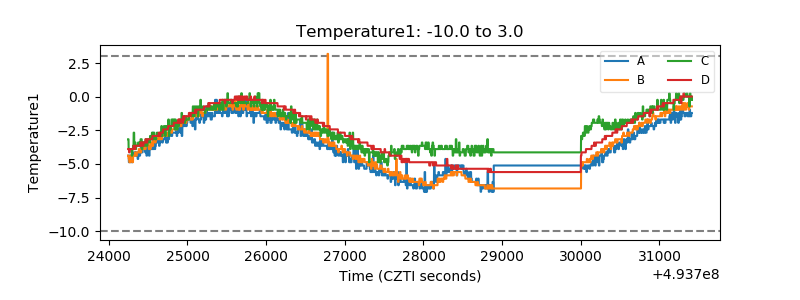 |
| Veto HV Monitor | 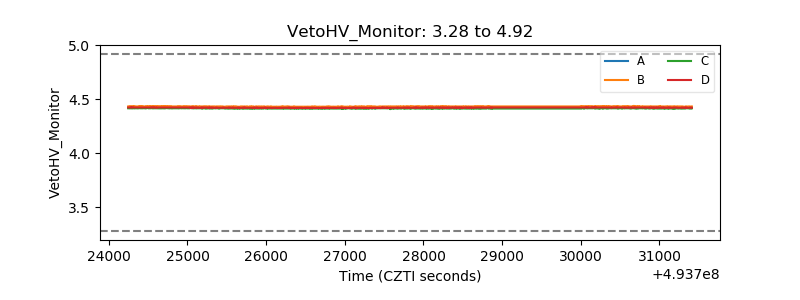 |
| Veto LLD | 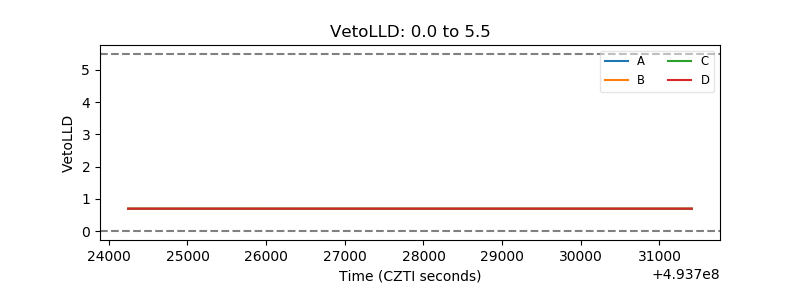 |
| Alpha Counter | 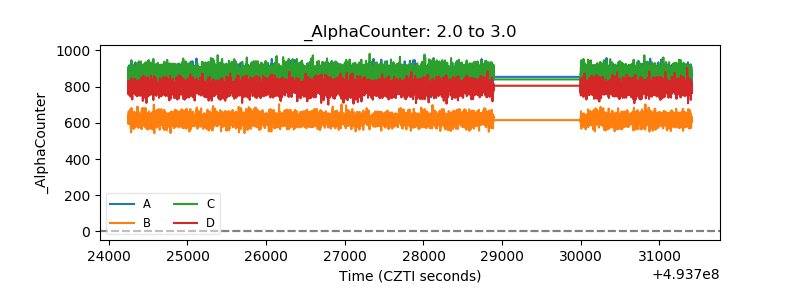 |
| _CPM_Rate | 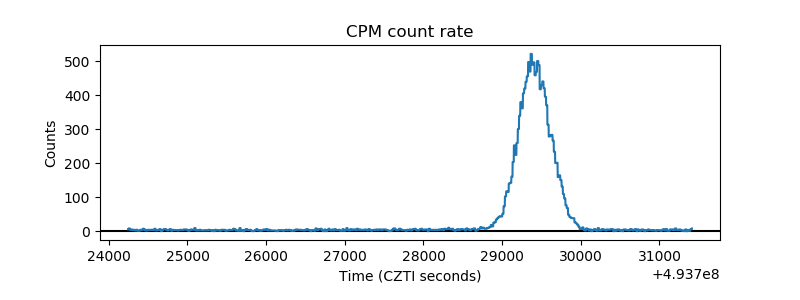 |
| CZT Counter | 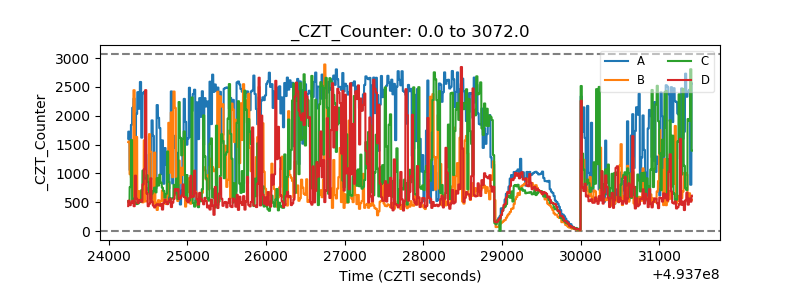 |
| +2.5 Volts monitor | 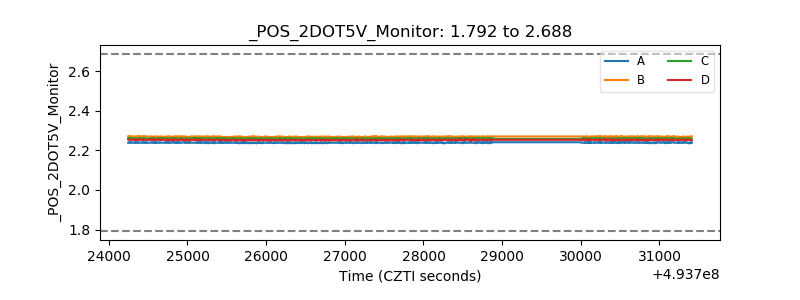 |
| +5 Volts monitor |  |
| _ROLL_ROT | 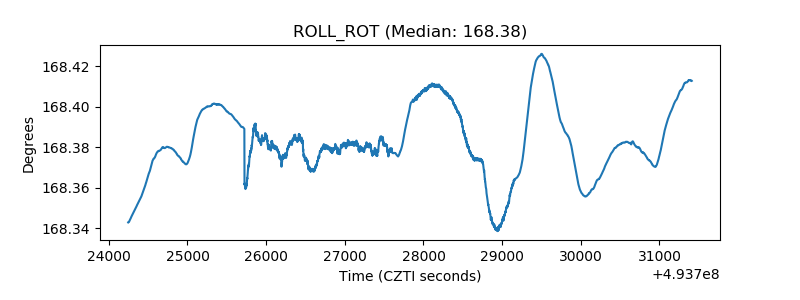 |
| _Roll_DEC | 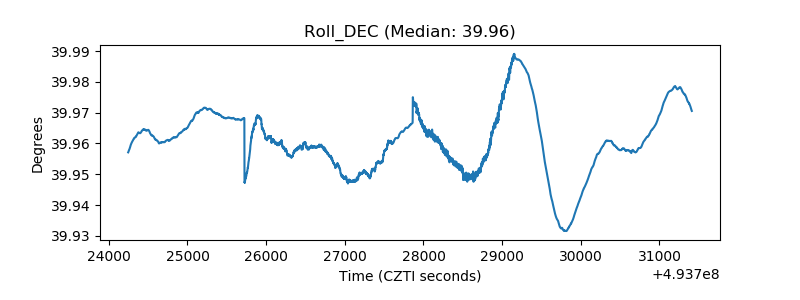 |
| _Roll_RA | 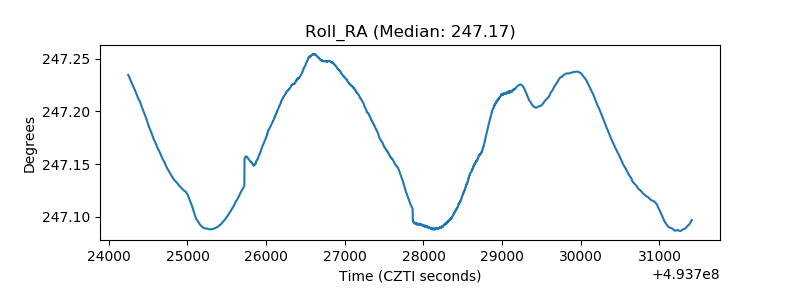 |
| Veto Counter | 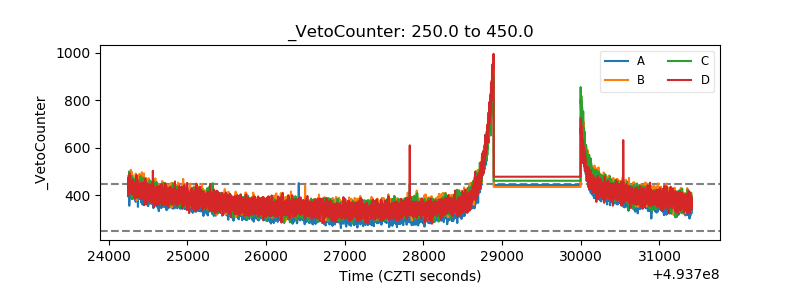 |