| Param | Original file | Final file |
|---|---|---|
| Filename | modeM0/AS1A14_004T05_9000006502_53588cztM0_level2.fits | modeM0/AS1A14_004T05_9000006502_53588cztM0_level2_quad_clean.evt |
| Size (bytes) | 930,349,440 | 78,802,560 |
| Size | 887.3 MB | 75.2 MB |
| Events in quadrant A | 10,148,868 | 420,221 |
| Events in quadrant B | 5,250,920 | 682,157 |
| Events in quadrant C | 8,474,462 | 515,231 |
| Events in quadrant D | 10,050,721 | 304,529 |
| Mode M9 | |||
|---|---|---|---|
| Quadrant | BADHDUFLAG | Total packets | Discarded packets |
| A | 0 | 10 | 0 |
| B | 0 | 10 | 0 |
| C | 0 | 10 | 0 |
| D | 0 | 10 | 0 |
| Mode SS | |||
|---|---|---|---|
| Quadrant | BADHDUFLAG | Total packets | Discarded packets |
| A | 0 | 136 | 0 |
| B | 0 | 136 | 0 |
| C | 0 | 136 | 0 |
| D | 0 | 136 | 0 |
| Mode M0 | |||
|---|---|---|---|
| Quadrant | BADHDUFLAG | Total packets | Discarded packets |
| A | 0 | 34677 | 2 |
| B | 0 | 20111 | 1 |
| C | 0 | 29784 | 1 |
| D | 0 | 34322 | 1 |
| Quadrant | Total seconds | Saturated seconds | Saturation percentage |
|---|---|---|---|
| A | 6643 | 2866 | 43.143158% |
| B | 6643 | 493 | 7.421346% |
| C | 6644 | 1504 | 22.636966% |
| D | 6644 | 3536 | 53.220951% |
Noise dominated data is calculated using 1-second bins in cleaned event files. If a bin has >2000 counts, and if more than 50% of those come from <1% of pixels, then it is considered to be noise-dominated and hence unusable.
| Quadrant | # 1 sec bins | Bins with >0 counts | Bins with >2000 counts | High rate bins dominated by noise | Noise dominated (total time) | Noise dominated (detector-on time) | Marked lightcurve |
|---|---|---|---|---|---|---|---|
| A | 7673 | 6644 | 2215 | 2215 | 28.87% | 33.34% | 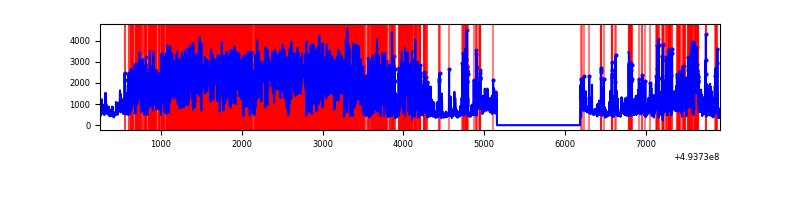 |
| B | 7673 | 6644 | 291 | 291 | 3.79% | 4.38% | 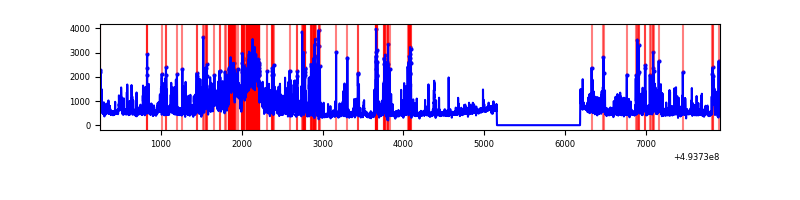 |
| C | 7674 | 6644 | 1175 | 1175 | 15.31% | 17.69% | 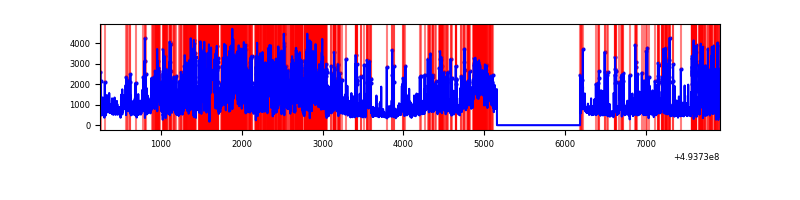 |
| D | 7673 | 6644 | 2419 | 2419 | 31.53% | 36.41% | 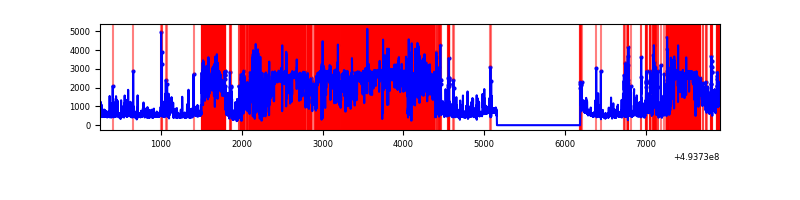 |
Top three noisy pixels from each quadrant. If the there are fewer than three noisy pixels in the level2.evt file, extra rows are filled as -1
| Pixel properties | Quadrant properties | ||||||
|---|---|---|---|---|---|---|---|
| Quadrant | DetID | PixID | Counts | Sigma | Mean | Median | Sigma |
| A | 3 | 62 | 6374183 | 40956.89 | 624 | 608 | 155.6 |
| A | 3 | 63 | 450311 | 2889.81 | 624 | 608 | 155.6 |
| A | 4 | 239 | 354357 | 2273.21 | 624 | 608 | 155.6 |
| B | 10 | 28 | 916361 | 5951.22 | 727 | 702 | 153.9 |
| B | 4 | 206 | 515493 | 3345.83 | 727 | 702 | 153.9 |
| B | 5 | 185 | 306957 | 1990.47 | 727 | 702 | 153.9 |
| C | 13 | 3 | 1795620 | 9799.93 | 662 | 656 | 183.2 |
| C | 15 | 224 | 1710223 | 9333.69 | 662 | 656 | 183.2 |
| C | 1 | 241 | 490387 | 2673.78 | 662 | 656 | 183.2 |
| D | 8 | 176 | 7277398 | 55357.49 | 461 | 440 | 131.5 |
| D | 7 | 70 | 188769 | 1432.66 | 461 | 440 | 131.5 |
| D | 13 | 153 | 176200 | 1337.04 | 461 | 440 | 131.5 |
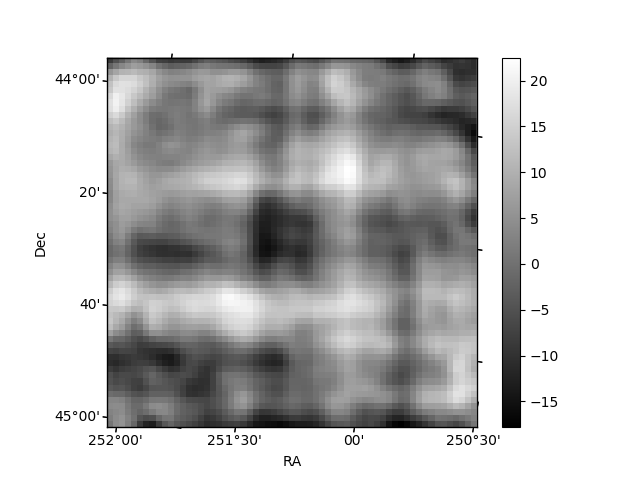
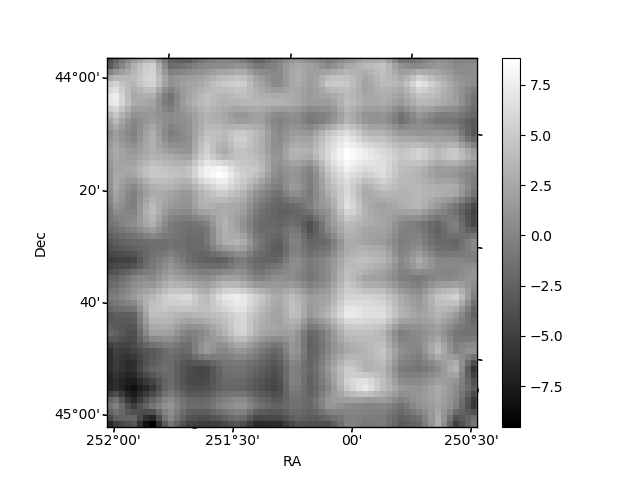
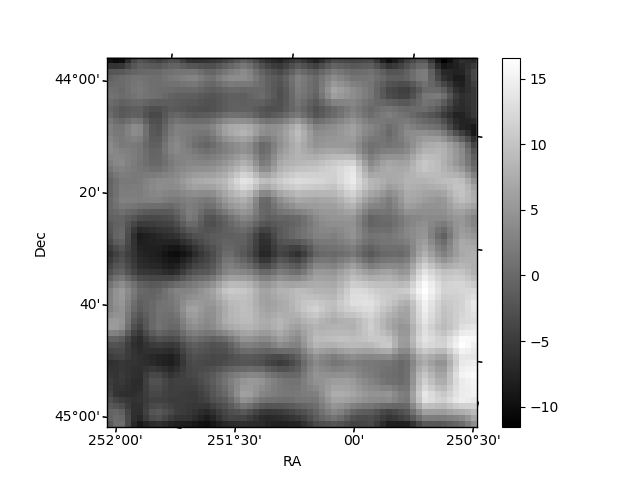
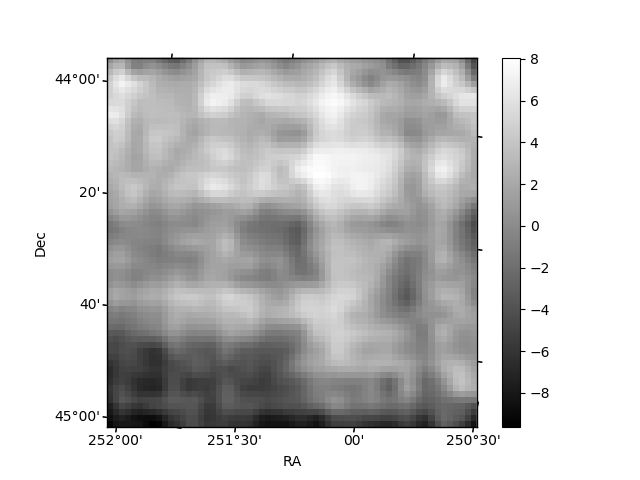
Histogram calculated using DETX and DETY for each event in the final _common_clean file
| Quadrant A | 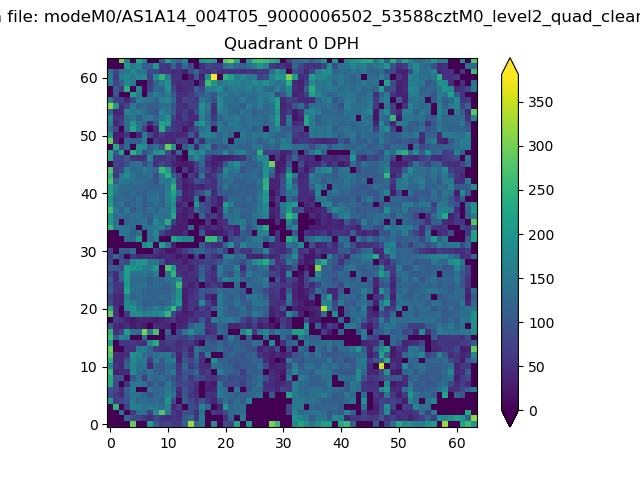 |
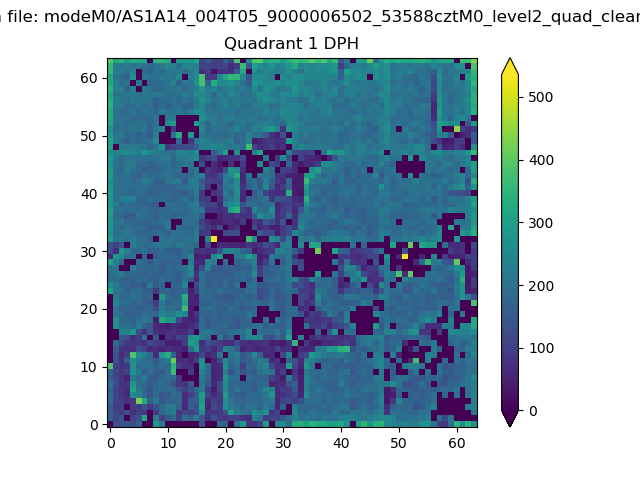 |
Quadrant B |
|---|---|---|---|
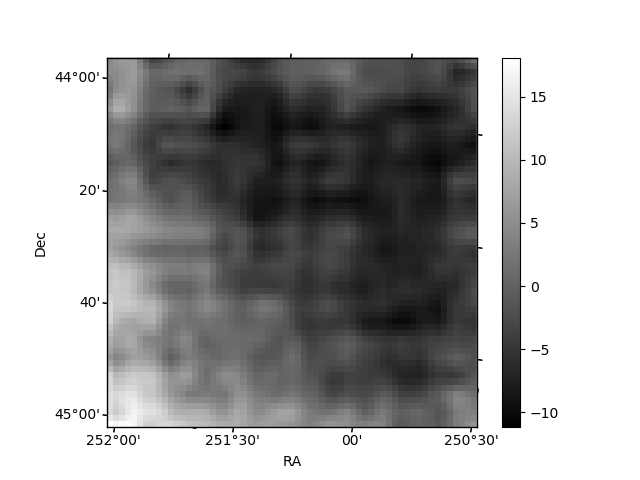
| Quadrant D | 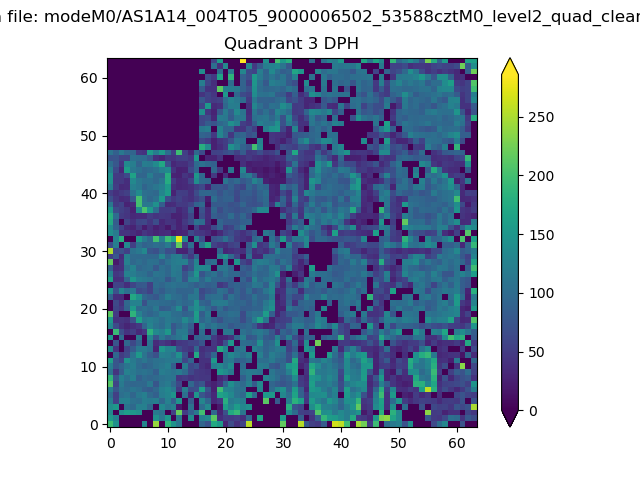 |
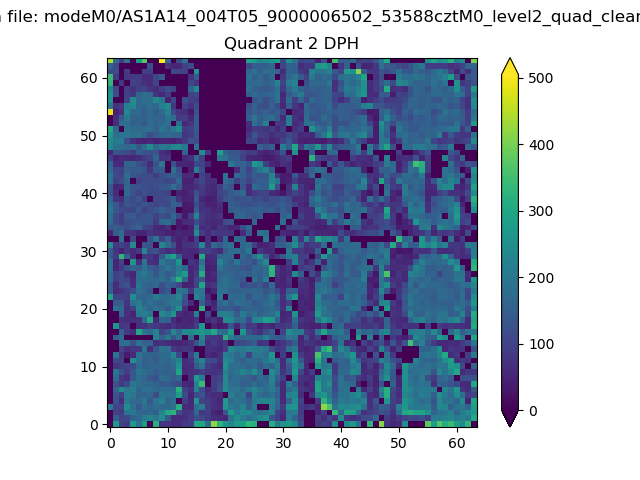 |
Quadrant C |
| Plot type | Count rate plots | Images |
|---|---|---|
| Comparison with Poisson distribution Blue bars denote a histogram of data divided into 1 sec bins. Red curve is a Poisson curve with rate = median count rate of data. |
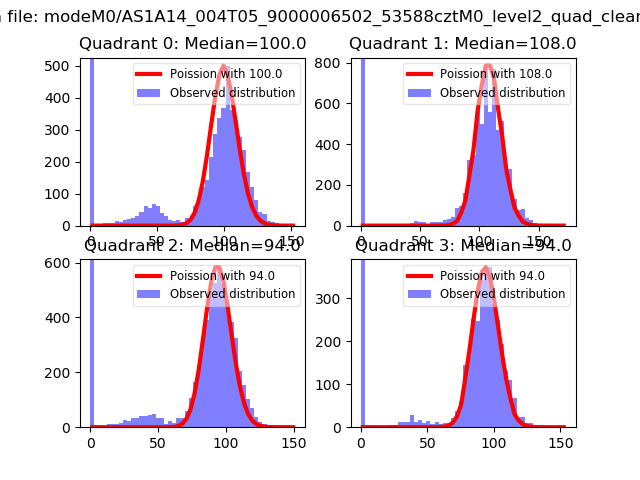 |
 |
| Quadrant-wise count rates Data is divided into 100 sec bins |
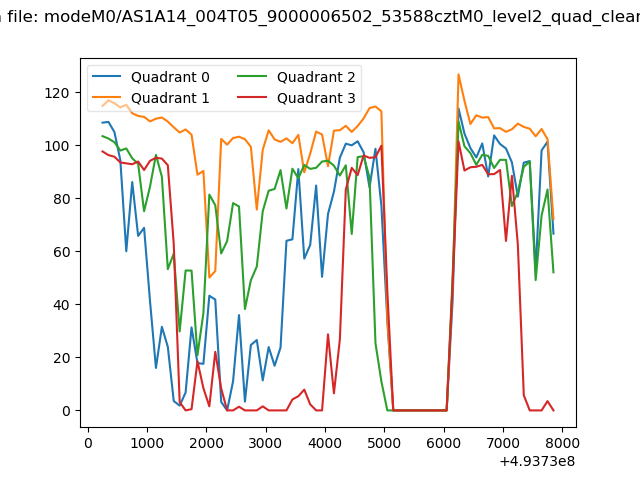 |
|
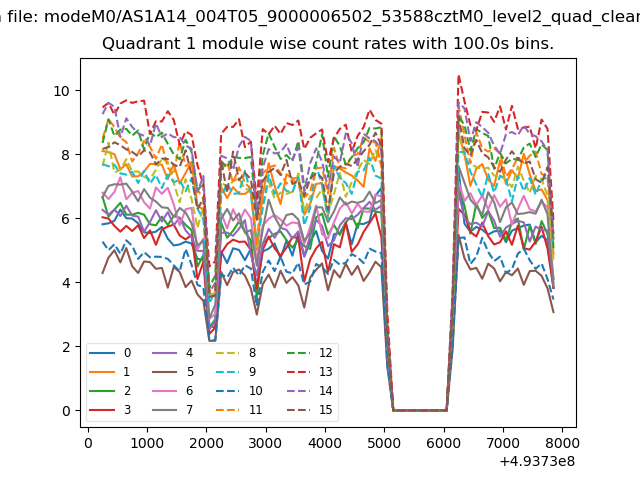
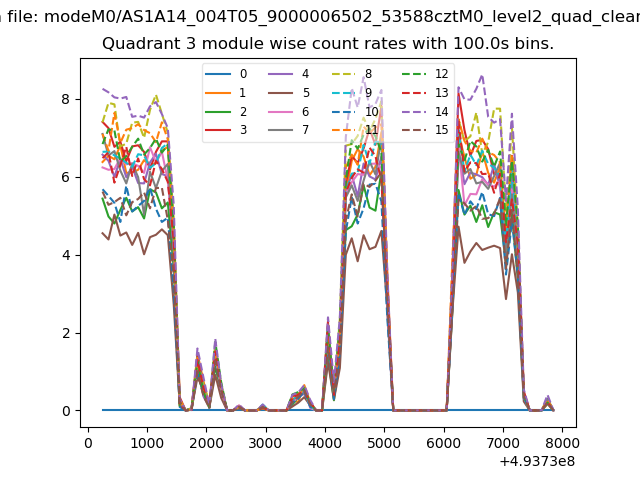
| Module-wise count rates for Quadrant A Data is divided into 100 sec bins |
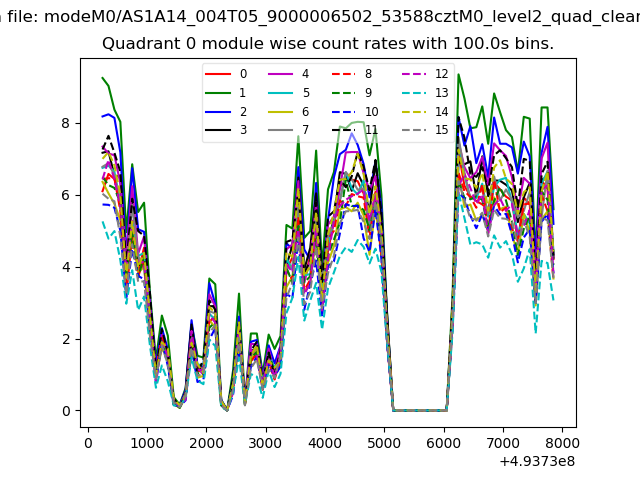 |
 |
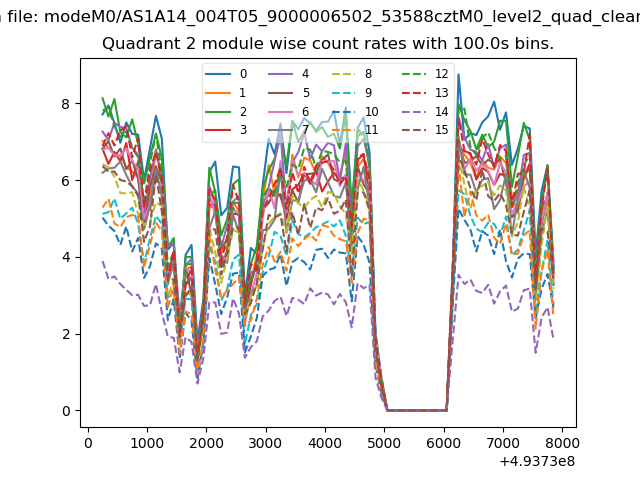
| Module-wise count rates for Quadrant B Data is divided into 100 sec bins |
 |
 |
| Module-wise count rates for Quadrant C Data is divided into 100 sec bins |
 |
 |
| Module-wise count rates for Quadrant D Data is divided into 100 sec bins |
 |
 |
| Parameter | Plot |
|---|---|
| CZT HV Monitor | 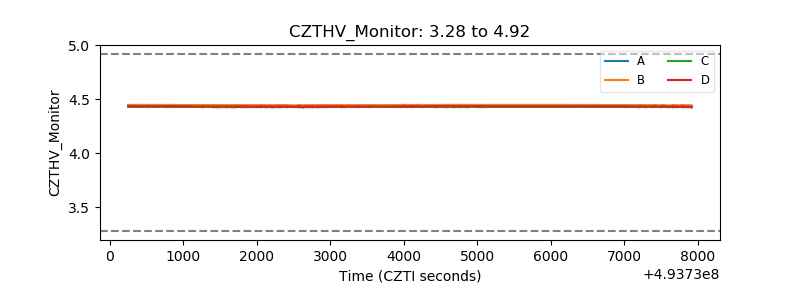 |
| D_VDD | 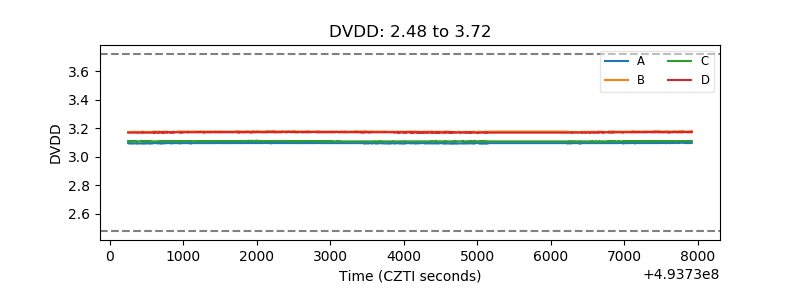 |
| Temperature 1 | 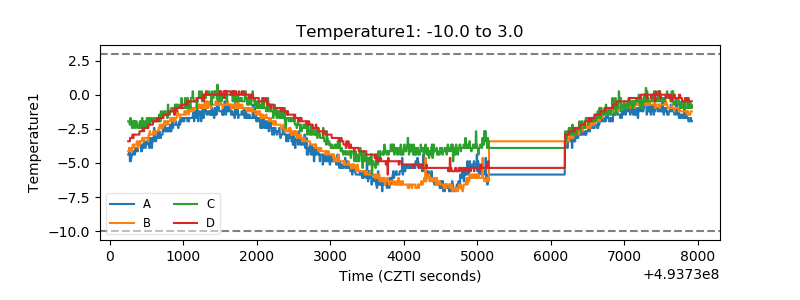 |
| Veto HV Monitor | 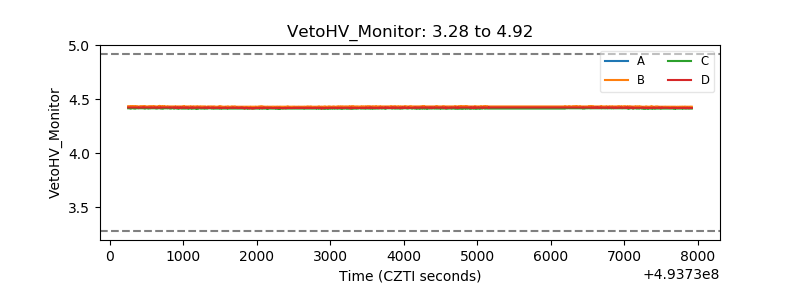 |
| Veto LLD | 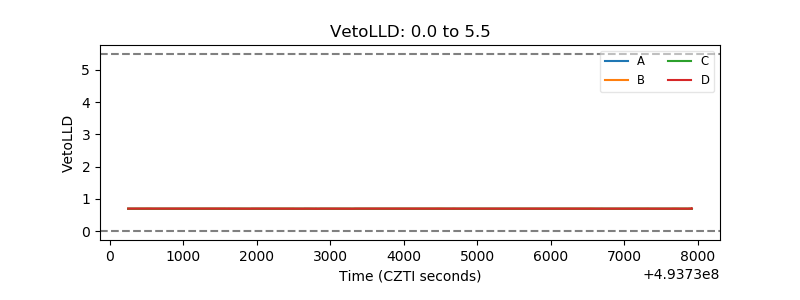 |
| Alpha Counter | 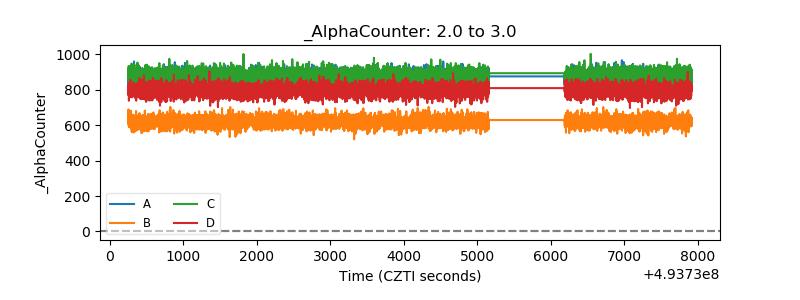 |
| _CPM_Rate | 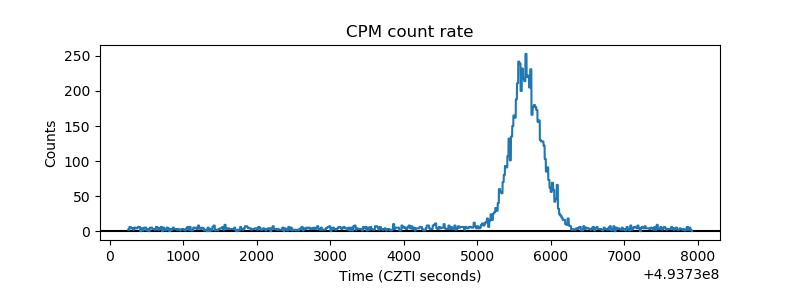 |
| CZT Counter | 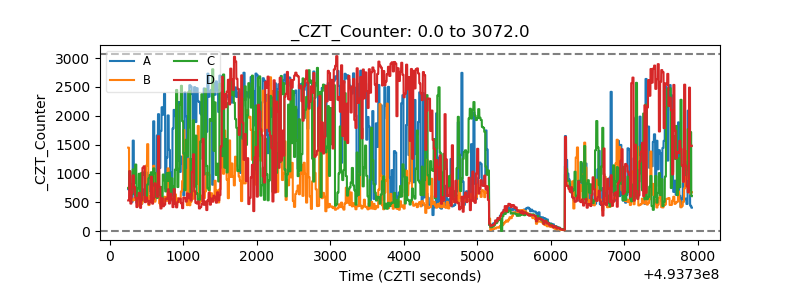 |
| +2.5 Volts monitor |  |
| +5 Volts monitor |  |
| _ROLL_ROT | 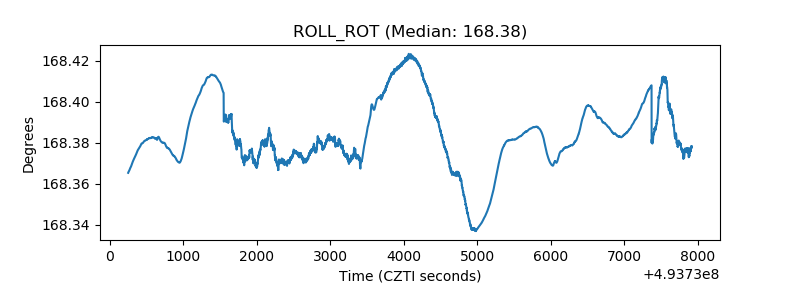 |
| _Roll_DEC | 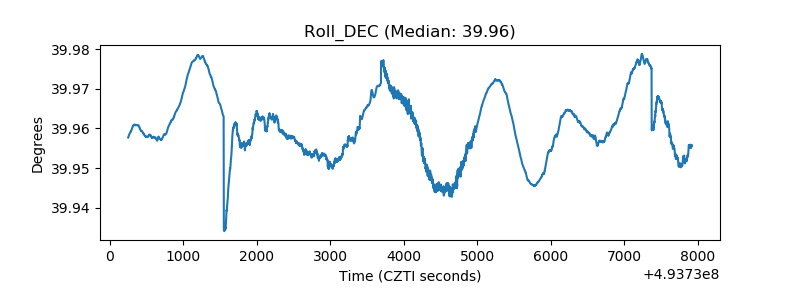 |
| _Roll_RA | 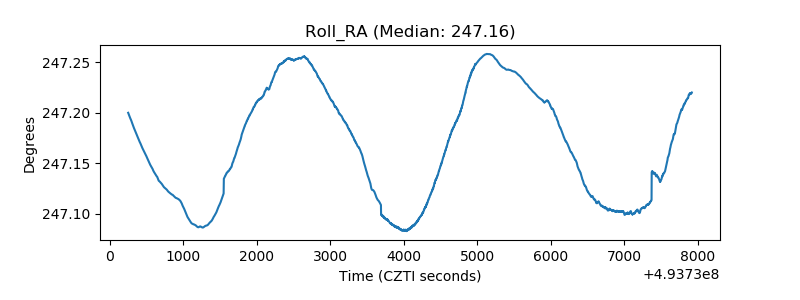 |
| Veto Counter | 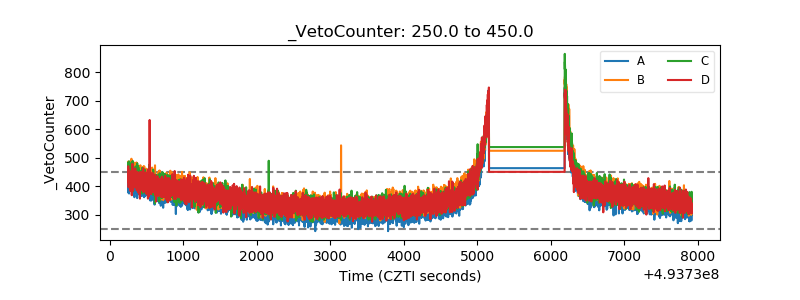 |