| Param | Original file | Final file |
|---|---|---|
| Filename | modeM0/AS1A14_004T05_9000006502_53589cztM0_level2.fits | modeM0/AS1A14_004T05_9000006502_53589cztM0_level2_quad_clean.evt |
| Size (bytes) | 819,417,600 | 78,206,400 |
| Size | 781.5 MB | 74.6 MB |
| Events in quadrant A | 6,633,560 | 573,706 |
| Events in quadrant B | 4,635,265 | 649,241 |
| Events in quadrant C | 8,123,580 | 462,689 |
| Events in quadrant D | 10,438,817 | 231,879 |
| Mode M9 | |||
|---|---|---|---|
| Quadrant | BADHDUFLAG | Total packets | Discarded packets |
| A | 0 | 9 | 0 |
| B | 0 | 9 | 0 |
| C | 0 | 9 | 0 |
| D | 0 | 9 | 0 |
| Mode SS | |||
|---|---|---|---|
| Quadrant | BADHDUFLAG | Total packets | Discarded packets |
| A | 0 | 128 | 0 |
| B | 0 | 128 | 0 |
| C | 0 | 128 | 0 |
| D | 0 | 128 | 0 |
| Mode M0 | |||
|---|---|---|---|
| Quadrant | BADHDUFLAG | Total packets | Discarded packets |
| A | 0 | 24205 | 1 |
| B | 0 | 18160 | 1 |
| C | 0 | 28584 | 1 |
| D | 0 | 35534 | 1 |
| Quadrant | Total seconds | Saturated seconds | Saturation percentage |
|---|---|---|---|
| A | 6462 | 886 | 13.710925% |
| B | 6462 | 374 | 5.787682% |
| C | 6463 | 1824 | 28.222188% |
| D | 6463 | 4070 | 62.973851% |
Noise dominated data is calculated using 1-second bins in cleaned event files. If a bin has >2000 counts, and if more than 50% of those come from <1% of pixels, then it is considered to be noise-dominated and hence unusable.
| Quadrant | # 1 sec bins | Bins with >0 counts | Bins with >2000 counts | High rate bins dominated by noise | Noise dominated (total time) | Noise dominated (detector-on time) | Marked lightcurve |
|---|---|---|---|---|---|---|---|
| A | 7282 | 6463 | 656 | 656 | 9.01% | 10.15% | 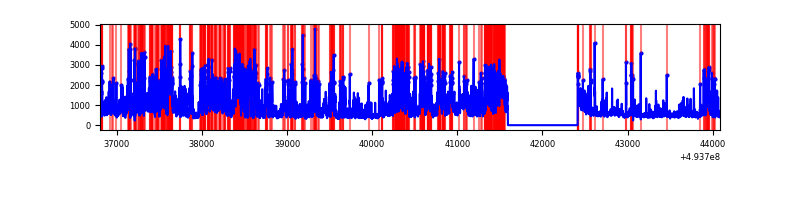 |
| B | 7282 | 6463 | 172 | 172 | 2.36% | 2.66% | 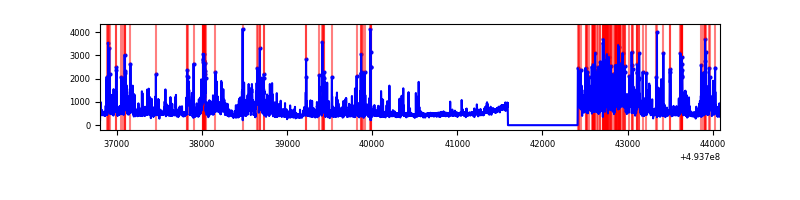 |
| C | 7283 | 6464 | 1293 | 1293 | 17.75% | 20.00% | 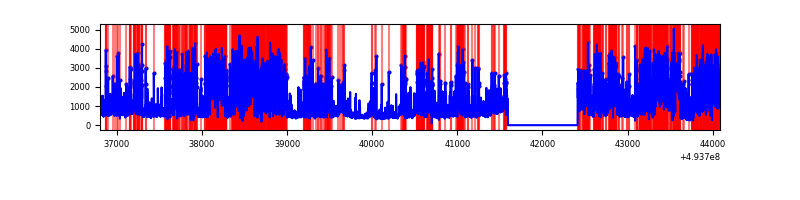 |
| D | 7283 | 6464 | 2356 | 2356 | 32.35% | 36.45% | 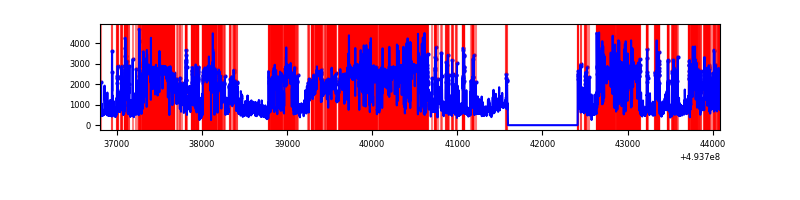 |
Top three noisy pixels from each quadrant. If the there are fewer than three noisy pixels in the level2.evt file, extra rows are filled as -1
| Pixel properties | Quadrant properties | ||||||
|---|---|---|---|---|---|---|---|
| Quadrant | DetID | PixID | Counts | Sigma | Mean | Median | Sigma |
| A | 3 | 62 | 2618712 | 15620.55 | 672 | 657 | 167.6 |
| A | 3 | 63 | 707637 | 4218.18 | 672 | 657 | 167.6 |
| A | 4 | 239 | 149813 | 889.94 | 672 | 657 | 167.6 |
| B | 4 | 206 | 672948 | 4610.15 | 686 | 662 | 145.8 |
| B | 10 | 28 | 411432 | 2816.82 | 686 | 662 | 145.8 |
| B | 5 | 185 | 257408 | 1760.62 | 686 | 662 | 145.8 |
| C | 15 | 224 | 3586349 | 21659.07 | 599 | 594 | 165.6 |
| C | 4 | 5 | 668236 | 4032.76 | 599 | 594 | 165.6 |
| C | 10 | 22 | 304319 | 1834.59 | 599 | 594 | 165.6 |
| D | 8 | 176 | 8264649 | 77698.15 | 367 | 349 | 106.4 |
| D | 7 | 70 | 158083 | 1482.96 | 367 | 349 | 106.4 |
| D | 2 | 153 | 133894 | 1255.54 | 367 | 349 | 106.4 |
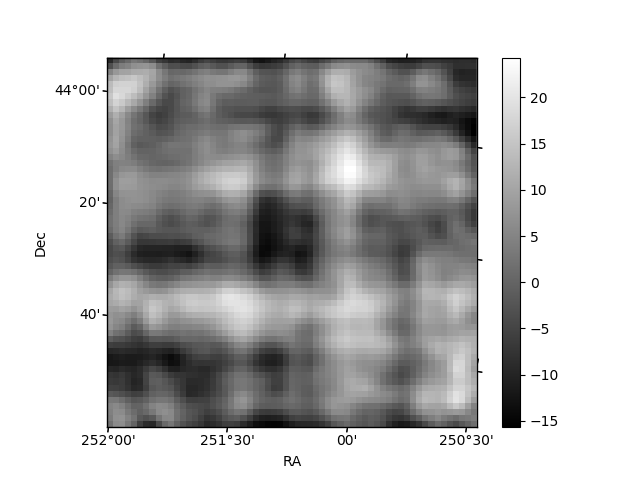
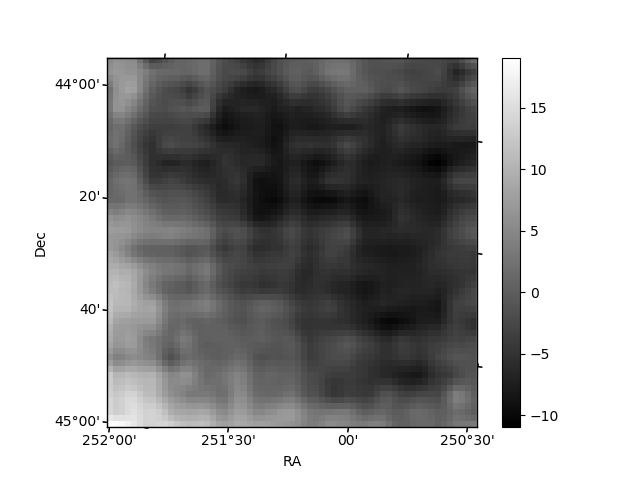
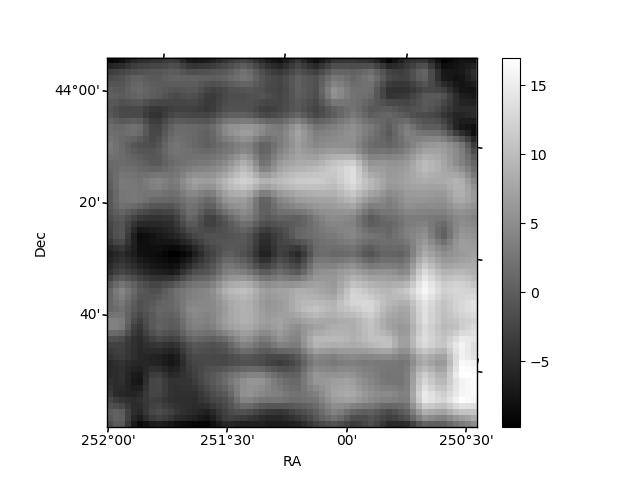
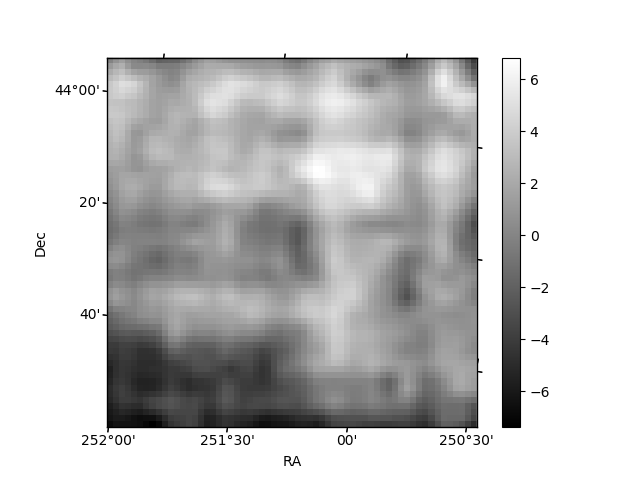
Histogram calculated using DETX and DETY for each event in the final _common_clean file
| Quadrant A | 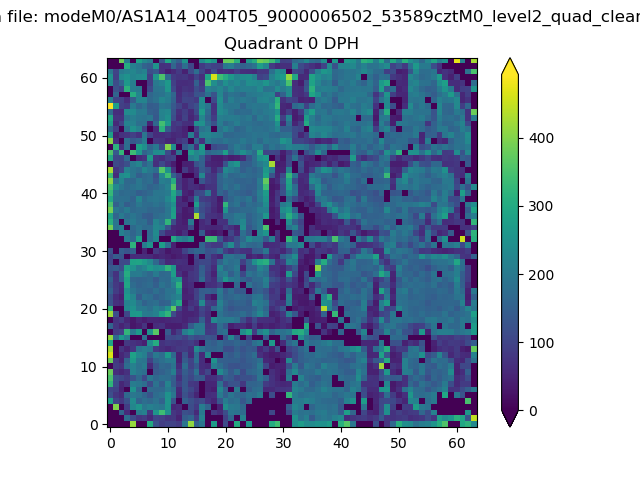 |
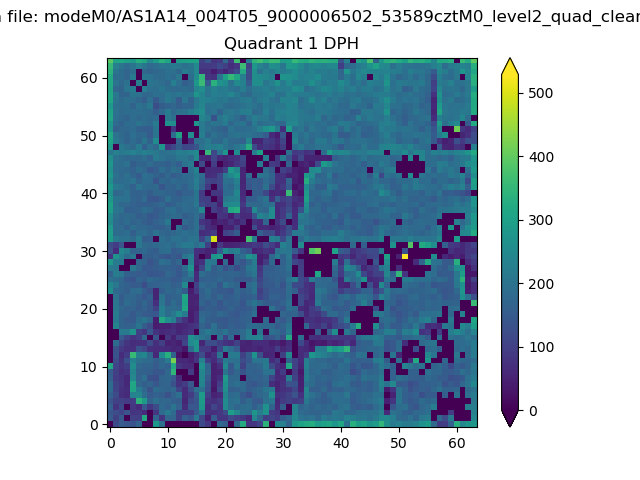 |
Quadrant B |
|---|---|---|---|
| Quadrant D | 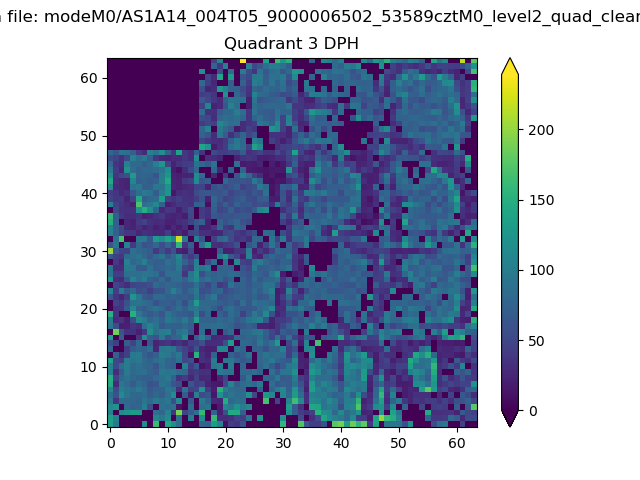 |
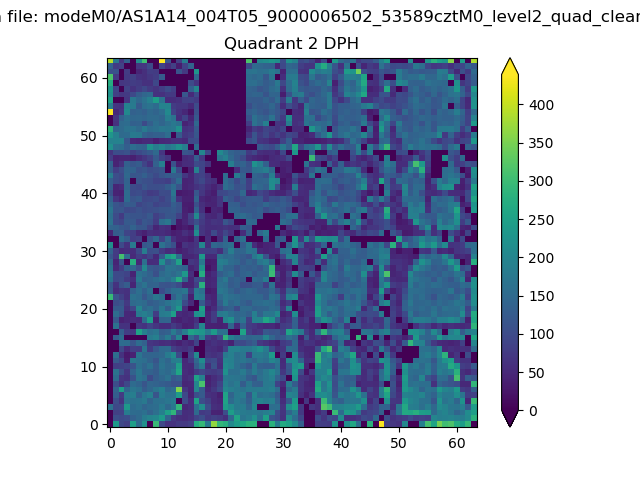 |
Quadrant C |
| Plot type | Count rate plots | Images |
|---|---|---|
| Comparison with Poisson distribution Blue bars denote a histogram of data divided into 1 sec bins. Red curve is a Poisson curve with rate = median count rate of data. |
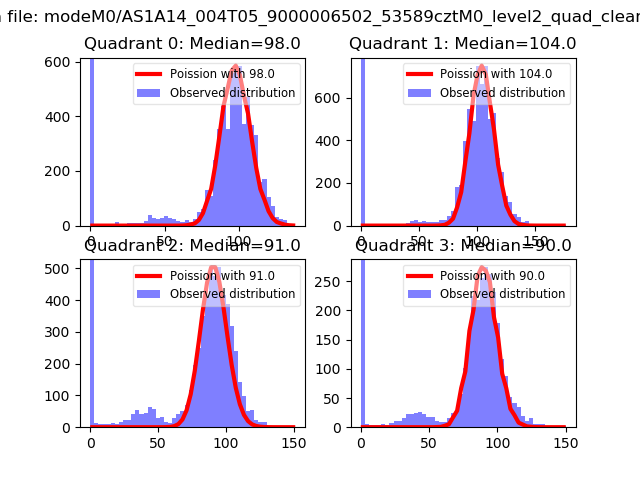 |
 |
| Quadrant-wise count rates Data is divided into 100 sec bins |
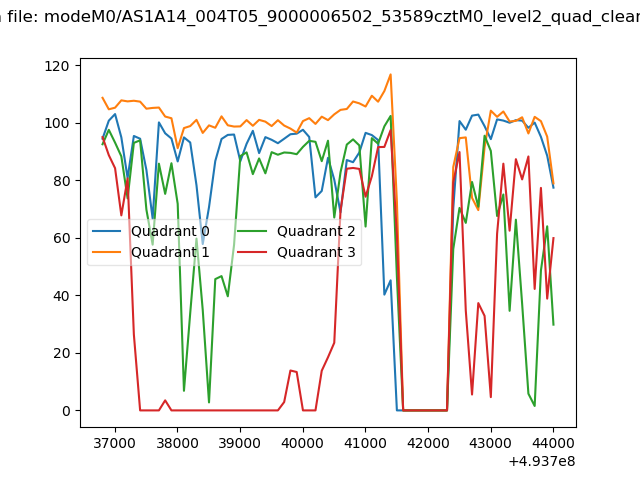 |
|
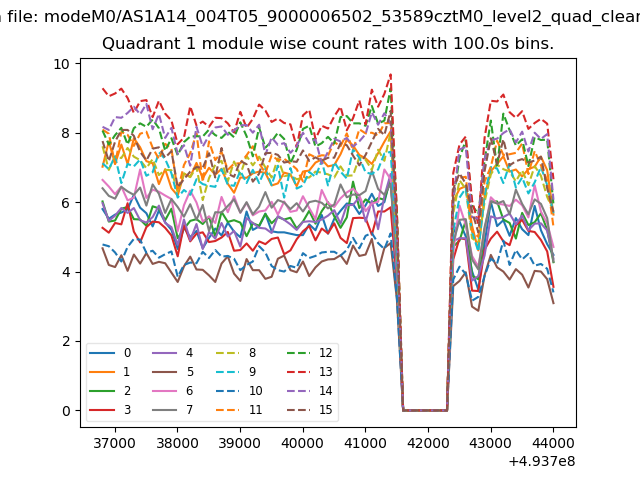
| Module-wise count rates for Quadrant A Data is divided into 100 sec bins |
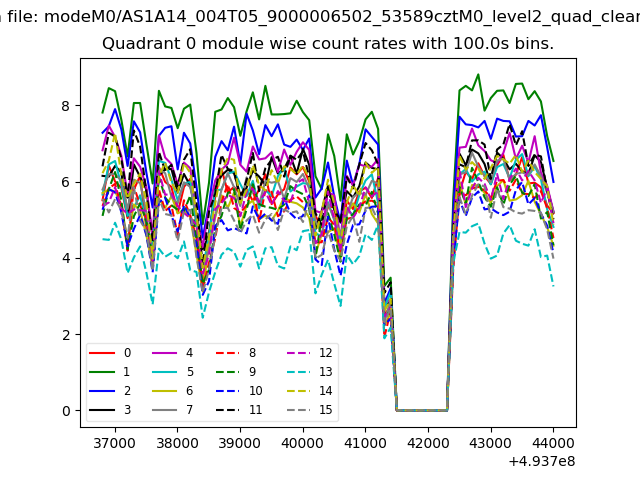 |
 |
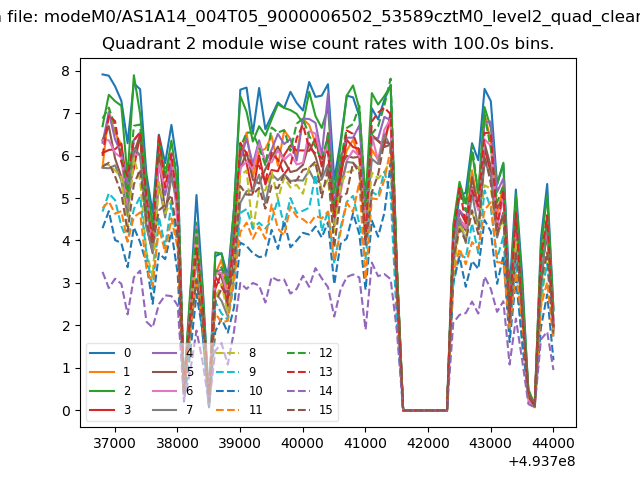
| Module-wise count rates for Quadrant B Data is divided into 100 sec bins |
 |
 |
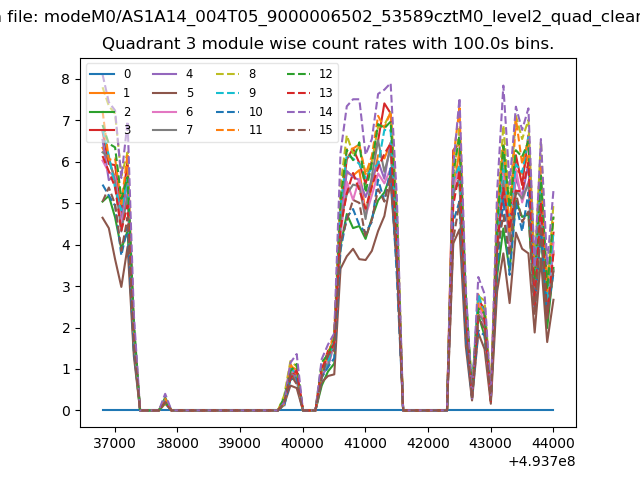
| Module-wise count rates for Quadrant C Data is divided into 100 sec bins |
 |
 |
| Module-wise count rates for Quadrant D Data is divided into 100 sec bins |
 |
 |
| Parameter | Plot |
|---|---|
| CZT HV Monitor | 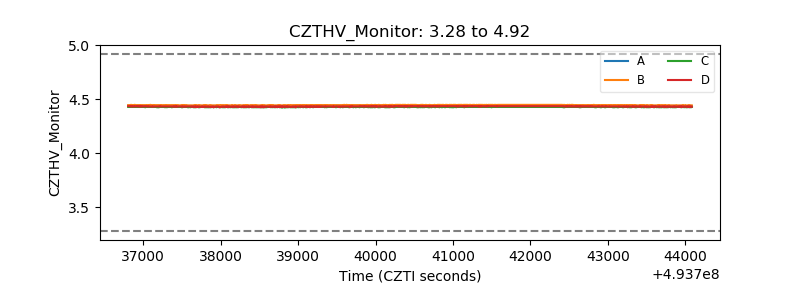 |
| D_VDD | 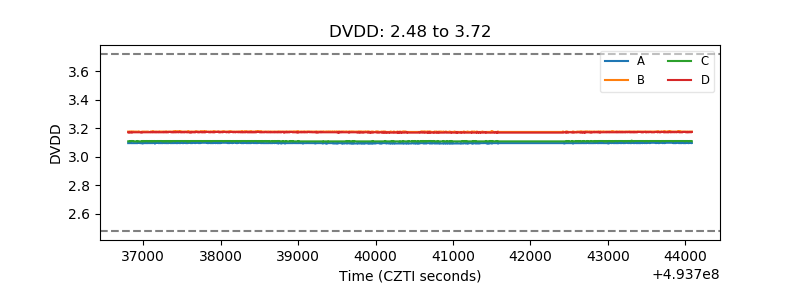 |
| Temperature 1 | 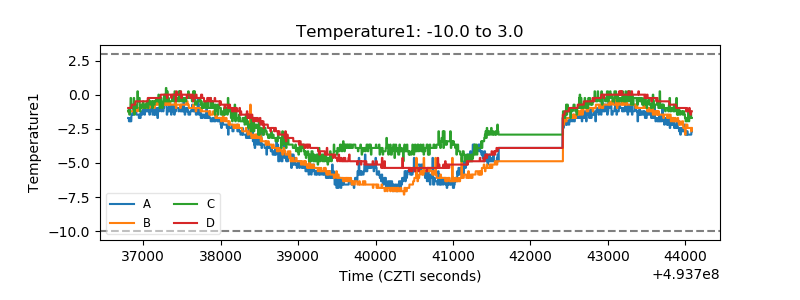 |
| Veto HV Monitor |  |
| Veto LLD | 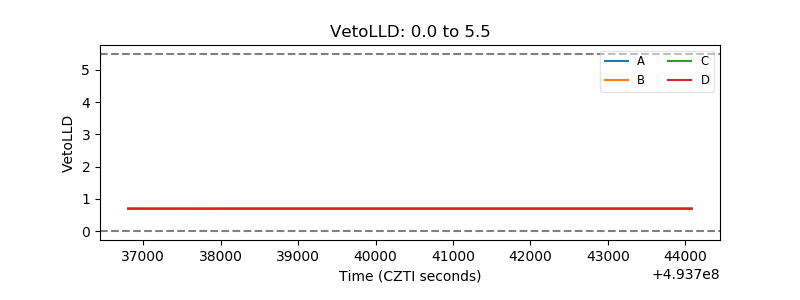 |
| Alpha Counter | 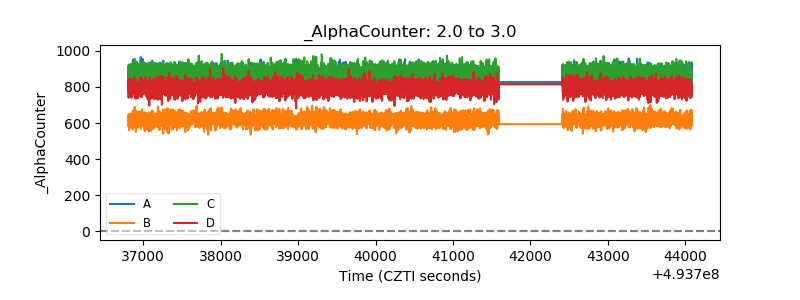 |
| _CPM_Rate | 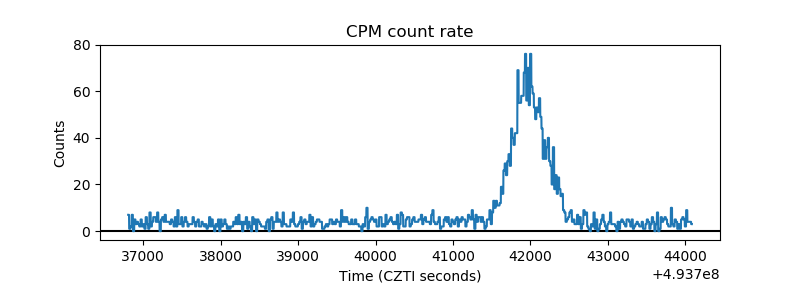 |
| CZT Counter | 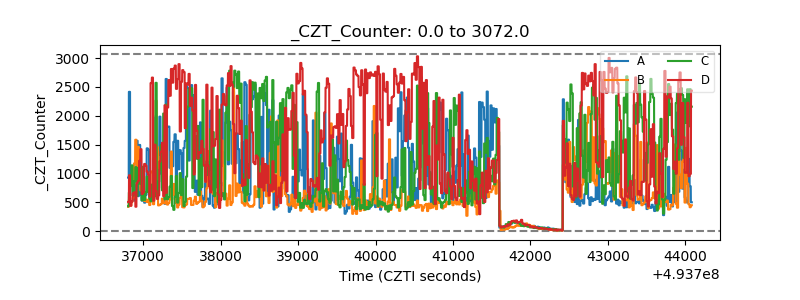 |
| +2.5 Volts monitor |  |
| +5 Volts monitor |  |
| _ROLL_ROT | 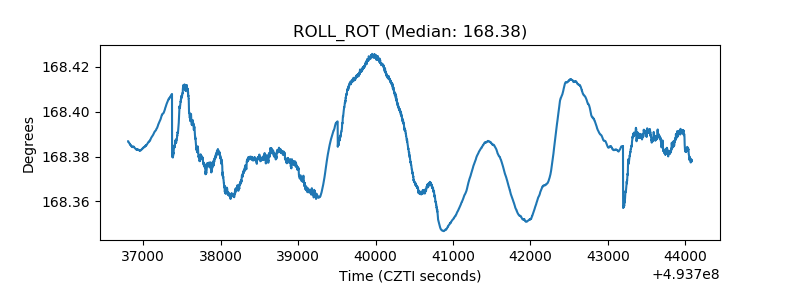 |
| _Roll_DEC | 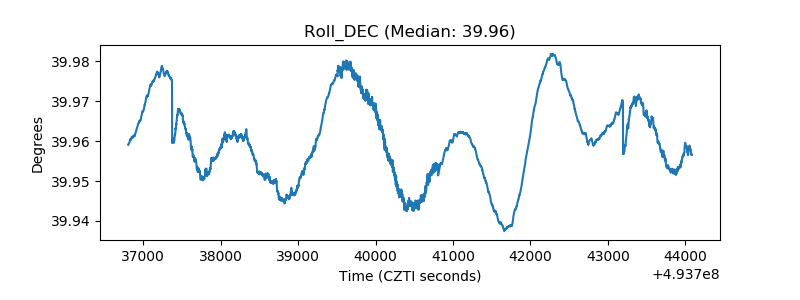 |
| _Roll_RA | 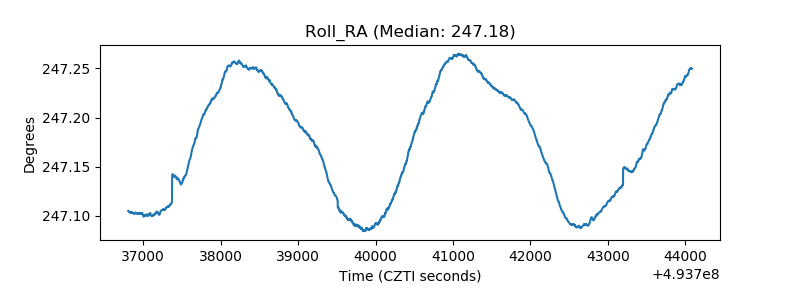 |
| Veto Counter | 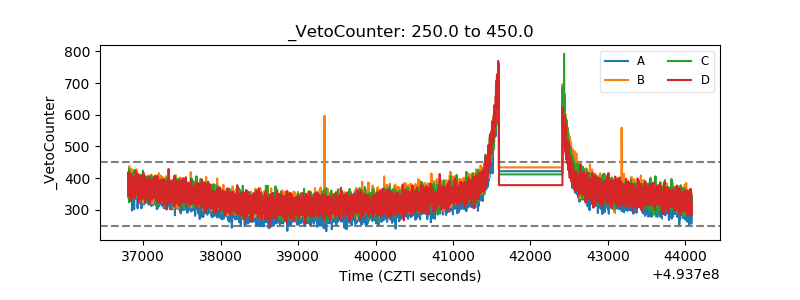 |