| Param | Original file | Final file |
|---|---|---|
| Filename | modeM0/AS1A14_004T05_9000006502_53590cztM0_level2.fits | modeM0/AS1A14_004T05_9000006502_53590cztM0_level2_quad_clean.evt |
| Size (bytes) | 1,038,355,200 | 79,770,240 |
| Size | 990.3 MB | 76.1 MB |
| Events in quadrant A | 11,032,025 | 404,306 |
| Events in quadrant B | 6,192,225 | 667,089 |
| Events in quadrant C | 11,047,059 | 403,356 |
| Events in quadrant D | 9,616,179 | 445,052 |
| Mode M9 | |||
|---|---|---|---|
| Quadrant | BADHDUFLAG | Total packets | Discarded packets |
| A | 0 | 3 | 0 |
| B | 0 | 3 | 0 |
| C | 0 | 3 | 0 |
| D | 0 | 3 | 0 |
| Mode SS | |||
|---|---|---|---|
| Quadrant | BADHDUFLAG | Total packets | Discarded packets |
| A | 0 | 146 | 0 |
| B | 0 | 146 | 0 |
| C | 0 | 146 | 0 |
| D | 0 | 146 | 0 |
| Mode M0 | |||
|---|---|---|---|
| Quadrant | BADHDUFLAG | Total packets | Discarded packets |
| A | 0 | 37622 | 1 |
| B | 0 | 23330 | 1 |
| C | 0 | 37749 | 1 |
| D | 0 | 33519 | 4 |
| Quadrant | Total seconds | Saturated seconds | Saturation percentage |
|---|---|---|---|
| A | 7108 | 3256 | 45.807541% |
| B | 7109 | 817 | 11.492474% |
| C | 7109 | 3148 | 44.281896% |
| D | 7108 | 2318 | 32.611142% |
Noise dominated data is calculated using 1-second bins in cleaned event files. If a bin has >2000 counts, and if more than 50% of those come from <1% of pixels, then it is considered to be noise-dominated and hence unusable.
| Quadrant | # 1 sec bins | Bins with >0 counts | Bins with >2000 counts | High rate bins dominated by noise | Noise dominated (total time) | Noise dominated (detector-on time) | Marked lightcurve |
|---|---|---|---|---|---|---|---|
| A | 7387 | 7108 | 2584 | 2584 | 34.98% | 36.35% | 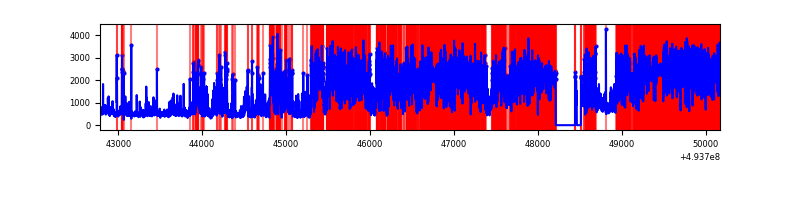 |
| B | 7389 | 7111 | 365 | 365 | 4.94% | 5.13% | 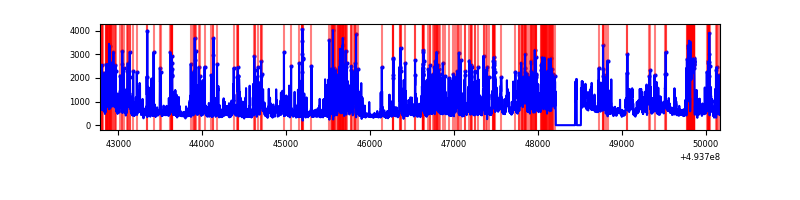 |
| C | 7389 | 7111 | 2252 | 2252 | 30.48% | 31.67% | 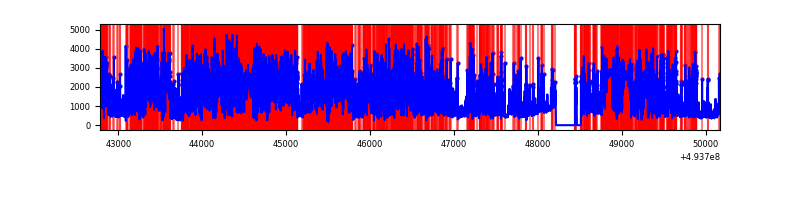 |
| D | 7387 | 7108 | 2081 | 2081 | 28.17% | 29.28% | 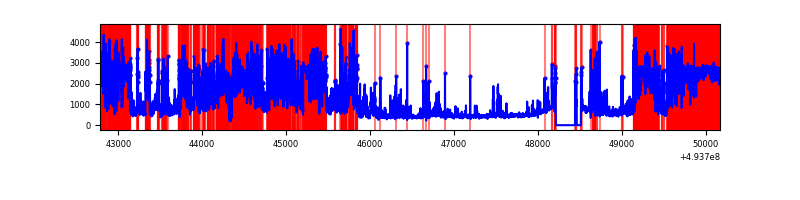 |
Top three noisy pixels from each quadrant. If the there are fewer than three noisy pixels in the level2.evt file, extra rows are filled as -1
| Pixel properties | Quadrant properties | ||||||
|---|---|---|---|---|---|---|---|
| Quadrant | DetID | PixID | Counts | Sigma | Mean | Median | Sigma |
| A | 3 | 62 | 7697354 | 49537.73 | 624 | 608 | 155.4 |
| A | 3 | 63 | 240213 | 1542.14 | 624 | 608 | 155.4 |
| A | 4 | 239 | 169284 | 1085.63 | 624 | 608 | 155.4 |
| B | 4 | 206 | 1705967 | 10730.14 | 744 | 717 | 158.9 |
| B | 5 | 185 | 483222 | 3036.12 | 744 | 717 | 158.9 |
| B | 5 | 172 | 187055 | 1172.52 | 744 | 717 | 158.9 |
| C | 4 | 5 | 4031720 | 24597.31 | 595 | 589 | 163.9 |
| C | 15 | 224 | 3633912 | 22169.95 | 595 | 589 | 163.9 |
| C | 12 | 252 | 169061 | 1027.99 | 595 | 589 | 163.9 |
| D | 8 | 176 | 5747196 | 31809.34 | 625 | 595 | 180.7 |
| D | 7 | 70 | 382475 | 2113.83 | 625 | 595 | 180.7 |
| D | 2 | 153 | 242898 | 1341.23 | 625 | 595 | 180.7 |
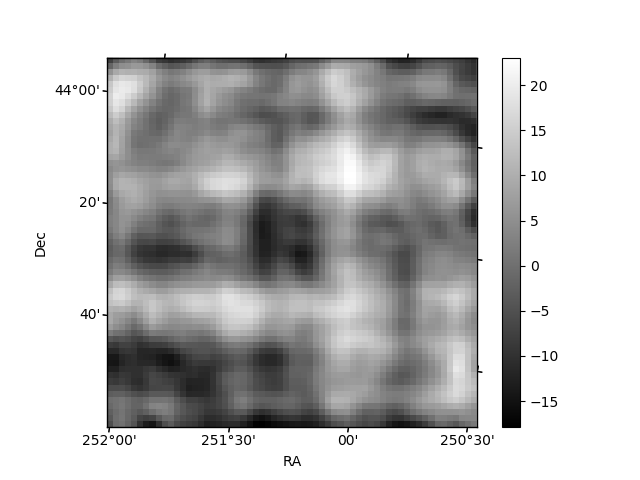
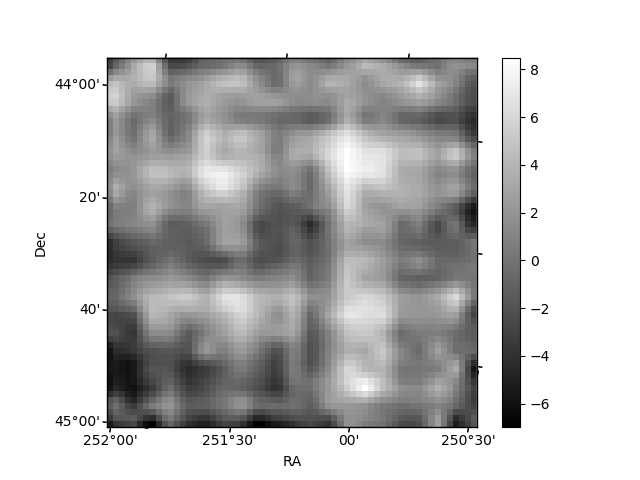
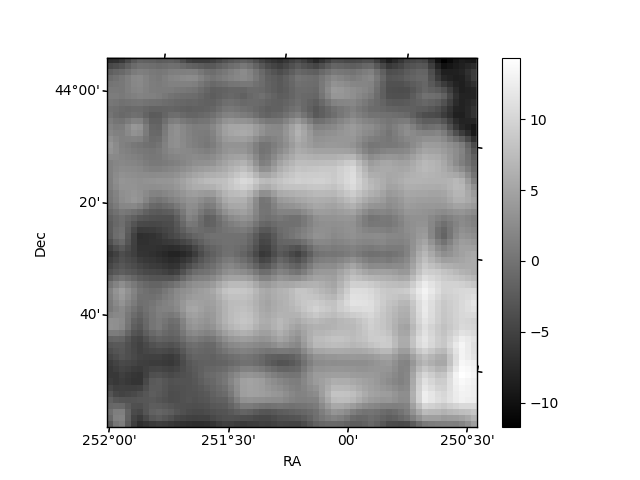
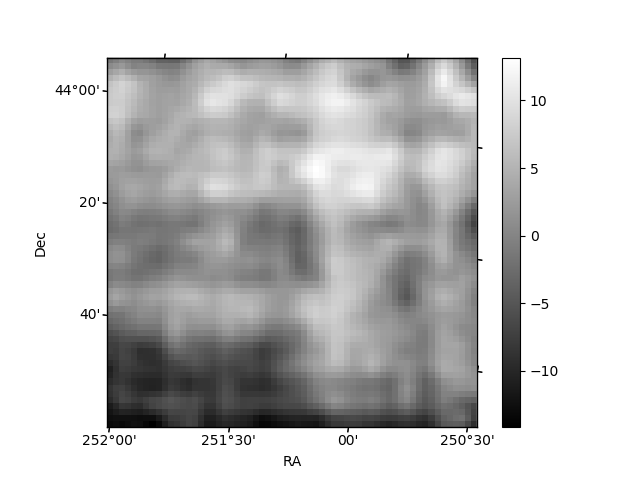
Histogram calculated using DETX and DETY for each event in the final _common_clean file
| Quadrant A | 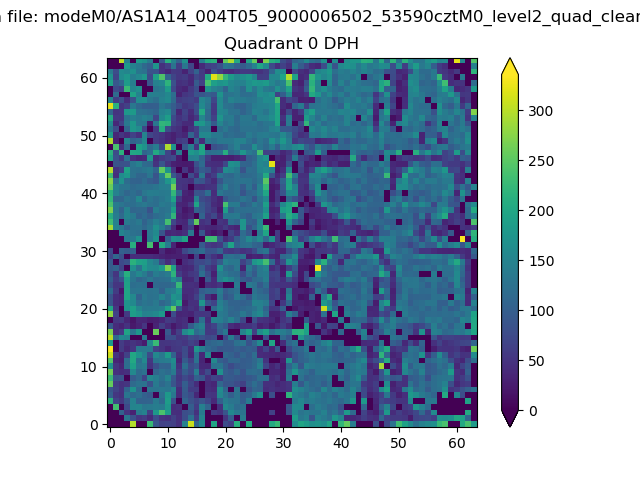 |
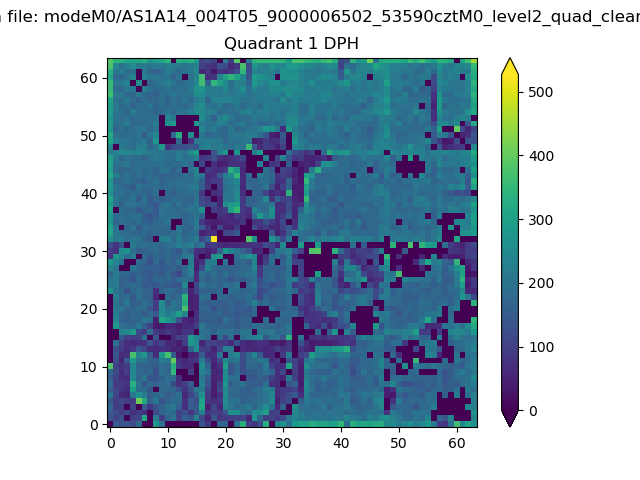 |
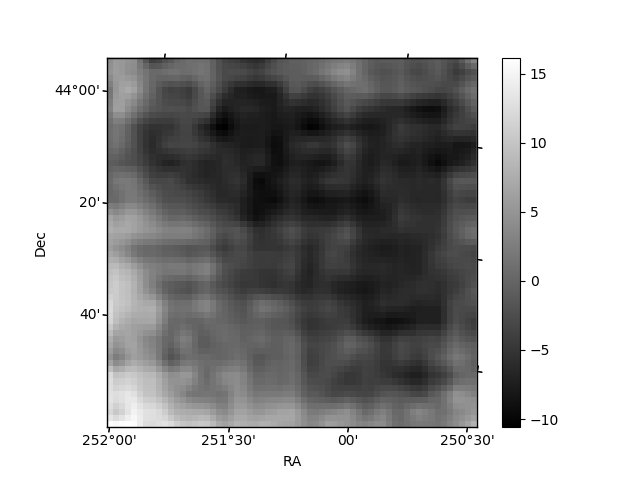
Quadrant B |
|---|---|---|---|
| Quadrant D | 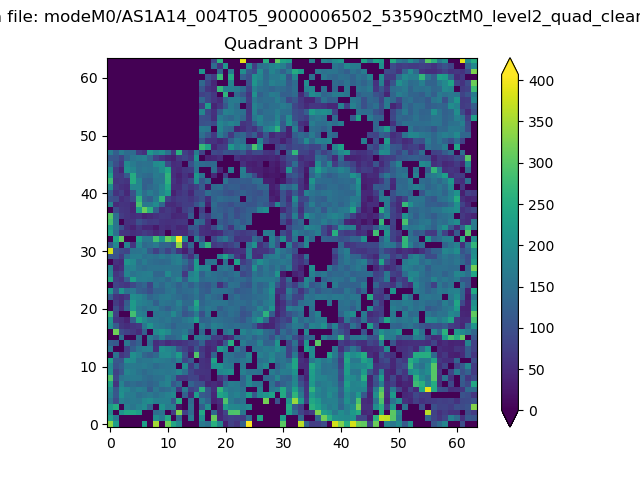 |
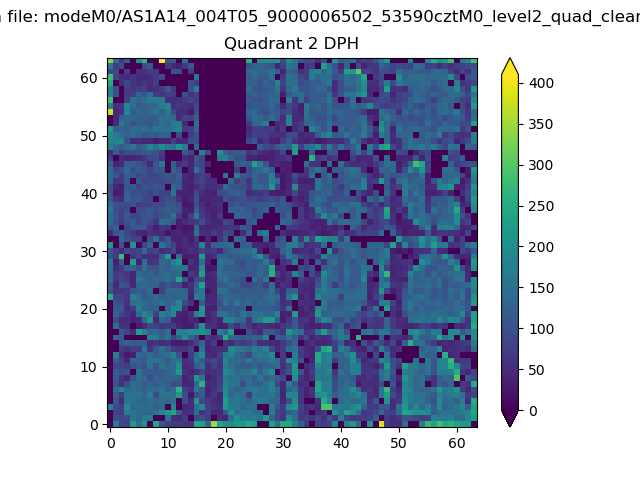 |
Quadrant C |
| Plot type | Count rate plots | Images |
|---|---|---|
| Comparison with Poisson distribution Blue bars denote a histogram of data divided into 1 sec bins. Red curve is a Poisson curve with rate = median count rate of data. |
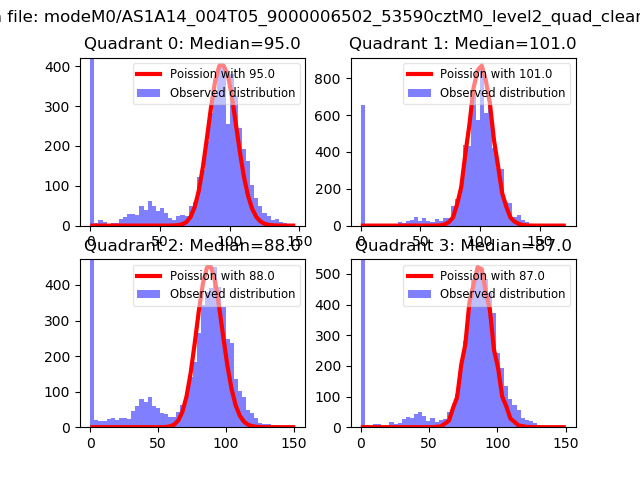 |
 |
| Quadrant-wise count rates Data is divided into 100 sec bins |
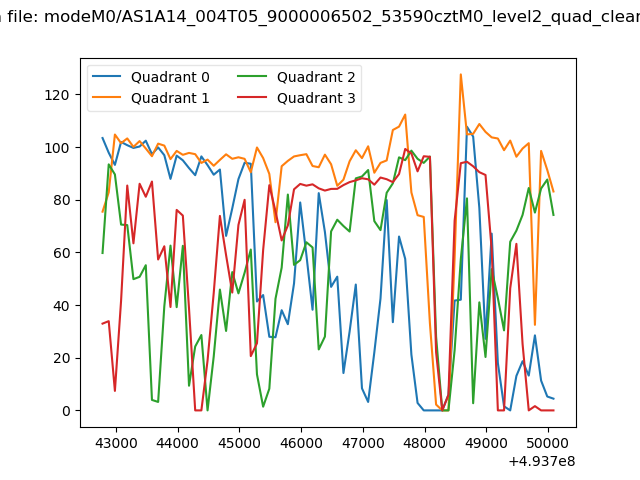 |
|
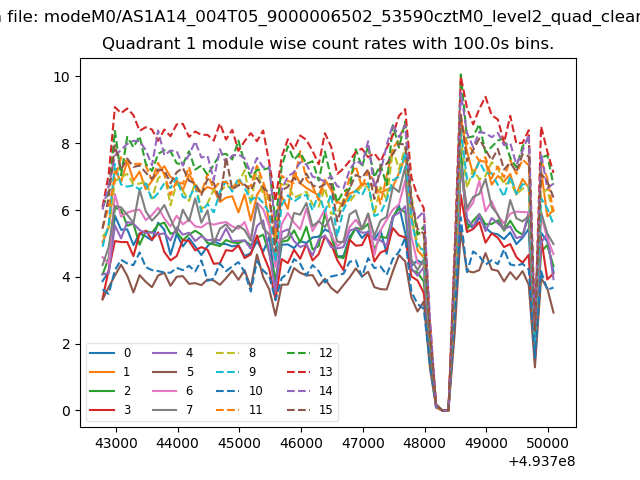
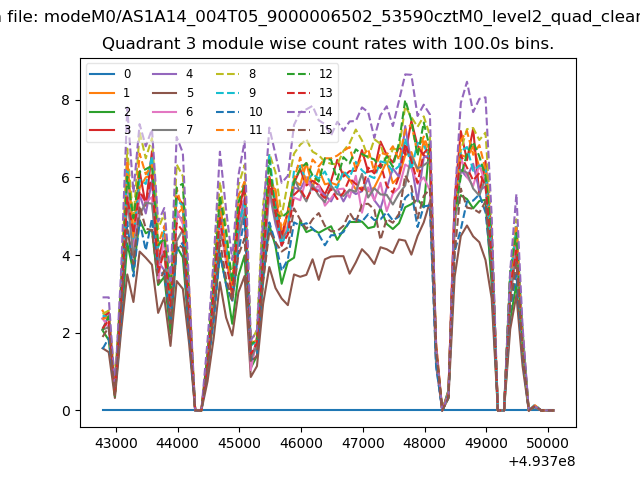
| Module-wise count rates for Quadrant A Data is divided into 100 sec bins |
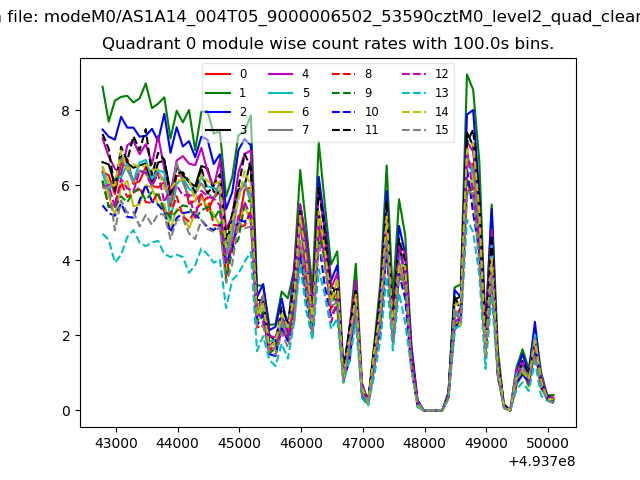 |
 |
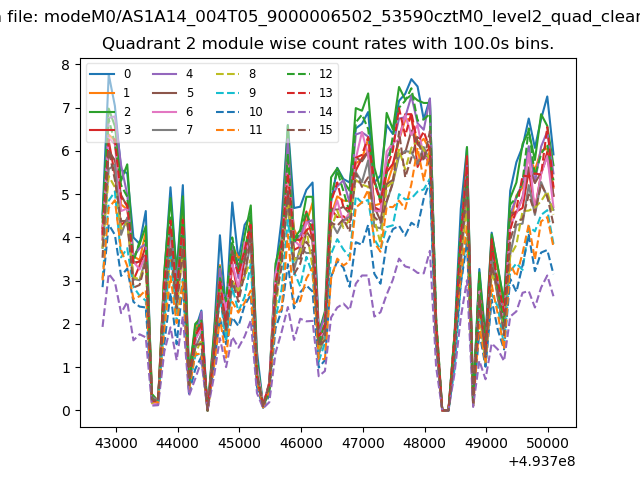
| Module-wise count rates for Quadrant B Data is divided into 100 sec bins |
 |
 |
| Module-wise count rates for Quadrant C Data is divided into 100 sec bins |
 |
 |
| Module-wise count rates for Quadrant D Data is divided into 100 sec bins |
 |
 |
| Parameter | Plot |
|---|---|
| CZT HV Monitor |  |
| D_VDD | 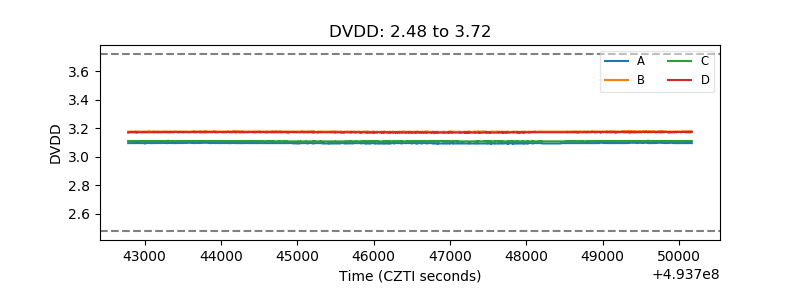 |
| Temperature 1 | 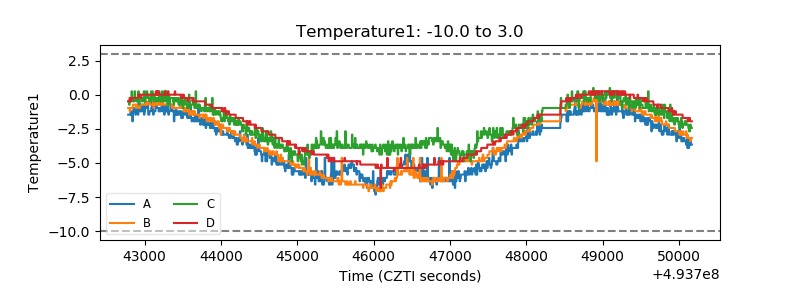 |
| Veto HV Monitor | 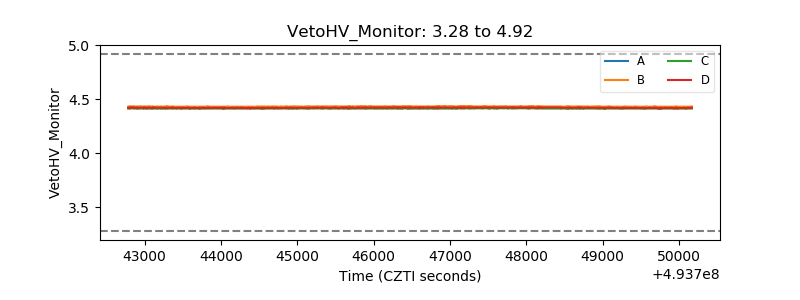 |
| Veto LLD | 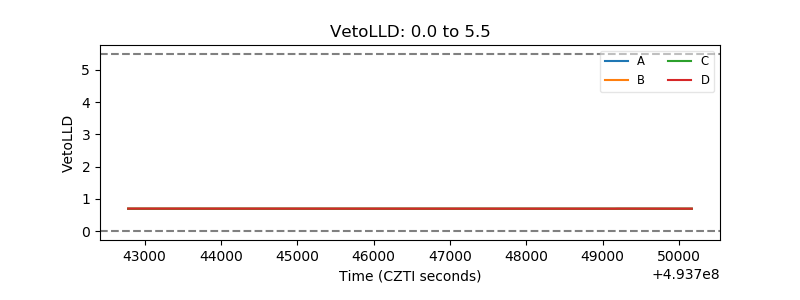 |
| Alpha Counter | 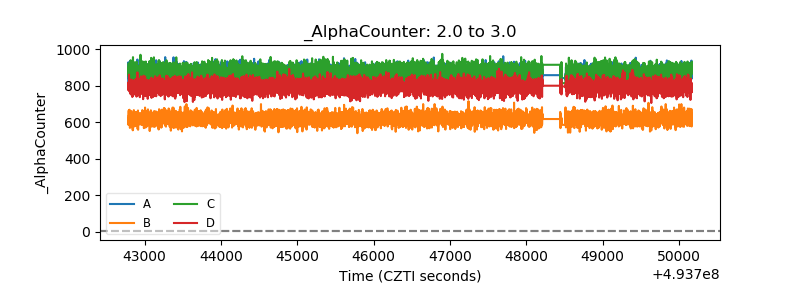 |
| _CPM_Rate | 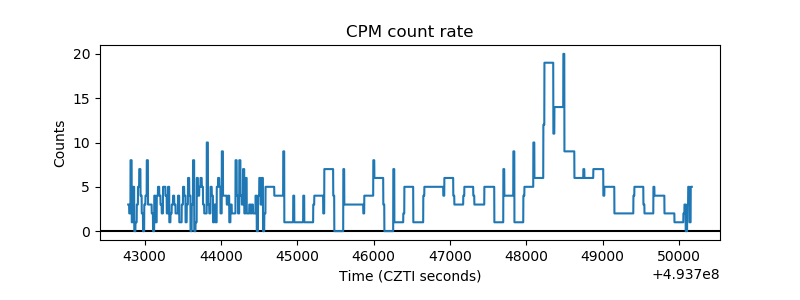 |
| CZT Counter | 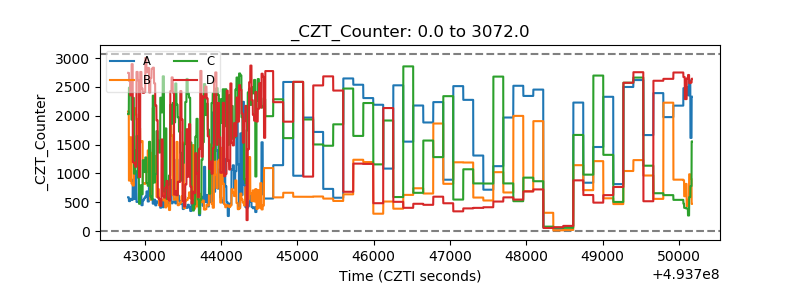 |
| +2.5 Volts monitor |  |
| +5 Volts monitor |  |
| _ROLL_ROT | 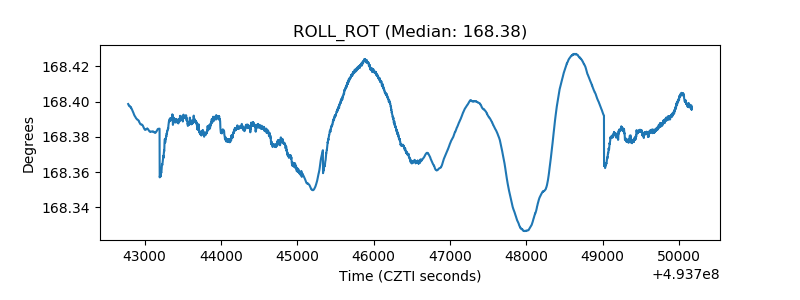 |
| _Roll_DEC | 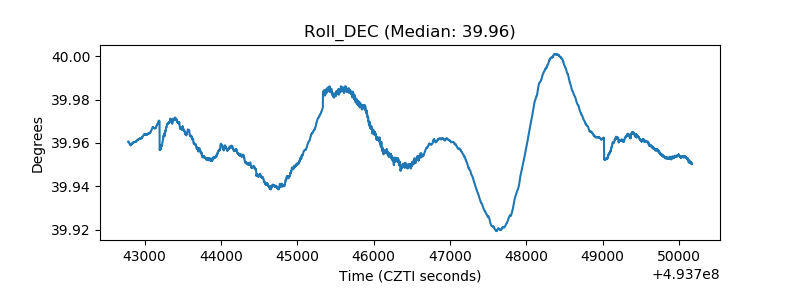 |
| _Roll_RA | 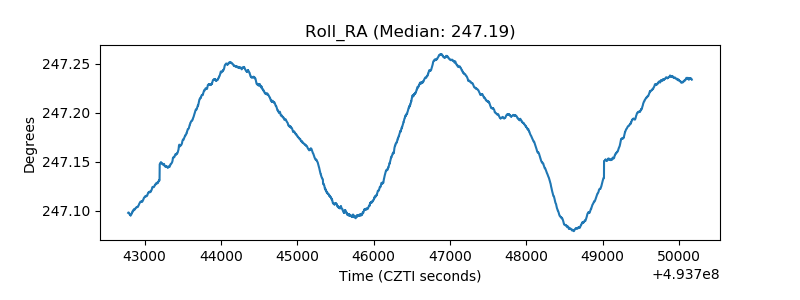 |
| Veto Counter | 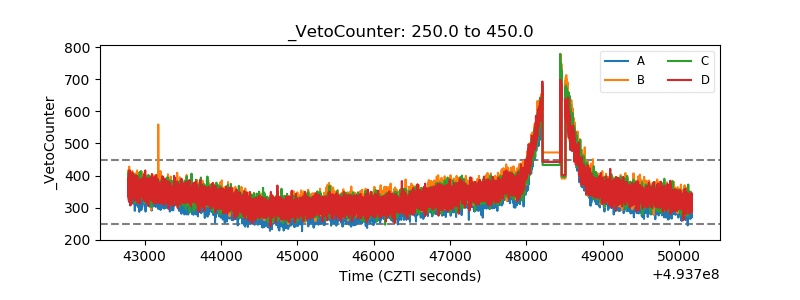 |