| Param | Original file | Final file |
|---|---|---|
| Filename | modeM0/AS1A14_004T05_9000006502_53591cztM0_level2.fits | modeM0/AS1A14_004T05_9000006502_53591cztM0_level2_quad_clean.evt |
| Size (bytes) | 1,313,542,080 | 66,735,360 |
| Size | 1.2 GB | 63.6 MB |
| Events in quadrant A | 16,614,574 | 131,734 |
| Events in quadrant B | 5,801,013 | 728,086 |
| Events in quadrant C | 13,140,099 | 371,615 |
| Events in quadrant D | 12,493,143 | 269,787 |
| Mode SS | |||
|---|---|---|---|
| Quadrant | BADHDUFLAG | Total packets | Discarded packets |
| A | 0 | 150 | 0 |
| B | 0 | 150 | 0 |
| C | 0 | 150 | 0 |
| D | 0 | 150 | 0 |
| Mode M0 | |||
|---|---|---|---|
| Quadrant | BADHDUFLAG | Total packets | Discarded packets |
| A | 0 | 54394 | 0 |
| B | 0 | 22309 | 0 |
| C | 0 | 44210 | 0 |
| D | 0 | 42266 | 1 |
| Quadrant | Total seconds | Saturated seconds | Saturation percentage |
|---|---|---|---|
| A | 7451 | 6328 | 84.928198% |
| B | 7451 | 446 | 5.985774% |
| C | 7451 | 3828 | 51.375654% |
| D | 7451 | 4430 | 59.455107% |
Noise dominated data is calculated using 1-second bins in cleaned event files. If a bin has >2000 counts, and if more than 50% of those come from <1% of pixels, then it is considered to be noise-dominated and hence unusable.
| Quadrant | # 1 sec bins | Bins with >0 counts | Bins with >2000 counts | High rate bins dominated by noise | Noise dominated (total time) | Noise dominated (detector-on time) | Marked lightcurve |
|---|---|---|---|---|---|---|---|
| A | 7451 | 7451 | 5437 | 5437 | 72.97% | 72.97% | 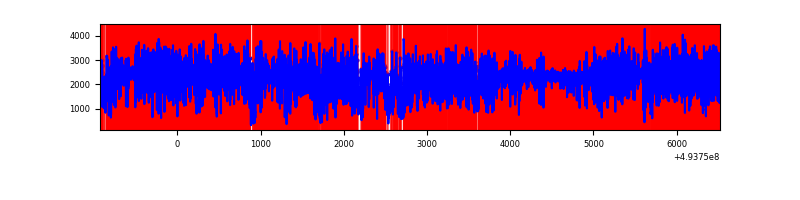 |
| B | 7451 | 7451 | 314 | 314 | 4.21% | 4.21% | 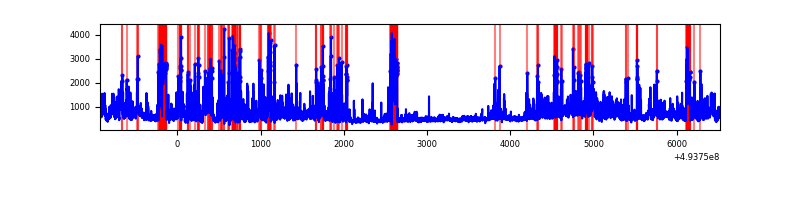 |
| C | 7451 | 7451 | 3039 | 3039 | 40.79% | 40.79% | 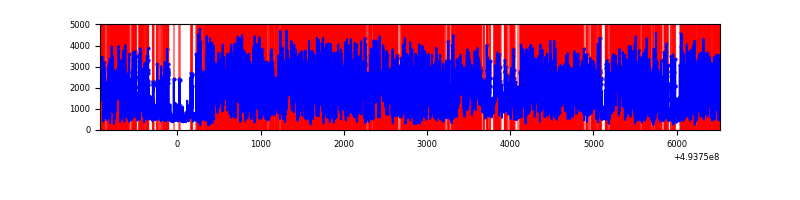 |
| D | 7450 | 7450 | 3586 | 3586 | 48.13% | 48.13% | 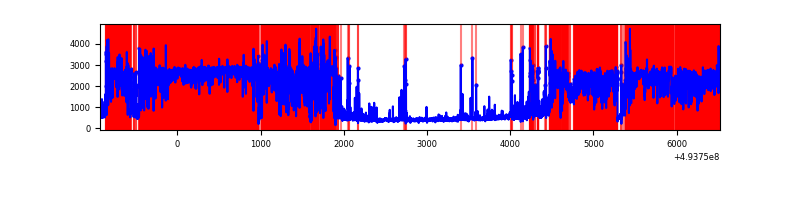 |
Top three noisy pixels from each quadrant. If the there are fewer than three noisy pixels in the level2.evt file, extra rows are filled as -1
| Pixel properties | Quadrant properties | ||||||
|---|---|---|---|---|---|---|---|
| Quadrant | DetID | PixID | Counts | Sigma | Mean | Median | Sigma |
| A | 3 | 62 | 13941816 | 124516.9 | 447 | 436 | 112.0 |
| A | 15 | 174 | 248475 | 2215.35 | 447 | 436 | 112.0 |
| A | 3 | 63 | 227318 | 2026.39 | 447 | 436 | 112.0 |
| B | 4 | 206 | 712416 | 4307.5 | 777 | 751 | 165.2 |
| B | 5 | 172 | 634319 | 3834.8 | 777 | 751 | 165.2 |
| B | 0 | 171 | 303452 | 1832.16 | 777 | 751 | 165.2 |
| C | 15 | 224 | 6901870 | 42439.38 | 581 | 574 | 162.6 |
| C | 4 | 5 | 2217100 | 13630.48 | 581 | 574 | 162.6 |
| C | 15 | 178 | 636214 | 3908.85 | 581 | 574 | 162.6 |
| D | 8 | 176 | 9652158 | 81577.9 | 403 | 384 | 118.3 |
| D | 3 | 12 | 746210 | 6303.81 | 403 | 384 | 118.3 |
| D | 7 | 70 | 139437 | 1175.29 | 403 | 384 | 118.3 |
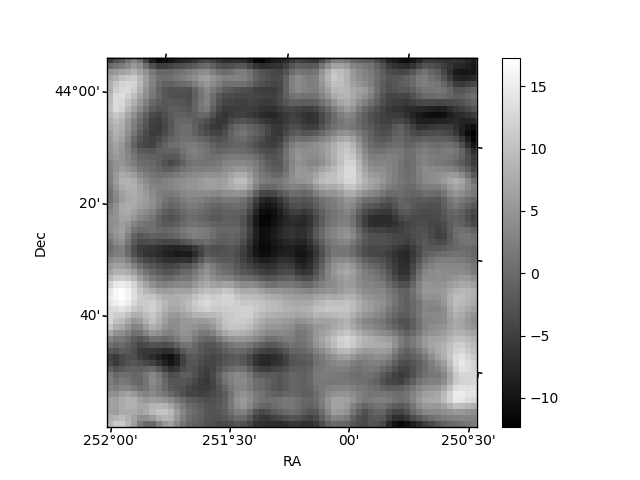
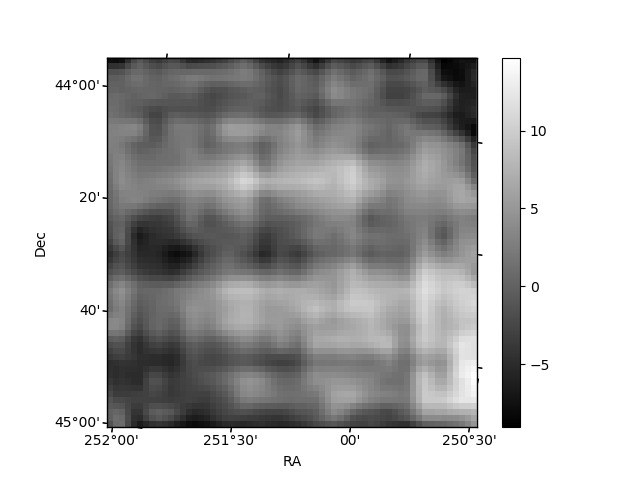
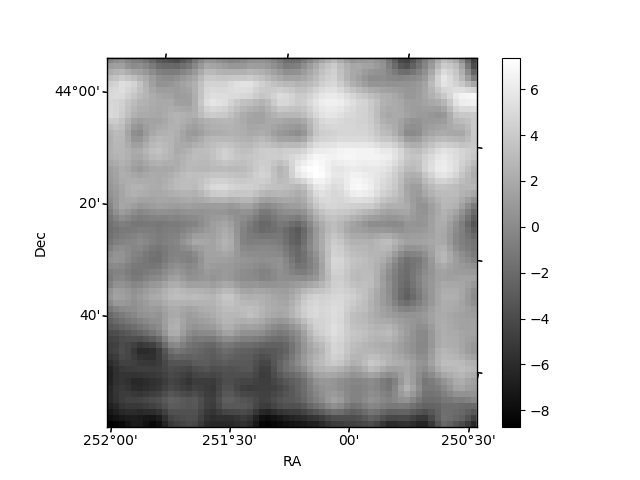
Histogram calculated using DETX and DETY for each event in the final _common_clean file
| Quadrant A | 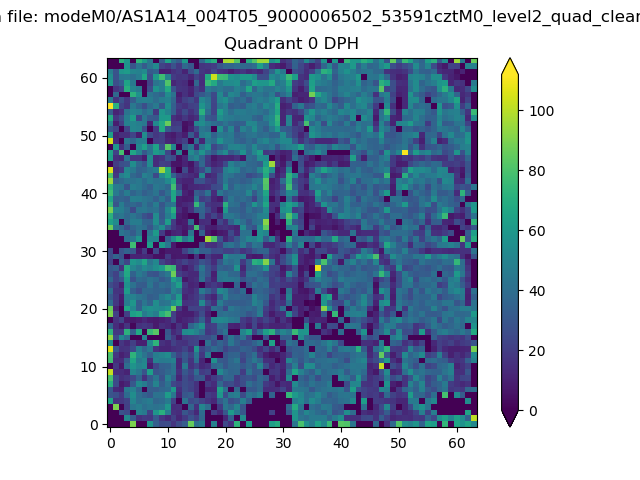 |
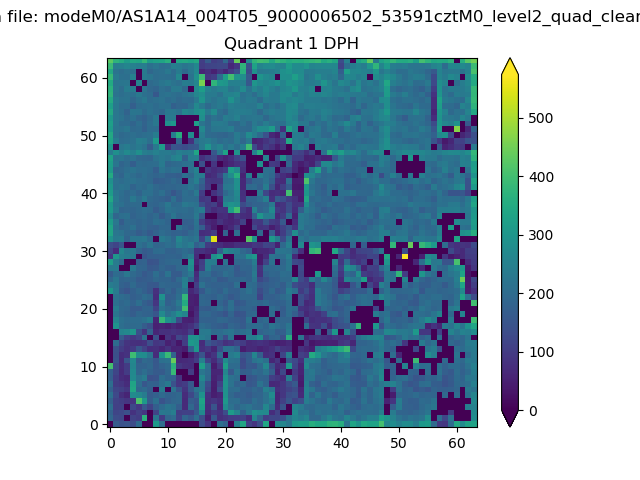 |
Quadrant B |
|---|---|---|---|
| Quadrant D | 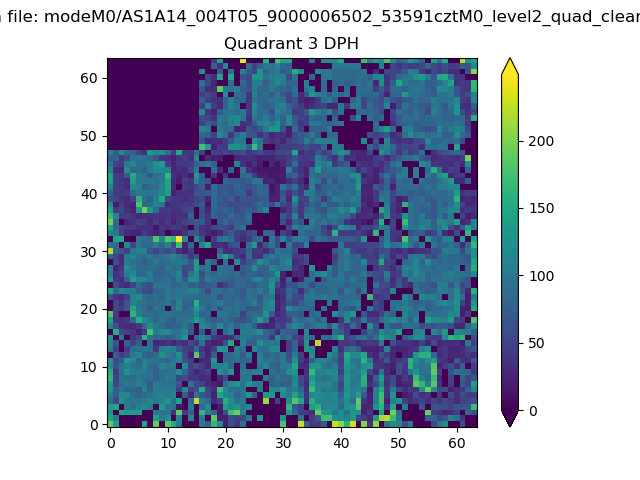 |
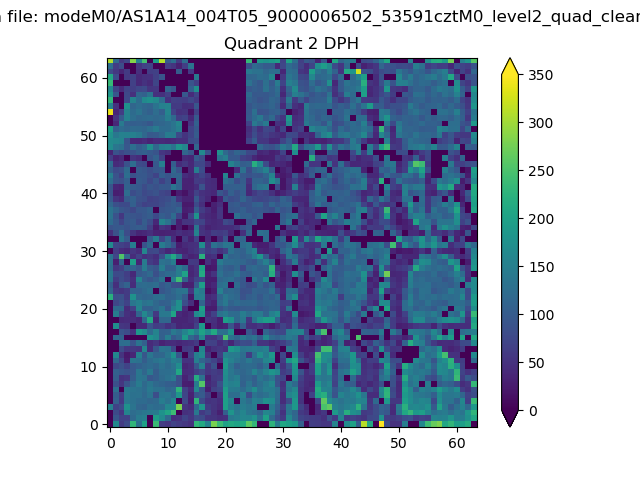 |
Quadrant C |
| Plot type | Count rate plots | Images |
|---|---|---|
| Comparison with Poisson distribution Blue bars denote a histogram of data divided into 1 sec bins. Red curve is a Poisson curve with rate = median count rate of data. |
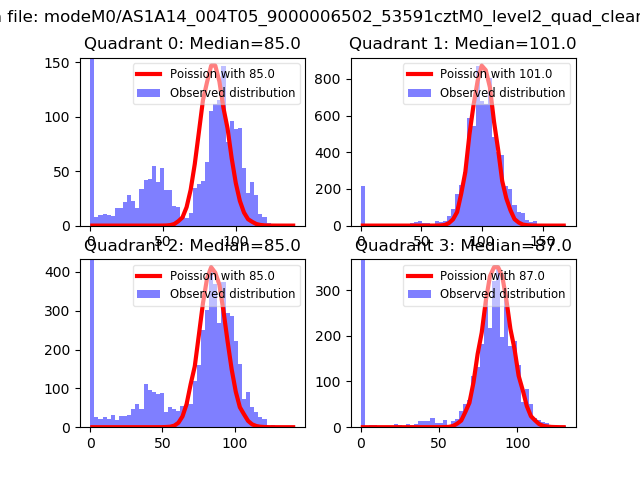 |
 |
| Quadrant-wise count rates Data is divided into 100 sec bins |
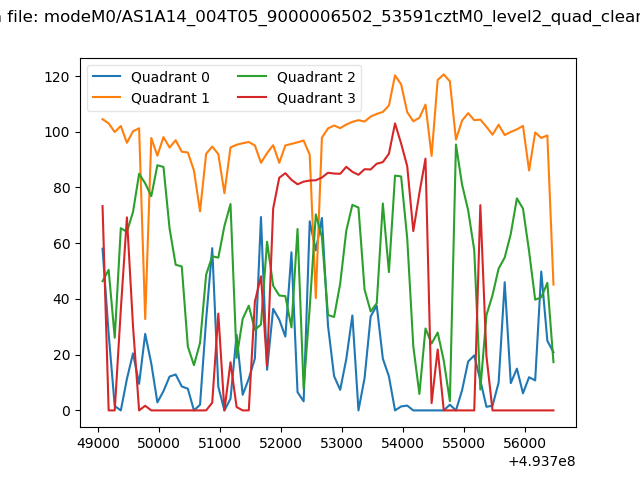 |
|
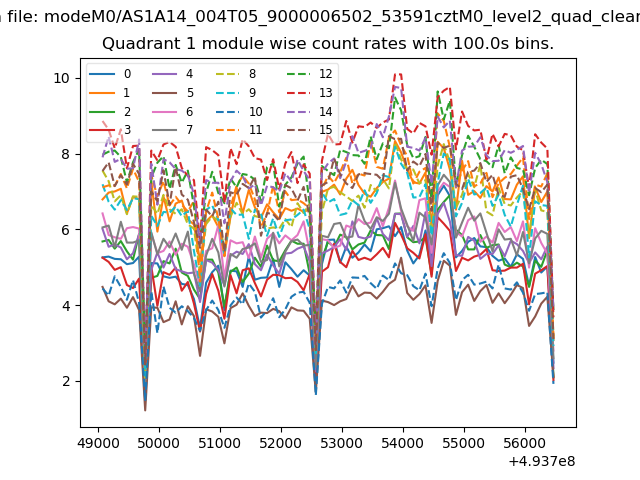
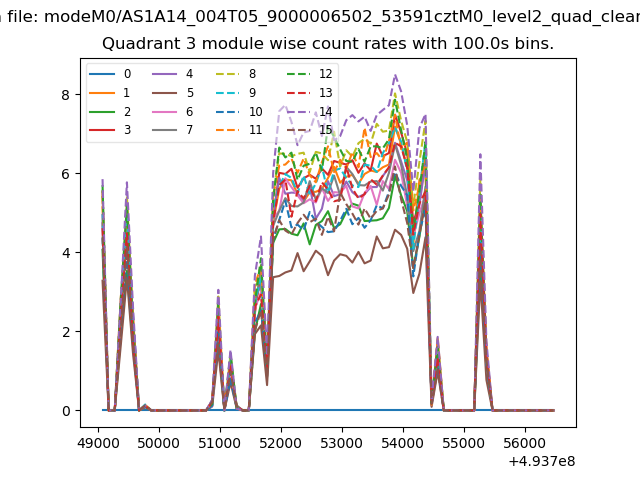
| Module-wise count rates for Quadrant A Data is divided into 100 sec bins |
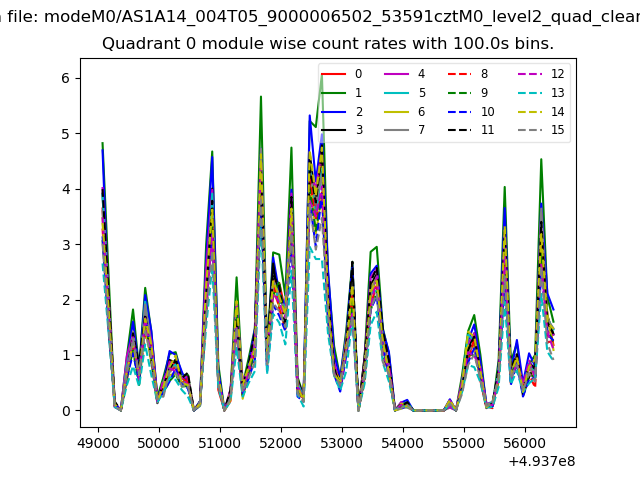 |
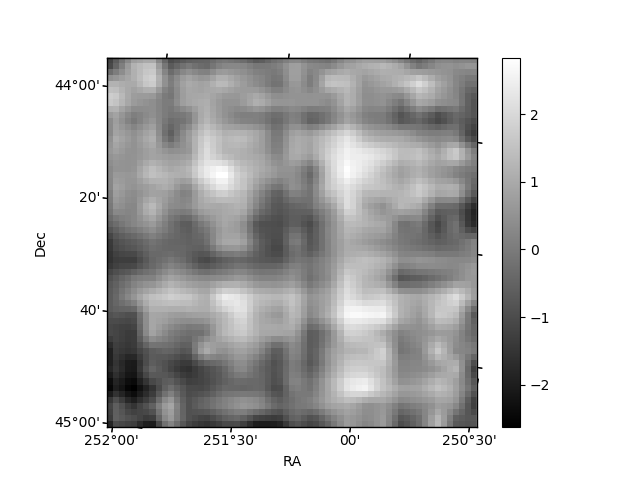 |
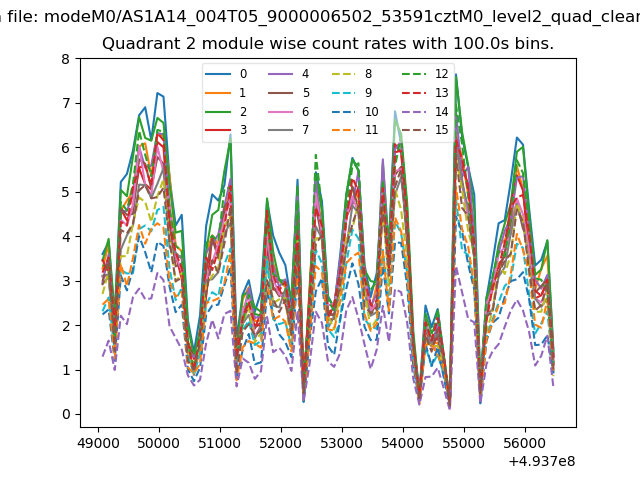
| Module-wise count rates for Quadrant B Data is divided into 100 sec bins |
 |
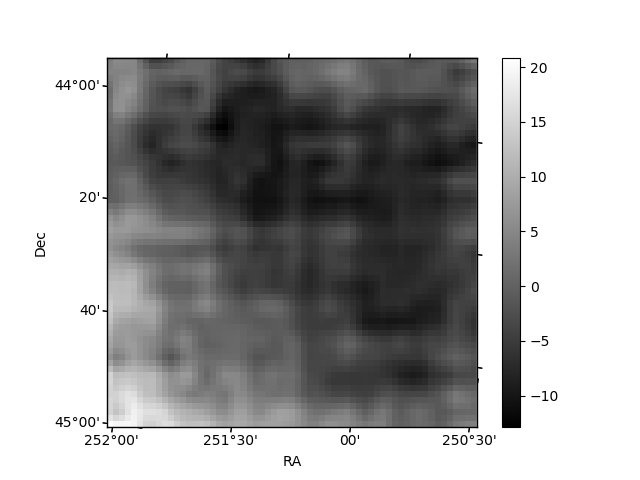 |
| Module-wise count rates for Quadrant C Data is divided into 100 sec bins |
 |
 |
| Module-wise count rates for Quadrant D Data is divided into 100 sec bins |
 |
 |
| Parameter | Plot |
|---|---|
| CZT HV Monitor |  |
| D_VDD | 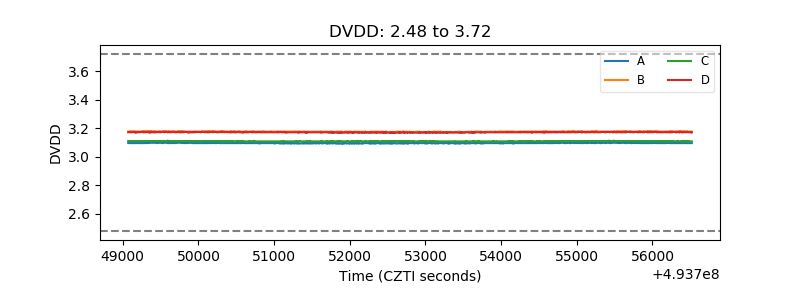 |
| Temperature 1 | 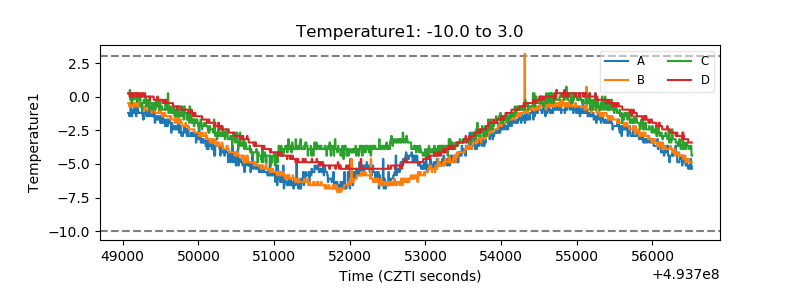 |
| Veto HV Monitor | 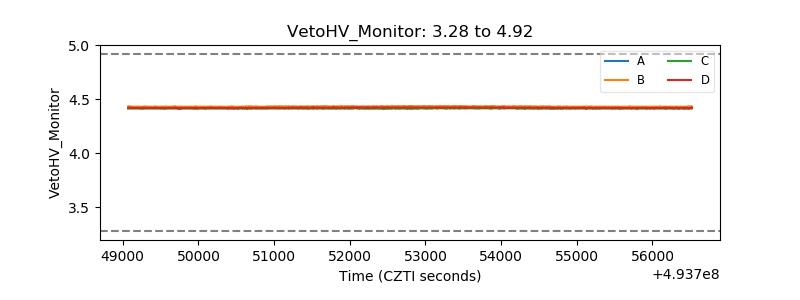 |
| Veto LLD | 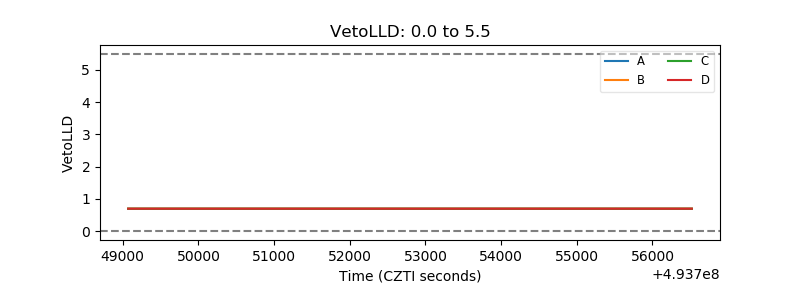 |
| Alpha Counter | 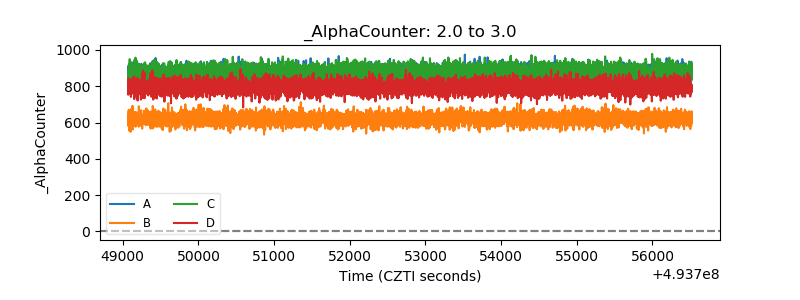 |
| _CPM_Rate | 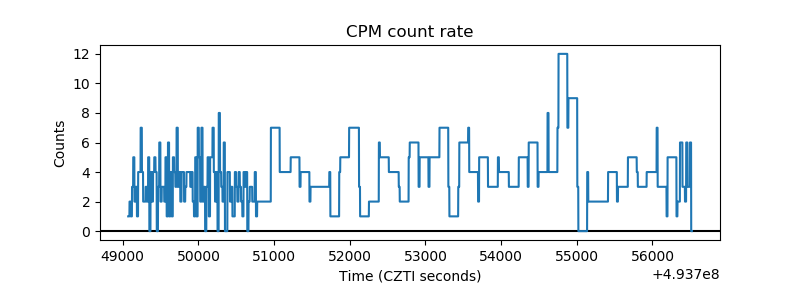 |
| CZT Counter | 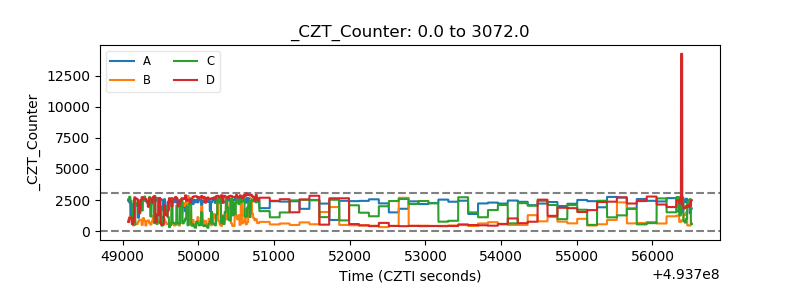 |
| +2.5 Volts monitor |  |
| +5 Volts monitor |  |
| _ROLL_ROT | 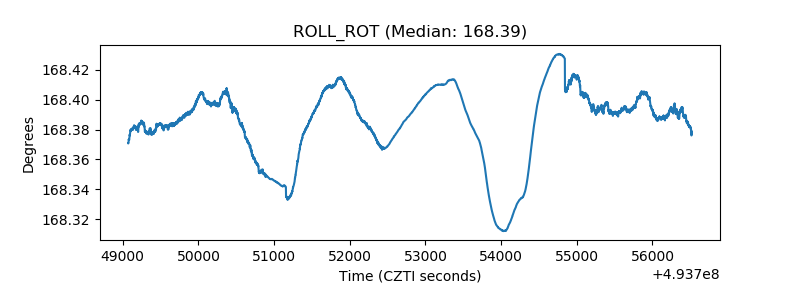 |
| _Roll_DEC | 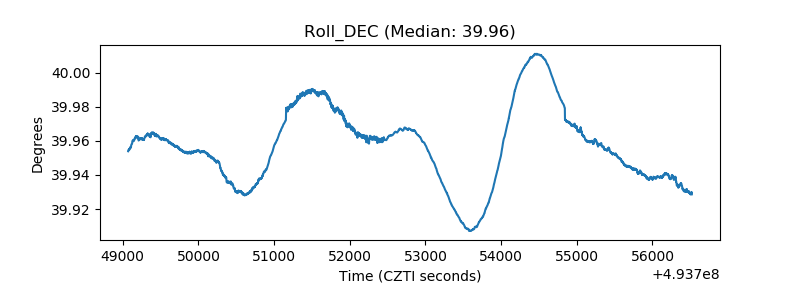 |
| _Roll_RA | 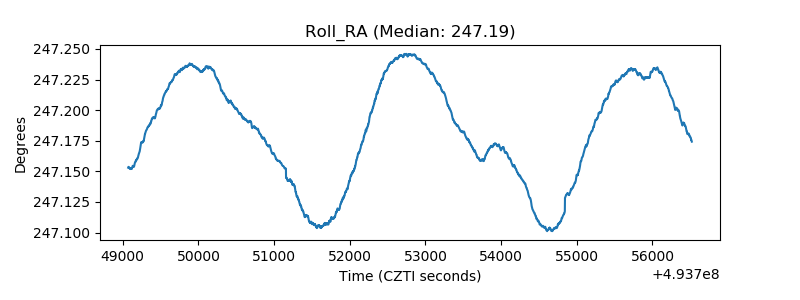 |
| Veto Counter | 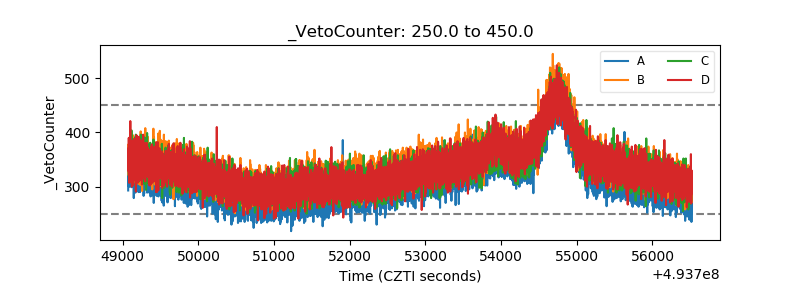 |