| Param | Original file | Final file |
|---|---|---|
| Filename | modeM0/AS1A14_004T05_9000006502_53592cztM0_level2.fits | modeM0/AS1A14_004T05_9000006502_53592cztM0_level2_quad_clean.evt |
| Size (bytes) | 1,311,678,720 | 64,287,360 |
| Size | 1.2 GB | 61.3 MB |
| Events in quadrant A | 13,611,468 | 353,183 |
| Events in quadrant B | 8,908,142 | 586,480 |
| Events in quadrant C | 10,356,245 | 358,071 |
| Events in quadrant D | 15,111,772 | 136,058 |
| Mode SS | |||
|---|---|---|---|
| Quadrant | BADHDUFLAG | Total packets | Discarded packets |
| A | 0 | 148 | 0 |
| B | 0 | 148 | 0 |
| C | 0 | 148 | 0 |
| D | 0 | 148 | 0 |
| Mode M0 | |||
|---|---|---|---|
| Quadrant | BADHDUFLAG | Total packets | Discarded packets |
| A | 0 | 45482 | 0 |
| B | 0 | 31594 | 0 |
| C | 0 | 35898 | 0 |
| D | 0 | 49845 | 0 |
| Quadrant | Total seconds | Saturated seconds | Saturation percentage |
|---|---|---|---|
| A | 7352 | 4018 | 54.651795% |
| B | 7352 | 1839 | 25.013602% |
| C | 7352 | 3690 | 50.190424% |
| D | 7352 | 5890 | 80.114255% |
Noise dominated data is calculated using 1-second bins in cleaned event files. If a bin has >2000 counts, and if more than 50% of those come from <1% of pixels, then it is considered to be noise-dominated and hence unusable.
| Quadrant | # 1 sec bins | Bins with >0 counts | Bins with >2000 counts | High rate bins dominated by noise | Noise dominated (total time) | Noise dominated (detector-on time) | Marked lightcurve |
|---|---|---|---|---|---|---|---|
| A | 7352 | 7352 | 3299 | 3299 | 44.87% | 44.87% | 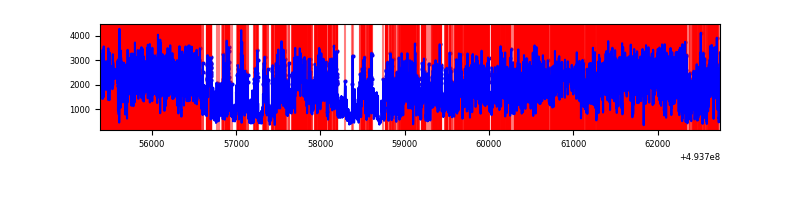 |
| B | 7352 | 7352 | 1244 | 1244 | 16.92% | 16.92% | 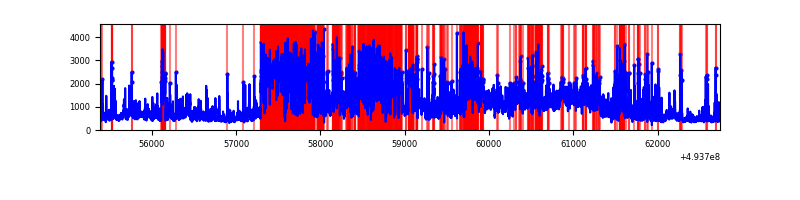 |
| C | 7352 | 7352 | 1974 | 1974 | 26.85% | 26.85% | 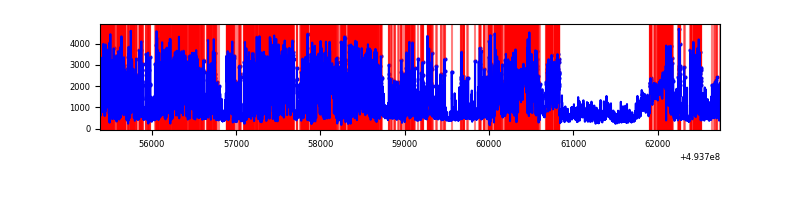 |
| D | 7351 | 7351 | 4512 | 4512 | 61.38% | 61.38% | 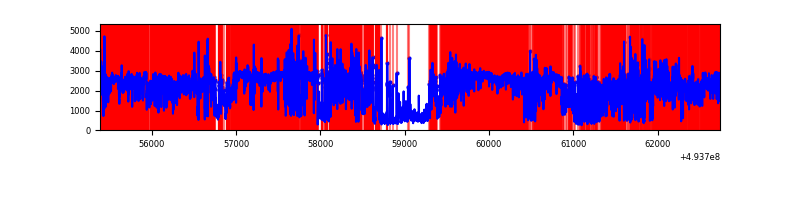 |
Top three noisy pixels from each quadrant. If the there are fewer than three noisy pixels in the level2.evt file, extra rows are filled as -1
| Pixel properties | Quadrant properties | ||||||
|---|---|---|---|---|---|---|---|
| Quadrant | DetID | PixID | Counts | Sigma | Mean | Median | Sigma |
| A | 3 | 62 | 9921131 | 64657.79 | 613 | 596 | 153.4 |
| A | 15 | 174 | 311765 | 2028.06 | 613 | 596 | 153.4 |
| A | 3 | 63 | 267519 | 1739.69 | 613 | 596 | 153.4 |
| B | 5 | 185 | 2352334 | 15517.45 | 709 | 684 | 151.5 |
| B | 5 | 250 | 1358472 | 8959.42 | 709 | 684 | 151.5 |
| B | 5 | 172 | 920255 | 6067.83 | 709 | 684 | 151.5 |
| C | 15 | 224 | 6512784 | 47162.28 | 496 | 491 | 138.1 |
| C | 15 | 164 | 816080 | 5906.53 | 496 | 491 | 138.1 |
| C | 4 | 5 | 344959 | 2494.65 | 496 | 491 | 138.1 |
| D | 8 | 176 | 13438950 | 164744.47 | 278 | 265 | 81.6 |
| D | 2 | 153 | 64280 | 784.76 | 278 | 265 | 81.6 |
| D | 2 | 249 | 60334 | 736.38 | 278 | 265 | 81.6 |
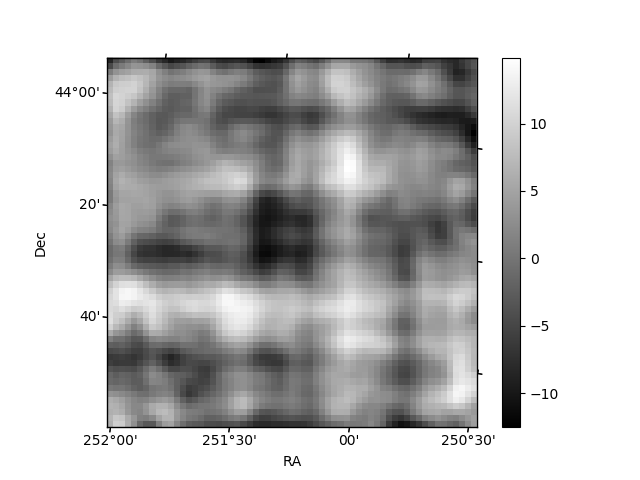
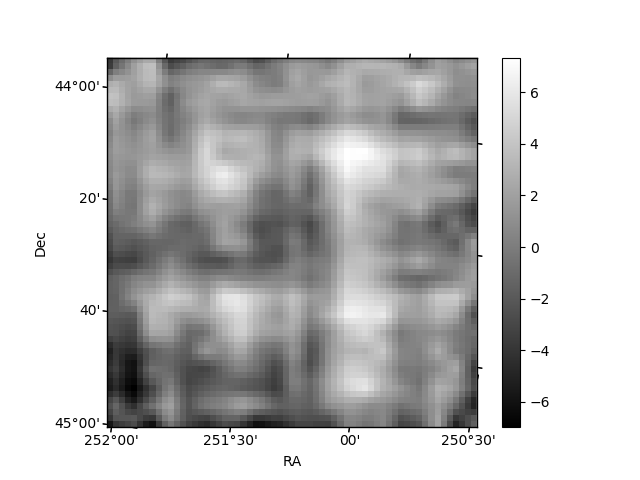
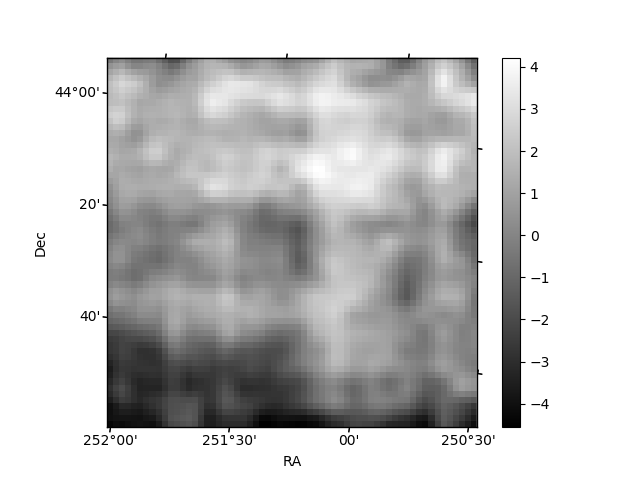
Histogram calculated using DETX and DETY for each event in the final _common_clean file
| Quadrant A | 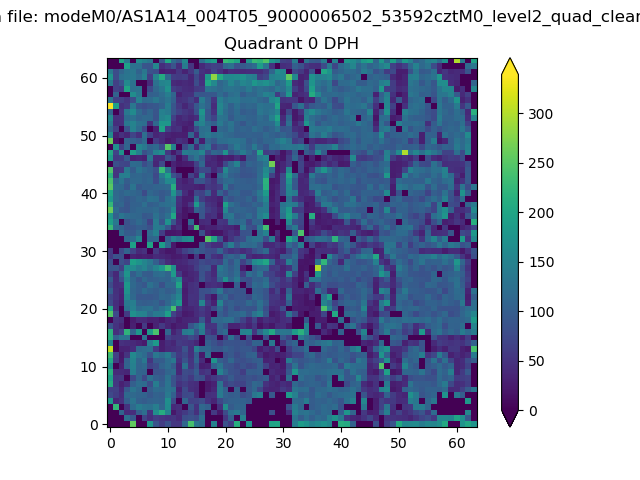 |
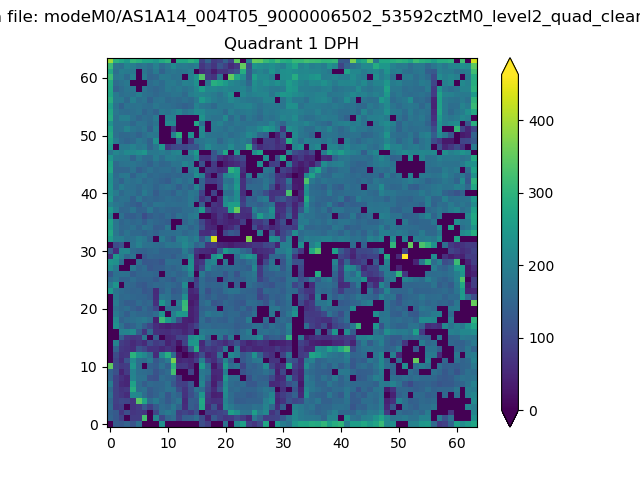 |
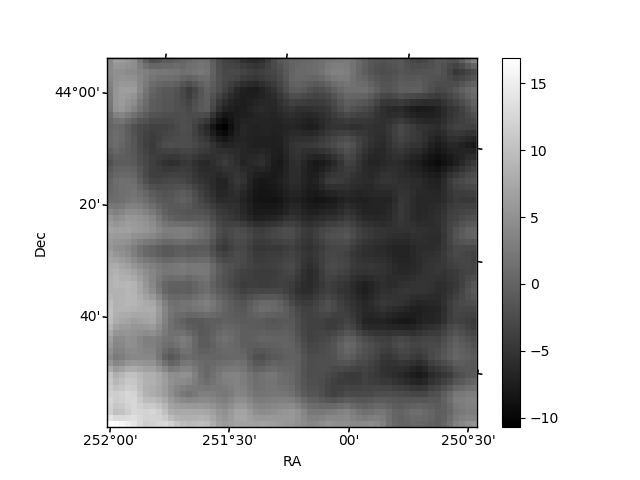
Quadrant B |
|---|---|---|---|
| Quadrant D | 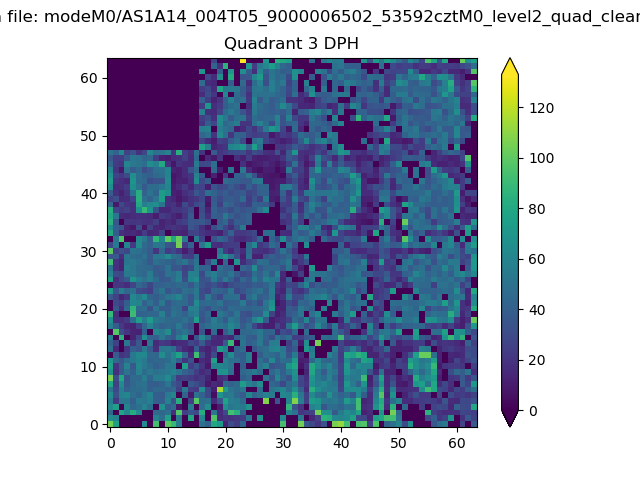 |
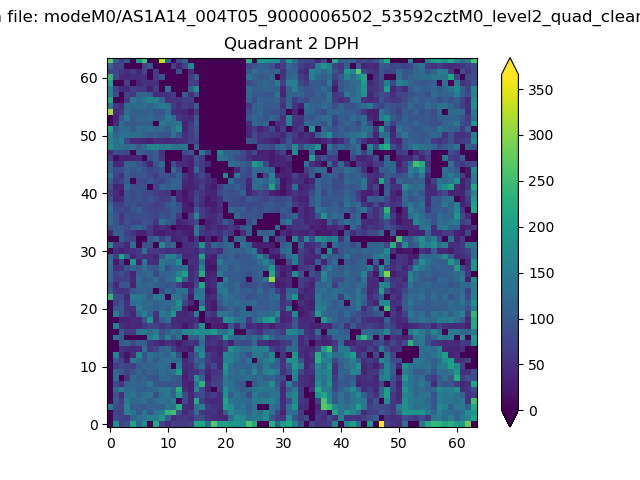 |
Quadrant C |
| Plot type | Count rate plots | Images |
|---|---|---|
| Comparison with Poisson distribution Blue bars denote a histogram of data divided into 1 sec bins. Red curve is a Poisson curve with rate = median count rate of data. |
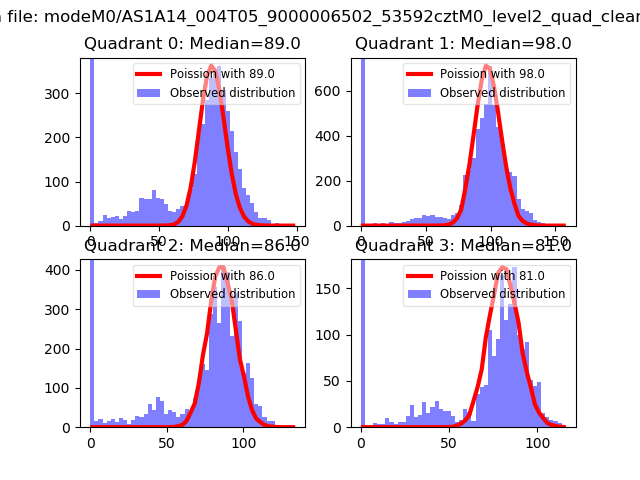 |
 |
| Quadrant-wise count rates Data is divided into 100 sec bins |
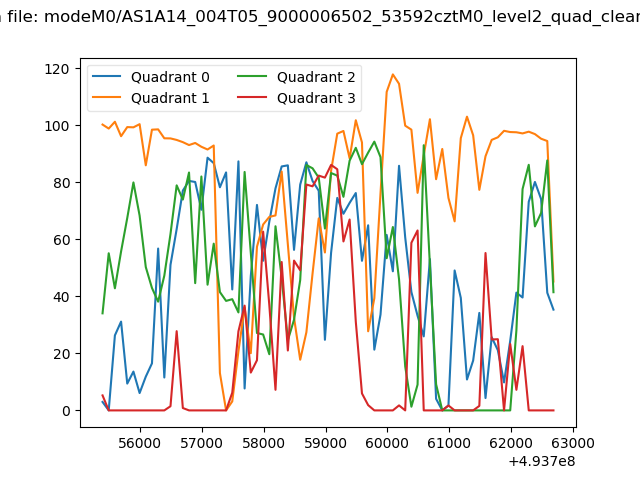 |
|
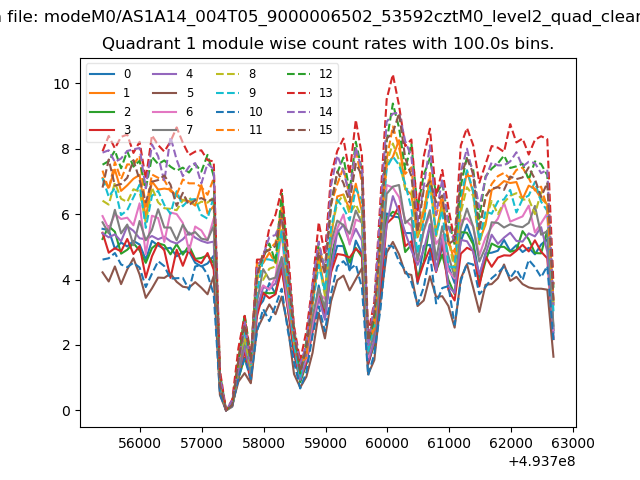
| Module-wise count rates for Quadrant A Data is divided into 100 sec bins |
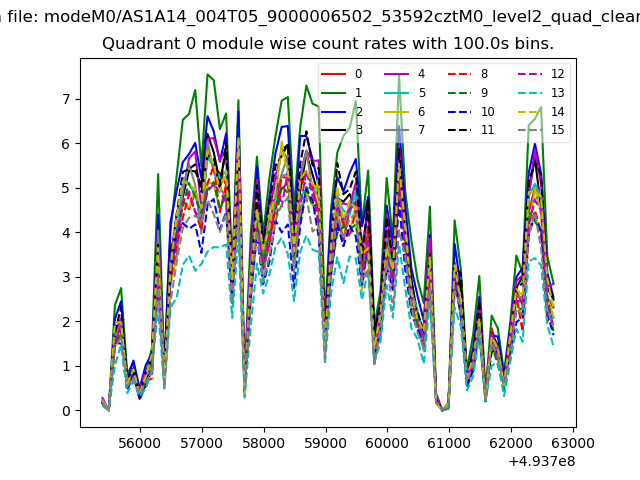 |
 |
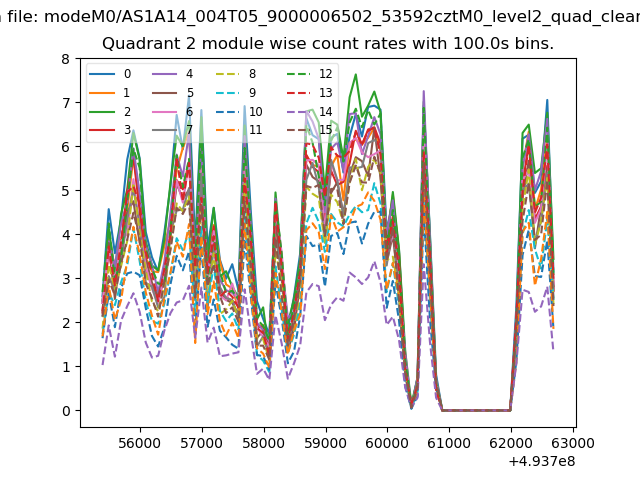
| Module-wise count rates for Quadrant B Data is divided into 100 sec bins |
 |
 |
| Module-wise count rates for Quadrant C Data is divided into 100 sec bins |
 |
 |
| Module-wise count rates for Quadrant D Data is divided into 100 sec bins |
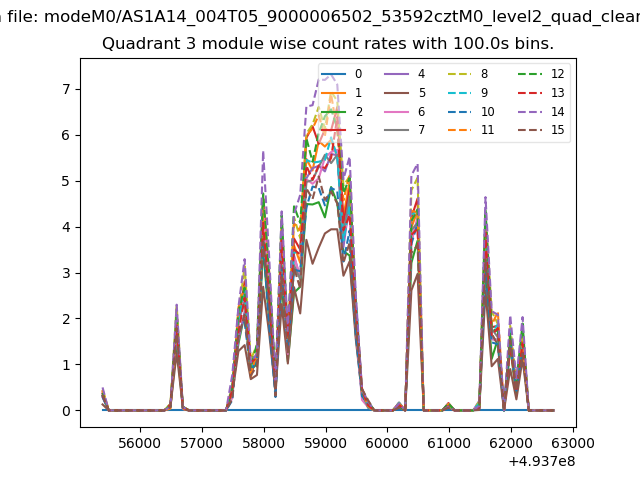 |
 |
| Parameter | Plot |
|---|---|
| CZT HV Monitor | 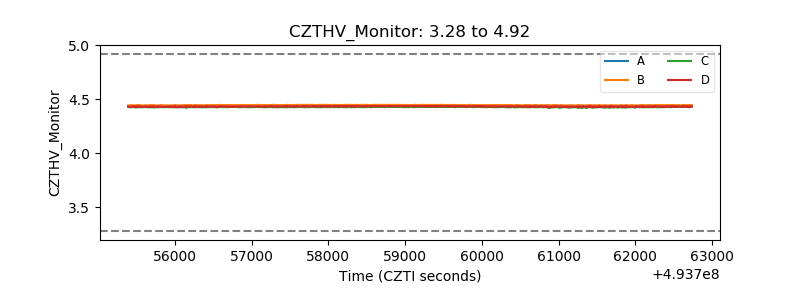 |
| D_VDD | 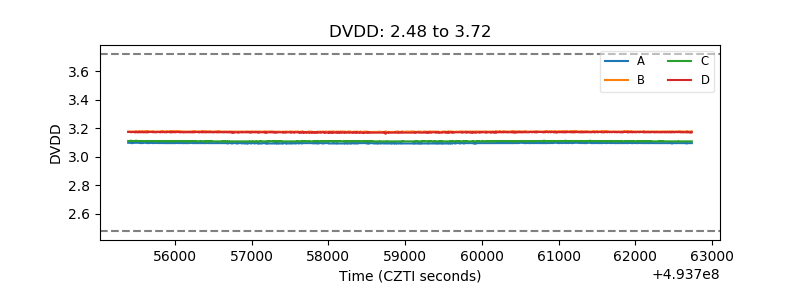 |
| Temperature 1 | 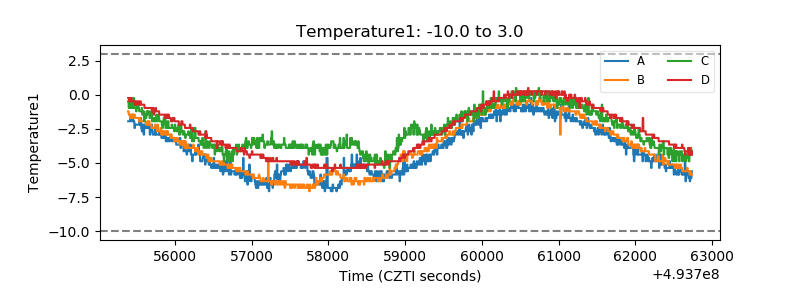 |
| Veto HV Monitor |  |
| Veto LLD | 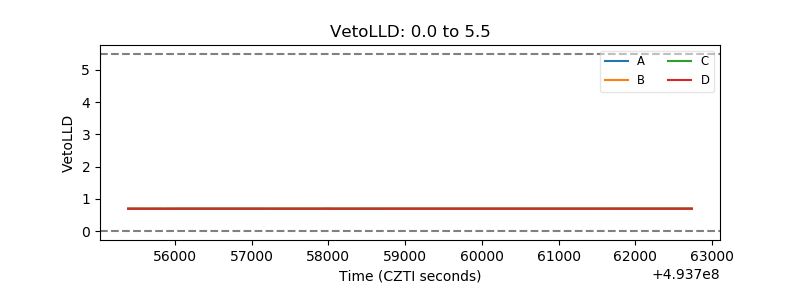 |
| Alpha Counter | 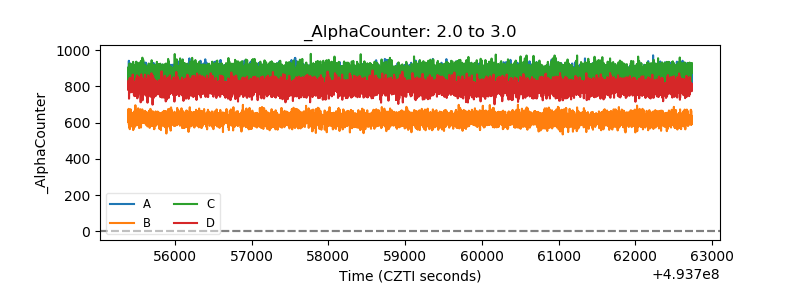 |
| _CPM_Rate | 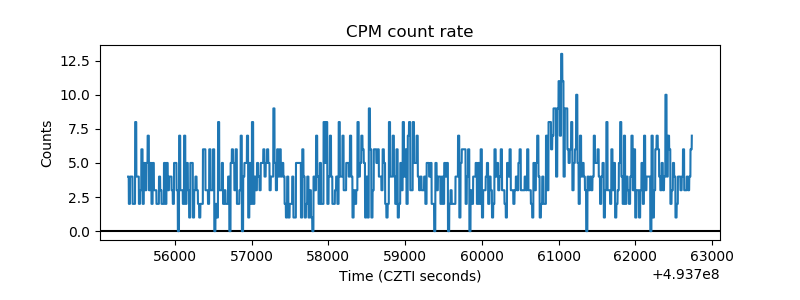 |
| CZT Counter | 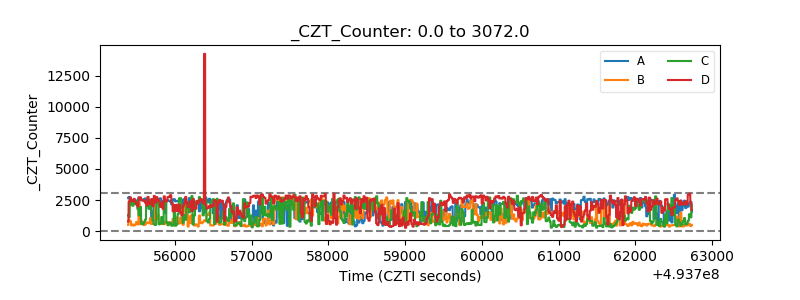 |
| +2.5 Volts monitor |  |
| +5 Volts monitor |  |
| _ROLL_ROT | 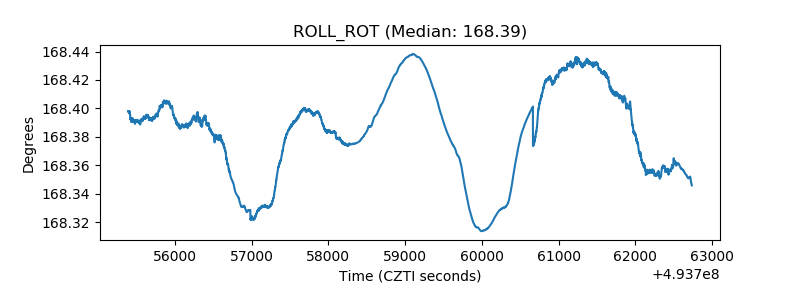 |
| _Roll_DEC | 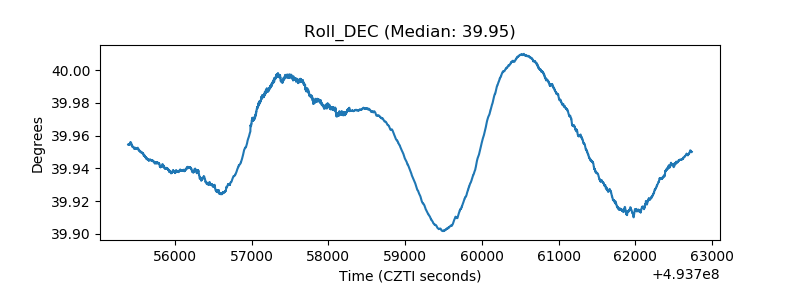 |
| _Roll_RA | 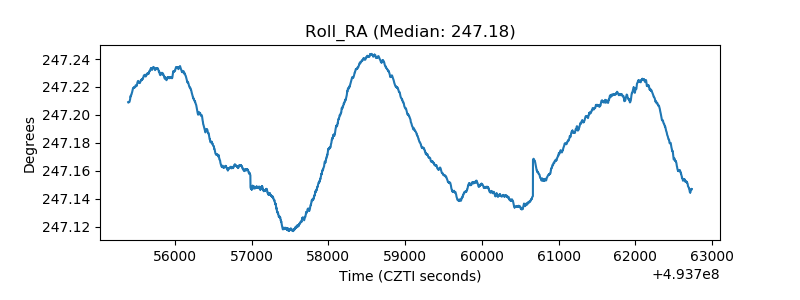 |
| Veto Counter | 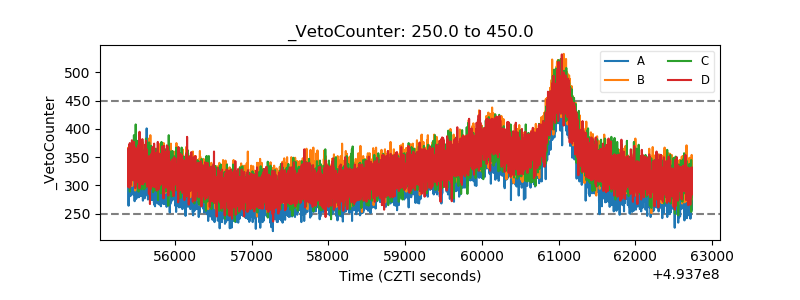 |