| Param | Original file | Final file |
|---|---|---|
| Filename | modeM0/AS1A14_004T05_9000006502_53595cztM0_level2.fits | modeM0/AS1A14_004T05_9000006502_53595cztM0_level2_quad_clean.evt |
| Size (bytes) | 2,463,949,440 | 140,785,920 |
| Size | 2.3 GB | 134.3 MB |
| Events in quadrant A | 23,863,913 | 896,179 |
| Events in quadrant B | 15,729,243 | 1,210,462 |
| Events in quadrant C | 25,302,911 | 502,392 |
| Events in quadrant D | 25,122,730 | 585,519 |
| Mode M9 | |||
|---|---|---|---|
| Quadrant | BADHDUFLAG | Total packets | Discarded packets |
| A | 0 | 4 | 0 |
| B | 0 | 4 | 0 |
| C | 0 | 4 | 0 |
| D | 0 | 4 | 0 |
| Mode SS | |||
|---|---|---|---|
| Quadrant | BADHDUFLAG | Total packets | Discarded packets |
| A | 0 | 316 | 0 |
| B | 0 | 316 | 0 |
| C | 0 | 316 | 0 |
| D | 0 | 316 | 0 |
| Mode M0 | |||
|---|---|---|---|
| Quadrant | BADHDUFLAG | Total packets | Discarded packets |
| A | 0 | 81577 | 4 |
| B | 0 | 57405 | 11 |
| C | 0 | 85898 | 4 |
| D | 0 | 85482 | 4 |
| Quadrant | Total seconds | Saturated seconds | Saturation percentage |
|---|---|---|---|
| A | 15441 | 6134 | 39.725406% |
| B | 15440 | 3068 | 19.870466% |
| C | 15440 | 10193 | 66.016839% |
| D | 15441 | 8535 | 55.274917% |
Noise dominated data is calculated using 1-second bins in cleaned event files. If a bin has >2000 counts, and if more than 50% of those come from <1% of pixels, then it is considered to be noise-dominated and hence unusable.
| Quadrant | # 1 sec bins | Bins with >0 counts | Bins with >2000 counts | High rate bins dominated by noise | Noise dominated (total time) | Noise dominated (detector-on time) | Marked lightcurve |
|---|---|---|---|---|---|---|---|
| A | 16065 | 15441 | 4878 | 4878 | 30.36% | 31.59% | 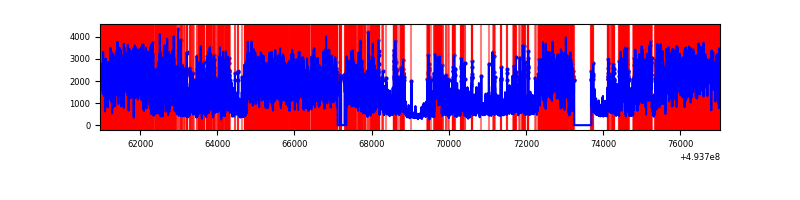 |
| B | 16065 | 15442 | 2258 | 2258 | 14.06% | 14.62% | 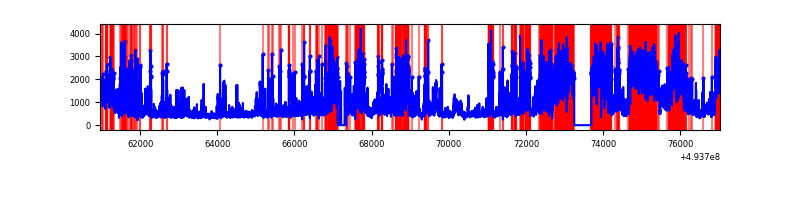 |
| C | 16065 | 15440 | 5834 | 5834 | 36.31% | 37.78% | 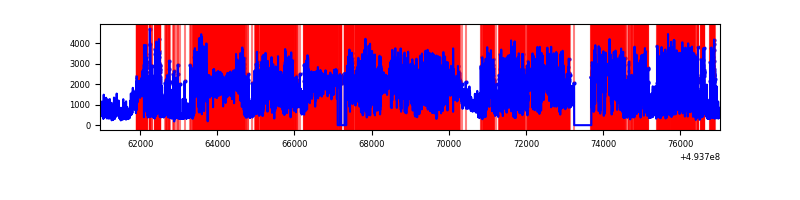 |
| D | 16066 | 15441 | 6349 | 6349 | 39.52% | 41.12% | 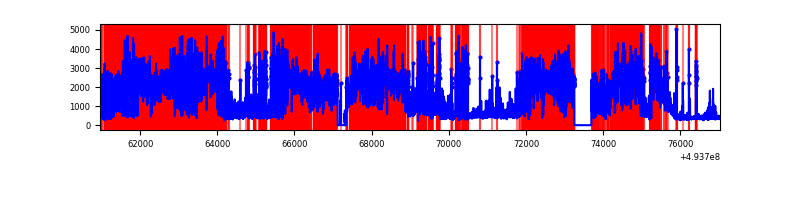 |
Top three noisy pixels from each quadrant. If the there are fewer than three noisy pixels in the level2.evt file, extra rows are filled as -1
| Pixel properties | Quadrant properties | ||||||
|---|---|---|---|---|---|---|---|
| Quadrant | DetID | PixID | Counts | Sigma | Mean | Median | Sigma |
| A | 3 | 62 | 15477651 | 44321.73 | 1400 | 1362 | 349.2 |
| A | 3 | 63 | 726411 | 2076.43 | 1400 | 1362 | 349.2 |
| A | 15 | 174 | 559563 | 1598.6 | 1400 | 1362 | 349.2 |
| B | 4 | 81 | 3362458 | 10553.05 | 1502 | 1449 | 318.5 |
| B | 5 | 172 | 2079893 | 6526.0 | 1502 | 1449 | 318.5 |
| B | 4 | 206 | 1985740 | 6230.37 | 1502 | 1449 | 318.5 |
| C | 15 | 164 | 11304443 | 46437.02 | 877 | 868 | 243.4 |
| C | 15 | 224 | 5452492 | 22396.2 | 877 | 868 | 243.4 |
| C | 1 | 241 | 1765340 | 7248.75 | 877 | 868 | 243.4 |
| D | 8 | 176 | 17849043 | 66562.33 | 926 | 885 | 268.1 |
| D | 13 | 21 | 780734 | 2908.34 | 926 | 885 | 268.1 |
| D | 7 | 70 | 569670 | 2121.21 | 926 | 885 | 268.1 |
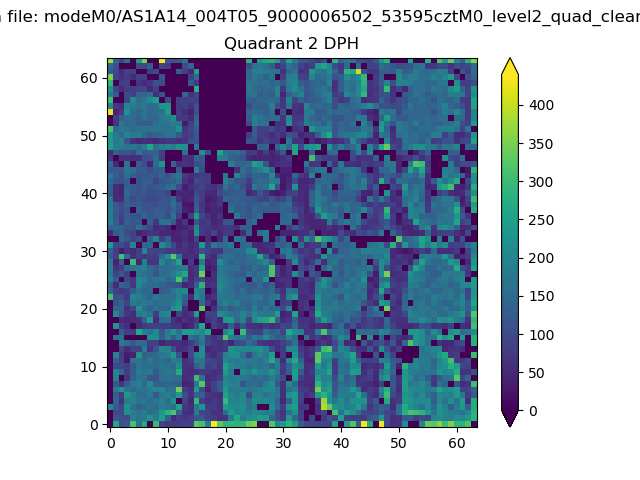
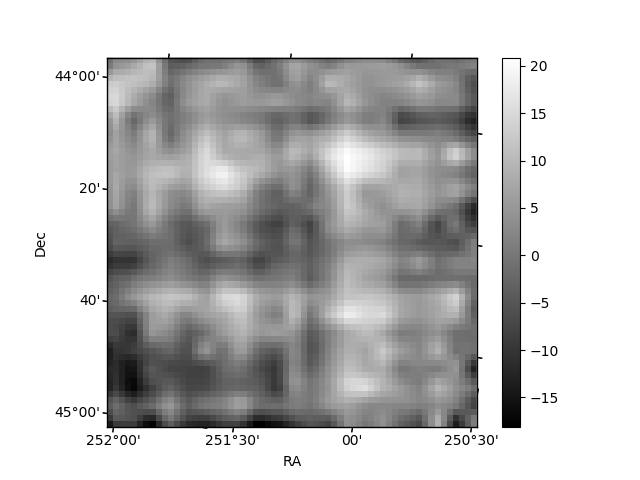
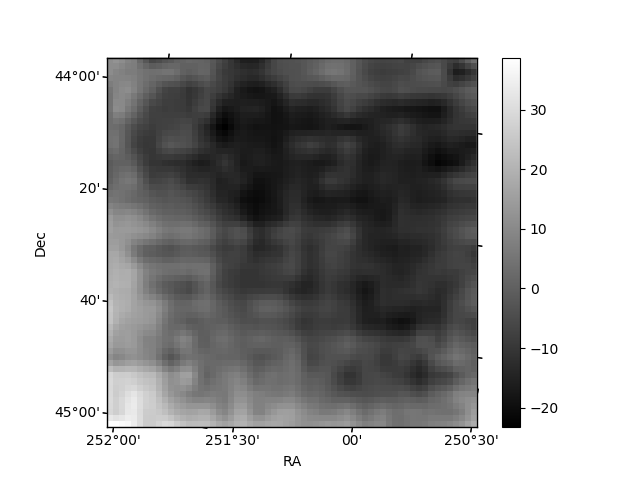
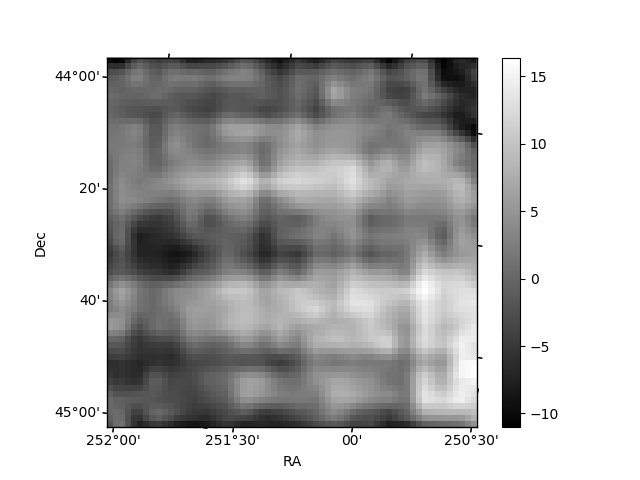
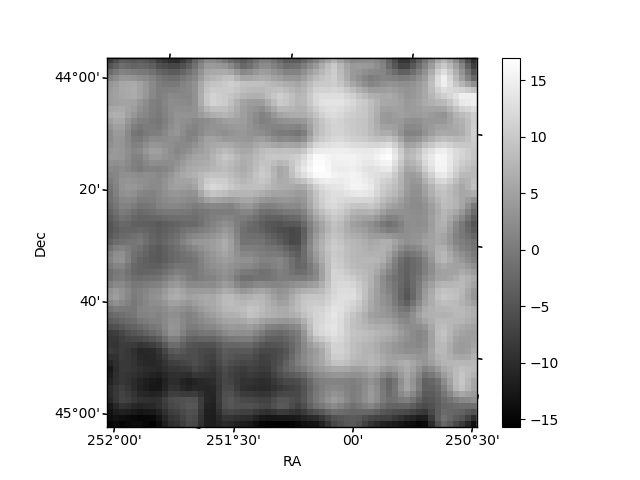
Histogram calculated using DETX and DETY for each event in the final _common_clean file
| Quadrant A | 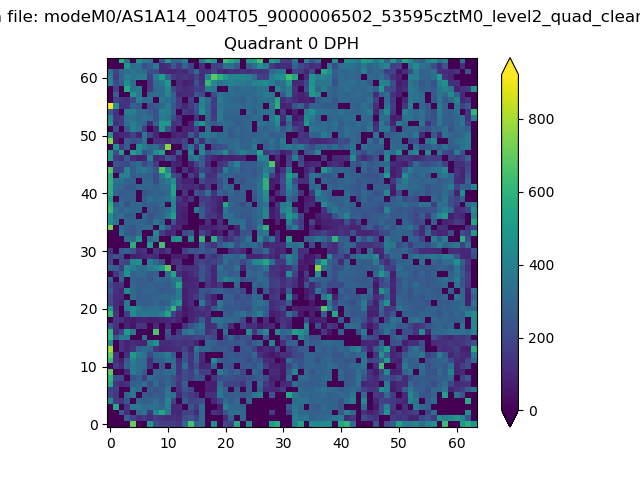 |
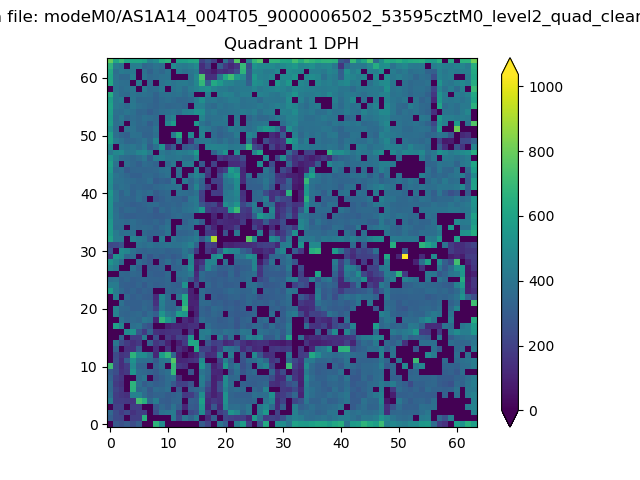 |
Quadrant B |
|---|---|---|---|
| Quadrant D | 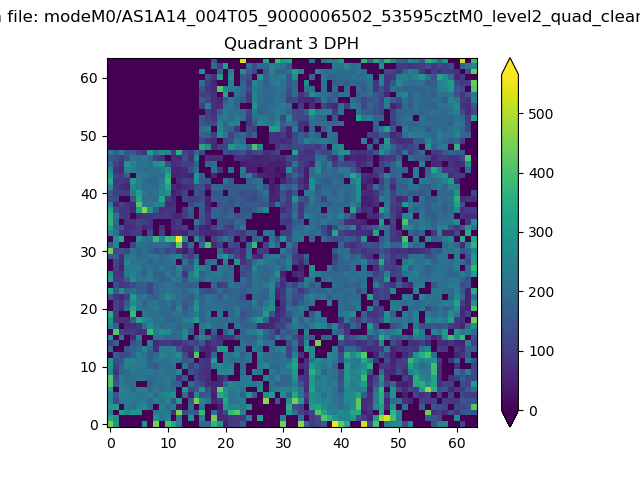 |
 |
Quadrant C |
| Plot type | Count rate plots | Images |
|---|---|---|
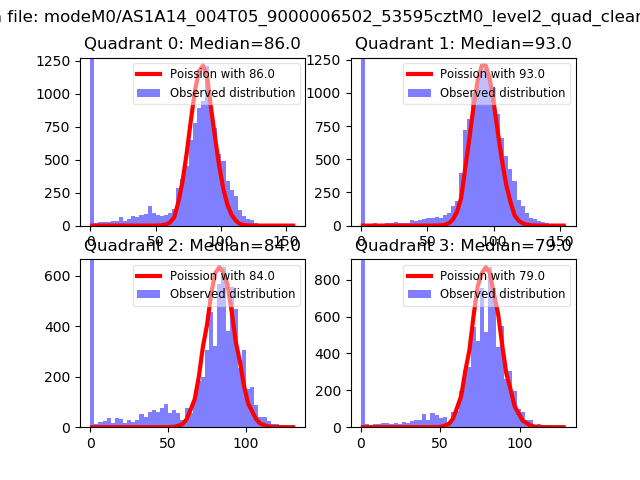
| Comparison with Poisson distribution Blue bars denote a histogram of data divided into 1 sec bins. Red curve is a Poisson curve with rate = median count rate of data. |
 |
 |
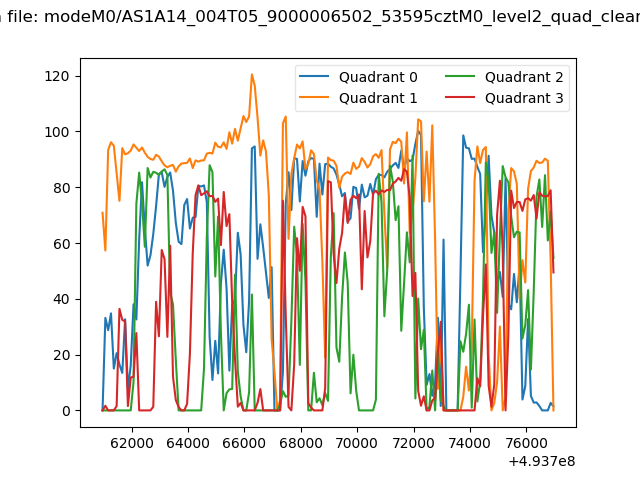
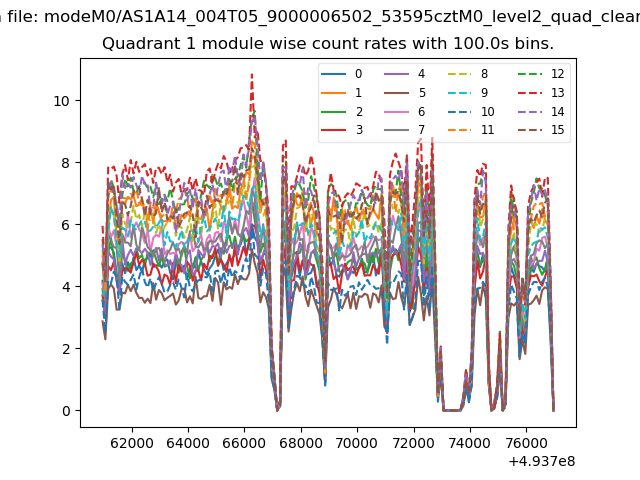
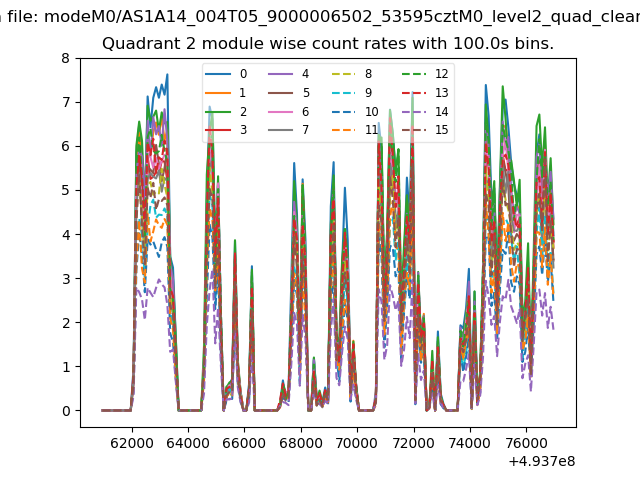
| Quadrant-wise count rates Data is divided into 100 sec bins |
 |
|
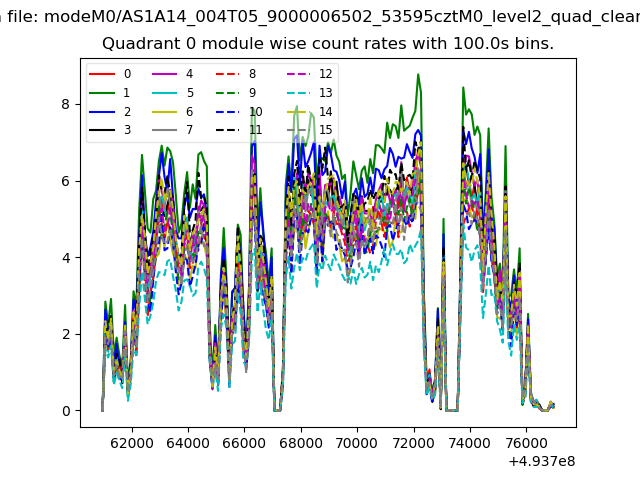
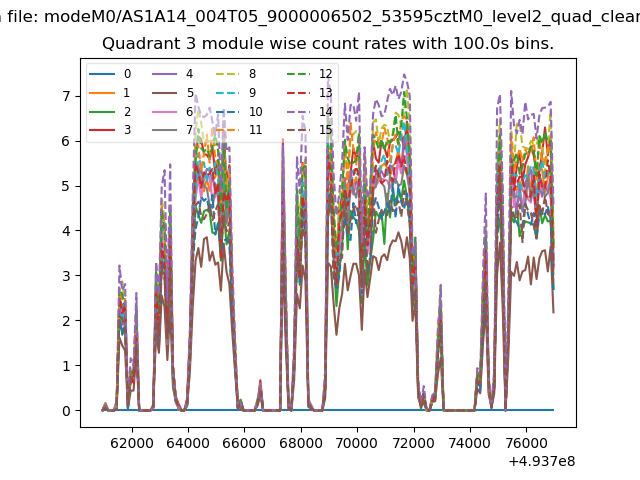
| Module-wise count rates for Quadrant A Data is divided into 100 sec bins |
 |
 |
| Module-wise count rates for Quadrant B Data is divided into 100 sec bins |
 |
 |
| Module-wise count rates for Quadrant C Data is divided into 100 sec bins |
 |
 |
| Module-wise count rates for Quadrant D Data is divided into 100 sec bins |
 |
 |
| Parameter | Plot |
|---|---|
| CZT HV Monitor |  |
| D_VDD | 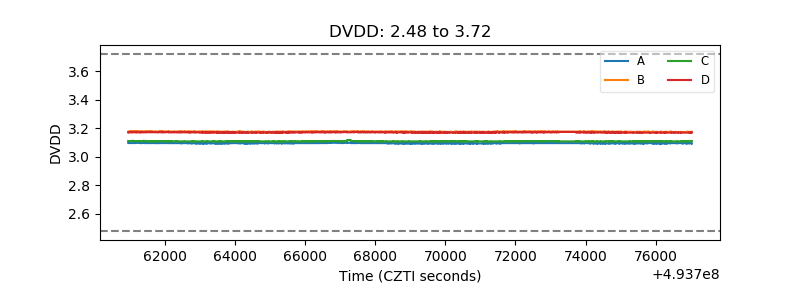 |
| Temperature 1 | 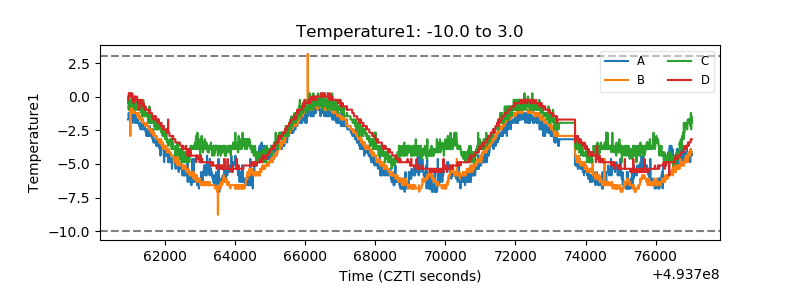 |
| Veto HV Monitor | 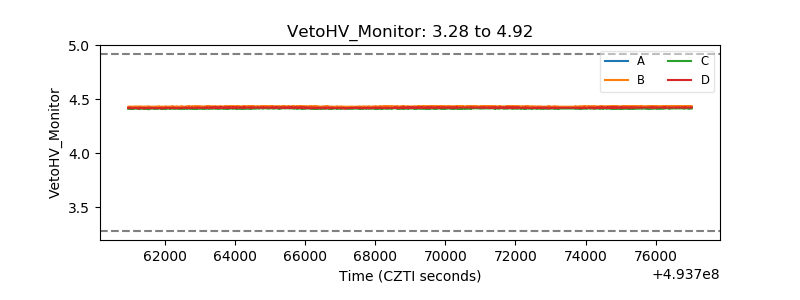 |
| Veto LLD | 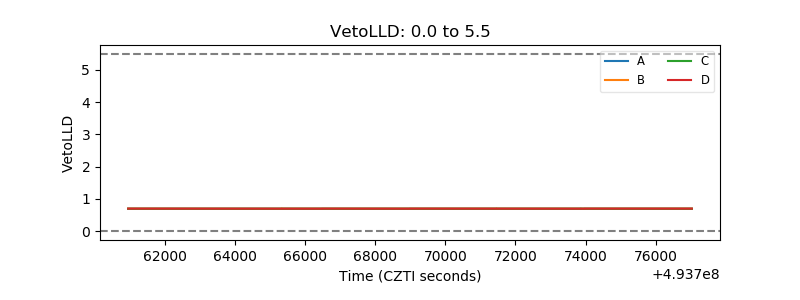 |
| Alpha Counter | 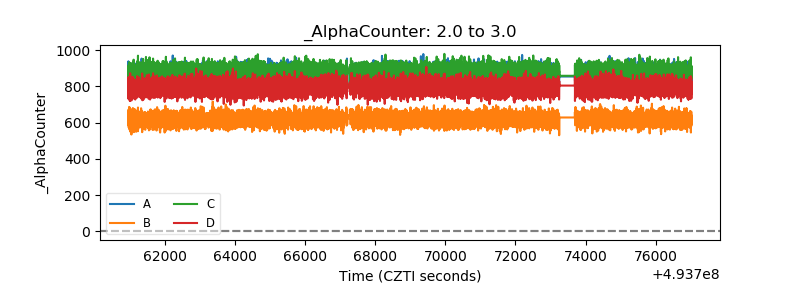 |
| _CPM_Rate | 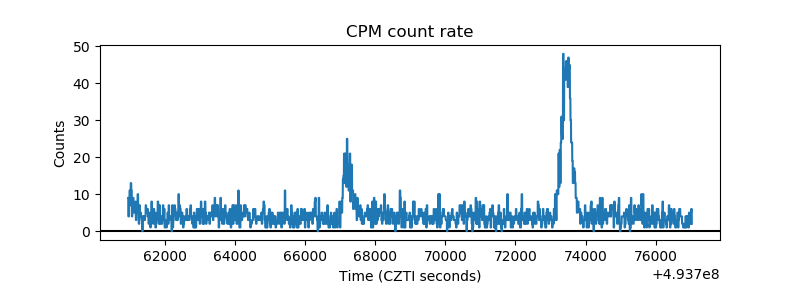 |
| CZT Counter | 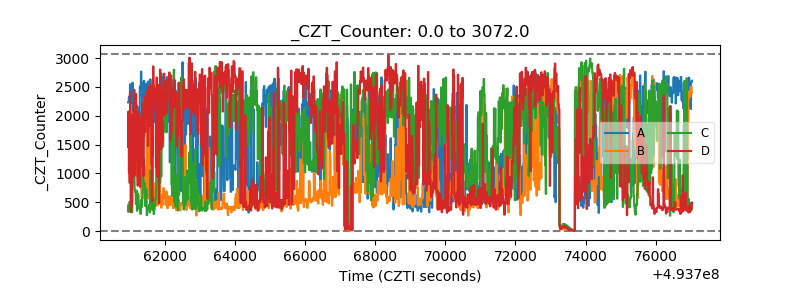 |
| +2.5 Volts monitor |  |
| +5 Volts monitor |  |
| _ROLL_ROT | 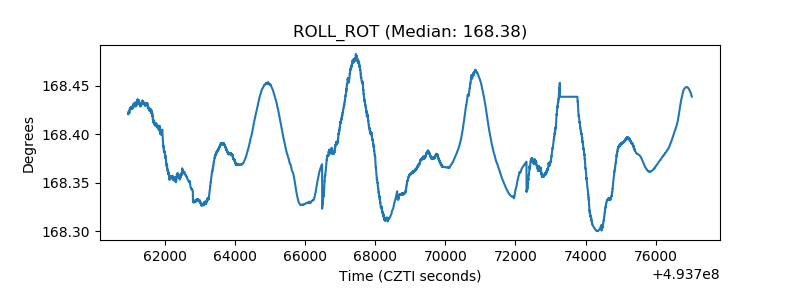 |
| _Roll_DEC | 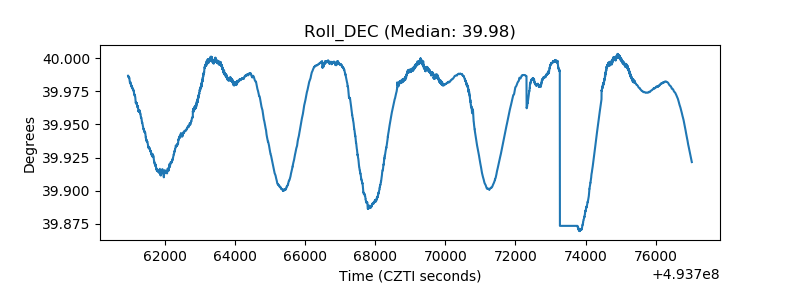 |
| _Roll_RA | 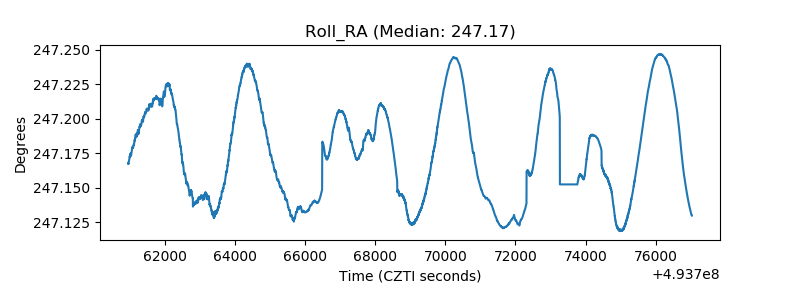 |
| Veto Counter | 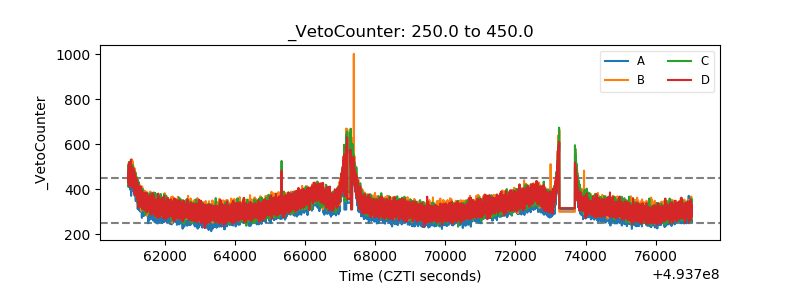 |