| Param | Original file | Final file |
|---|---|---|
| Filename | modeM0/AS1A14_004T05_9000006502_53596cztM0_level2.fits | modeM0/AS1A14_004T05_9000006502_53596cztM0_level2_quad_clean.evt |
| Size (bytes) | 1,447,937,280 | 96,707,520 |
| Size | 1.3 GB | 92.2 MB |
| Events in quadrant A | 17,947,358 | 397,553 |
| Events in quadrant B | 8,586,390 | 812,842 |
| Events in quadrant C | 14,989,747 | 462,486 |
| Events in quadrant D | 11,349,444 | 602,095 |
| Mode M9 | |||
|---|---|---|---|
| Quadrant | BADHDUFLAG | Total packets | Discarded packets |
| A | 0 | 15 | 0 |
| B | 0 | 15 | 0 |
| C | 0 | 15 | 0 |
| D | 0 | 15 | 0 |
| Mode SS | |||
|---|---|---|---|
| Quadrant | BADHDUFLAG | Total packets | Discarded packets |
| A | 0 | 192 | 0 |
| B | 0 | 192 | 0 |
| C | 0 | 192 | 0 |
| D | 0 | 192 | 0 |
| Mode M0 | |||
|---|---|---|---|
| Quadrant | BADHDUFLAG | Total packets | Discarded packets |
| A | 0 | 59700 | 2 |
| B | 0 | 32012 | 2 |
| C | 0 | 50957 | 2 |
| D | 0 | 40265 | 3 |
| Quadrant | Total seconds | Saturated seconds | Saturation percentage |
|---|---|---|---|
| A | 9407 | 5587 | 59.391942% |
| B | 9408 | 1533 | 16.294643% |
| C | 9408 | 4729 | 50.265731% |
| D | 9407 | 2505 | 26.629106% |
Noise dominated data is calculated using 1-second bins in cleaned event files. If a bin has >2000 counts, and if more than 50% of those come from <1% of pixels, then it is considered to be noise-dominated and hence unusable.
| Quadrant | # 1 sec bins | Bins with >0 counts | Bins with >2000 counts | High rate bins dominated by noise | Noise dominated (total time) | Noise dominated (detector-on time) | Marked lightcurve |
|---|---|---|---|---|---|---|---|
| A | 10918 | 9408 | 4771 | 4771 | 43.70% | 50.71% | 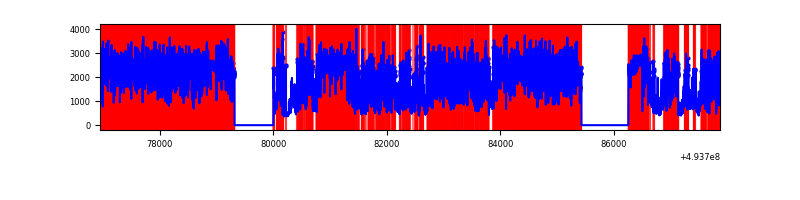 |
| B | 10919 | 9410 | 1208 | 1208 | 11.06% | 12.84% | 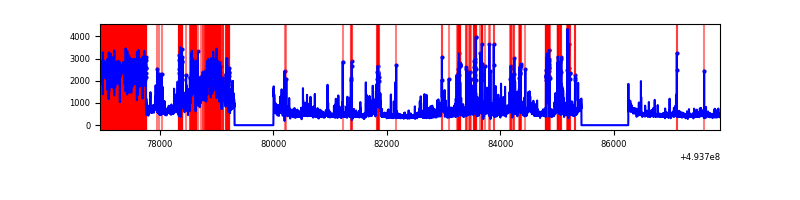 |
| C | 10919 | 9410 | 3452 | 3452 | 31.61% | 36.68% | 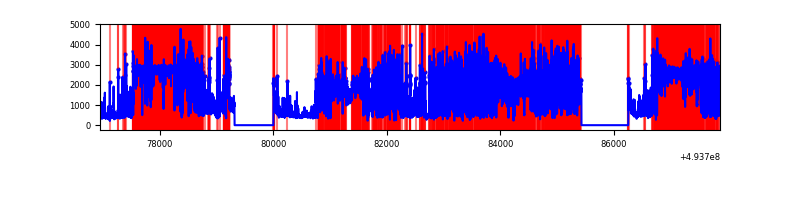 |
| D | 10918 | 9408 | 2075 | 2075 | 19.01% | 22.06% | 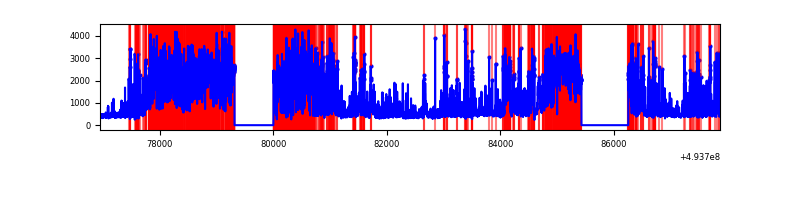 |
Top three noisy pixels from each quadrant. If the there are fewer than three noisy pixels in the level2.evt file, extra rows are filled as -1
| Pixel properties | Quadrant properties | ||||||
|---|---|---|---|---|---|---|---|
| Quadrant | DetID | PixID | Counts | Sigma | Mean | Median | Sigma |
| A | 3 | 62 | 10728537 | 55609.18 | 776 | 755 | 192.9 |
| A | 12 | 115 | 3320391 | 17207.87 | 776 | 755 | 192.9 |
| A | 15 | 174 | 306350 | 1584.1 | 776 | 755 | 192.9 |
| B | 4 | 81 | 2437972 | 11816.46 | 960 | 927 | 206.2 |
| B | 10 | 28 | 482640 | 2335.67 | 960 | 927 | 206.2 |
| B | 2 | 249 | 381829 | 1846.87 | 960 | 927 | 206.2 |
| C | 15 | 224 | 5133949 | 27023.85 | 694 | 688 | 190.0 |
| C | 1 | 241 | 3891764 | 20484.42 | 694 | 688 | 190.0 |
| C | 15 | 164 | 2054101 | 10810.11 | 694 | 688 | 190.0 |
| D | 8 | 176 | 4795937 | 19078.85 | 868 | 830 | 251.3 |
| D | 10 | 172 | 961784 | 3823.46 | 868 | 830 | 251.3 |
| D | 15 | 43 | 506552 | 2012.17 | 868 | 830 | 251.3 |
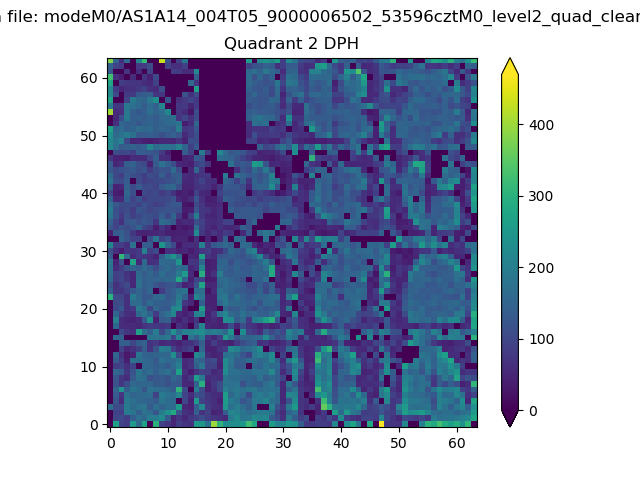
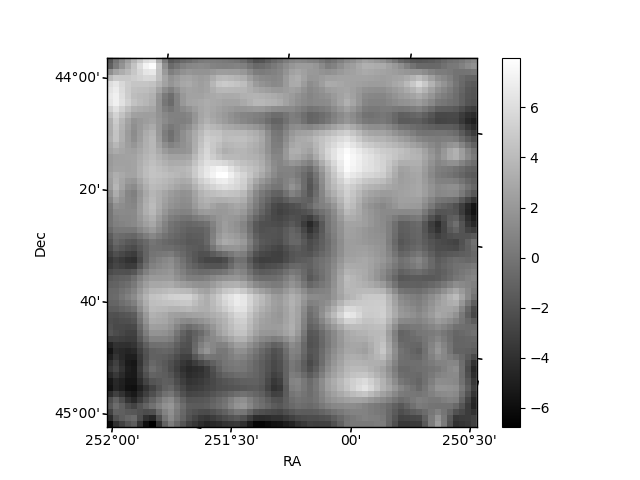
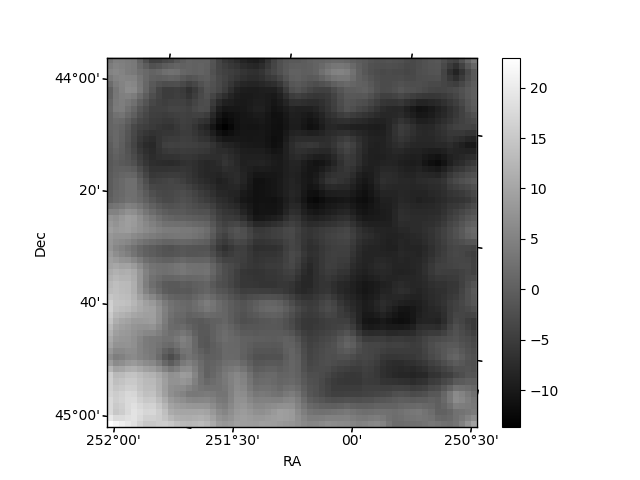
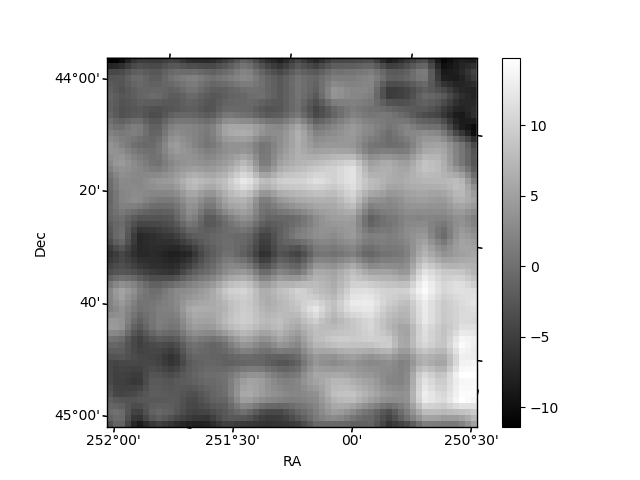
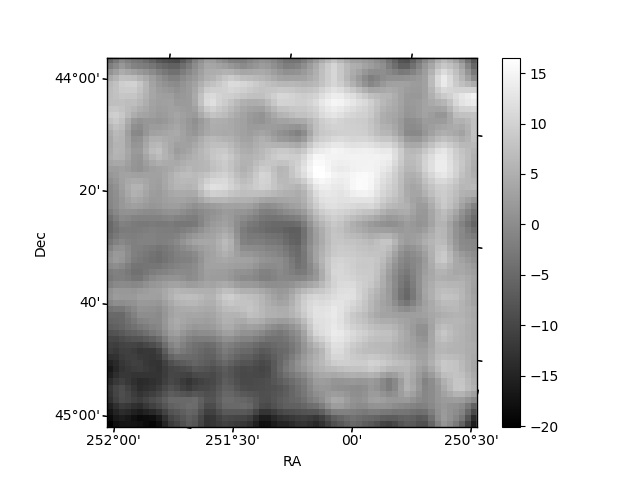
Histogram calculated using DETX and DETY for each event in the final _common_clean file
| Quadrant A | 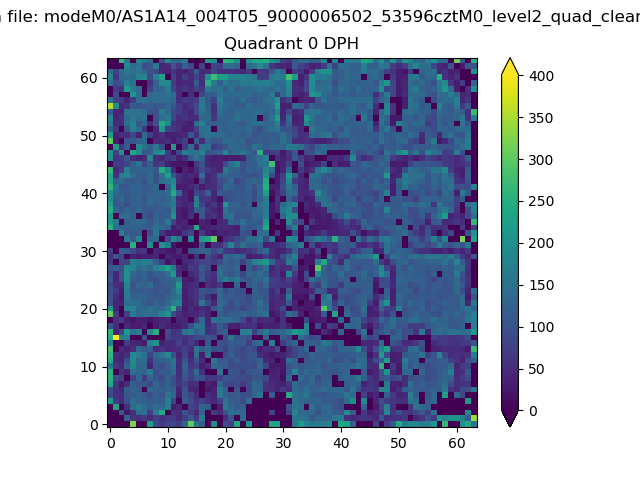 |
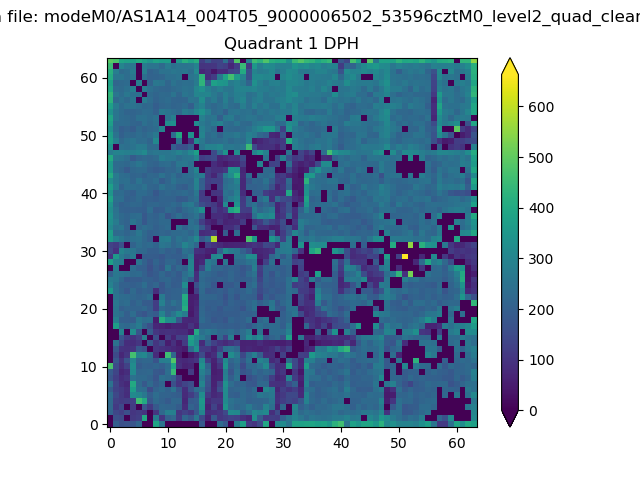 |
Quadrant B |
|---|---|---|---|
| Quadrant D | 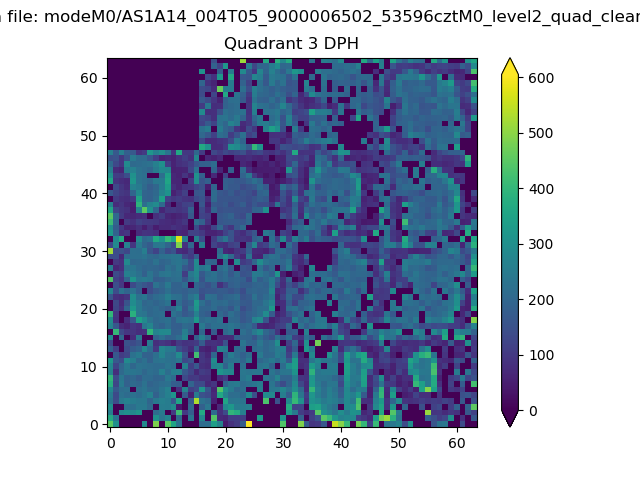 |
 |
Quadrant C |
| Plot type | Count rate plots | Images |
|---|---|---|
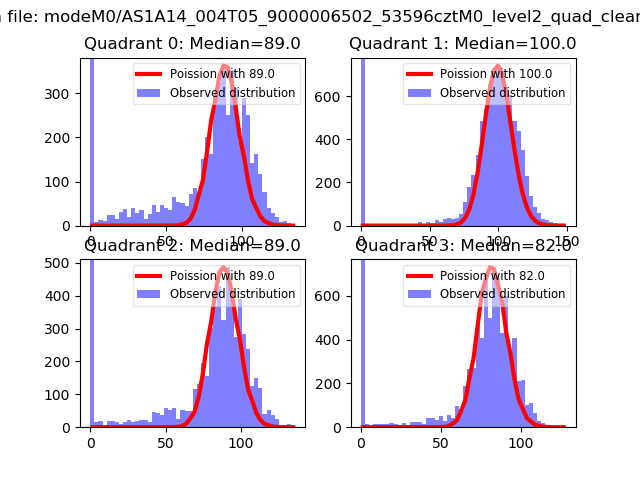
| Comparison with Poisson distribution Blue bars denote a histogram of data divided into 1 sec bins. Red curve is a Poisson curve with rate = median count rate of data. |
 |
 |
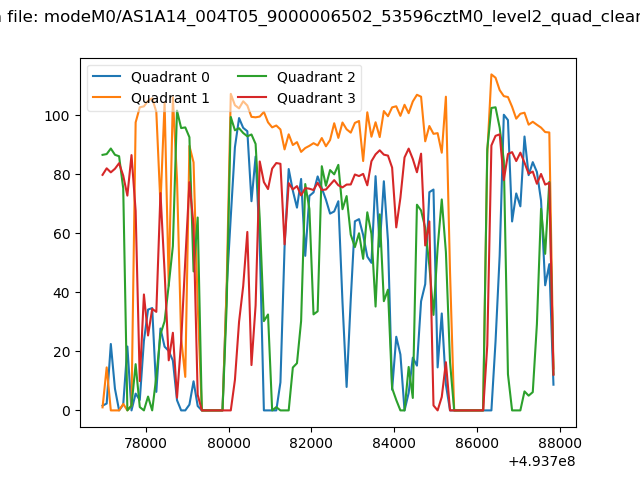
| Quadrant-wise count rates Data is divided into 100 sec bins |
 |
|
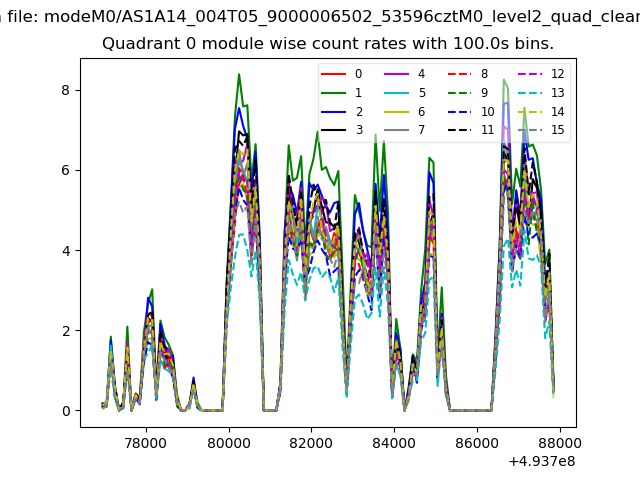
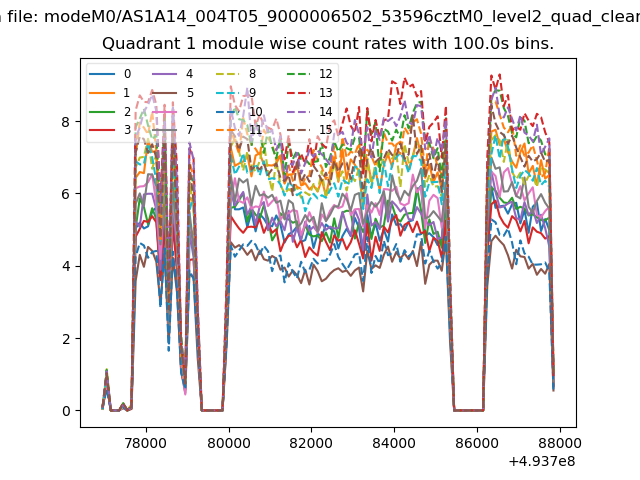
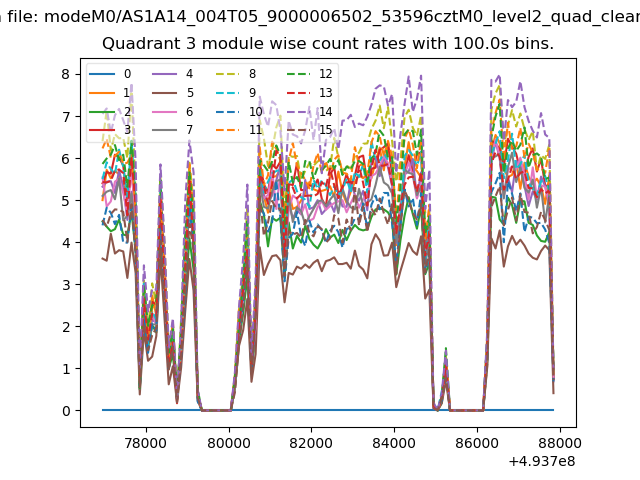
| Module-wise count rates for Quadrant A Data is divided into 100 sec bins |
 |
 |
| Module-wise count rates for Quadrant B Data is divided into 100 sec bins |
 |
 |
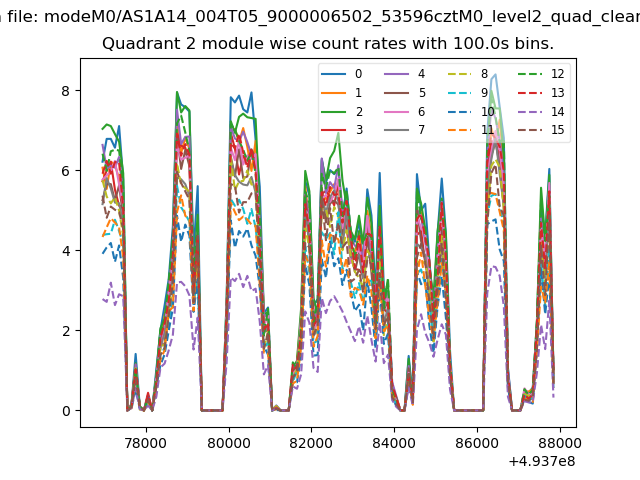
| Module-wise count rates for Quadrant C Data is divided into 100 sec bins |
 |
 |
| Module-wise count rates for Quadrant D Data is divided into 100 sec bins |
 |
 |
| Parameter | Plot |
|---|---|
| CZT HV Monitor | 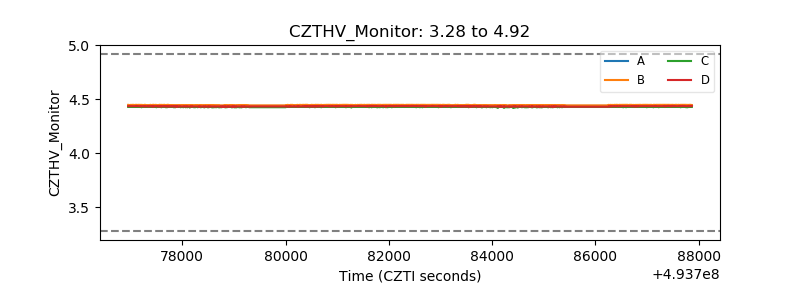 |
| D_VDD | 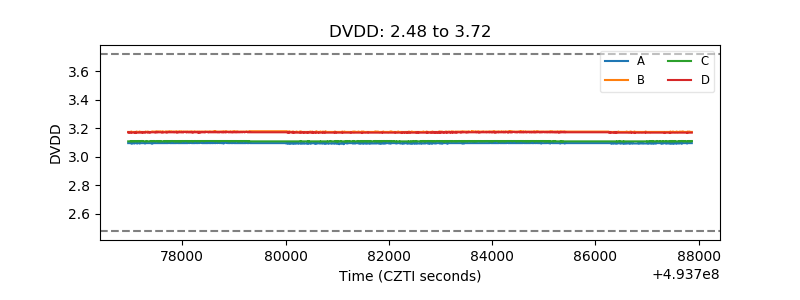 |
| Temperature 1 | 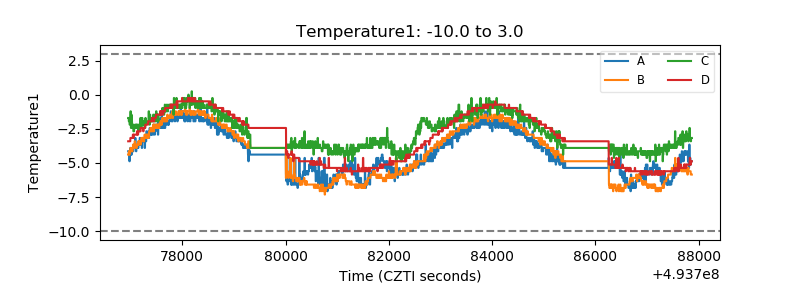 |
| Veto HV Monitor | 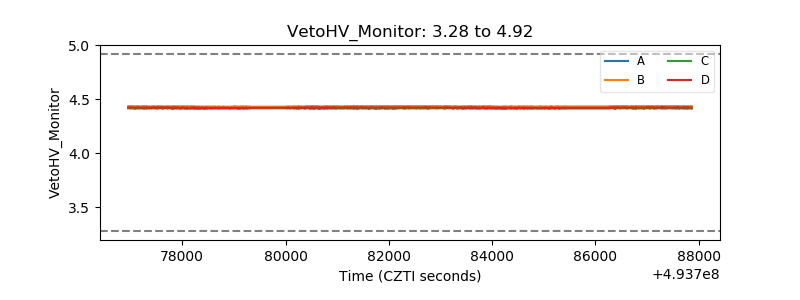 |
| Veto LLD | 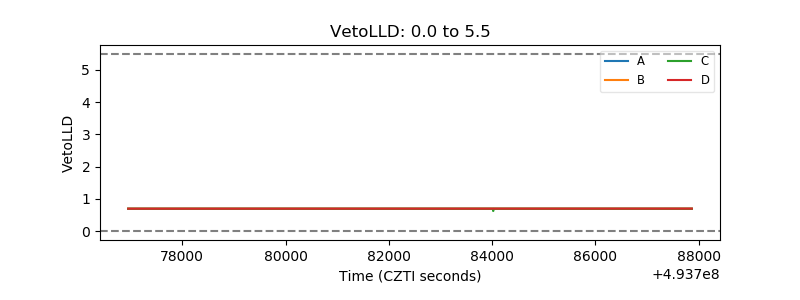 |
| Alpha Counter | 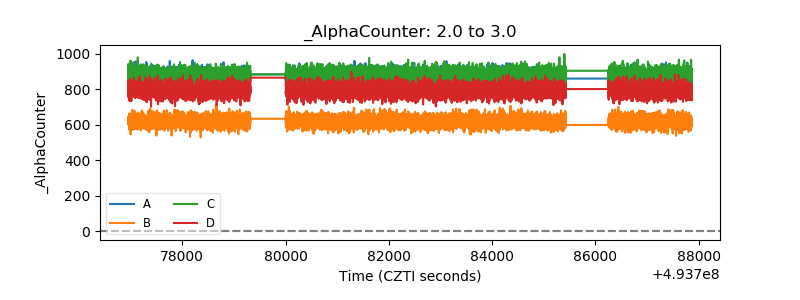 |
| _CPM_Rate | 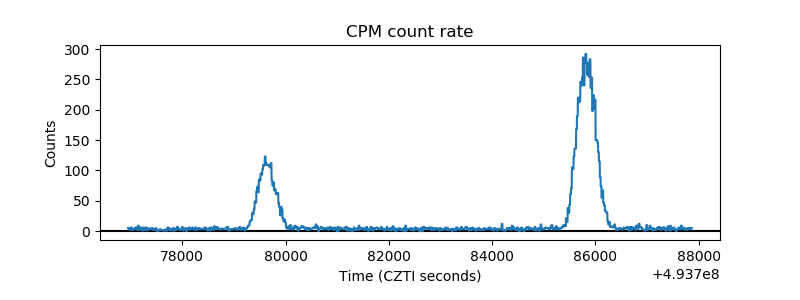 |
| CZT Counter | 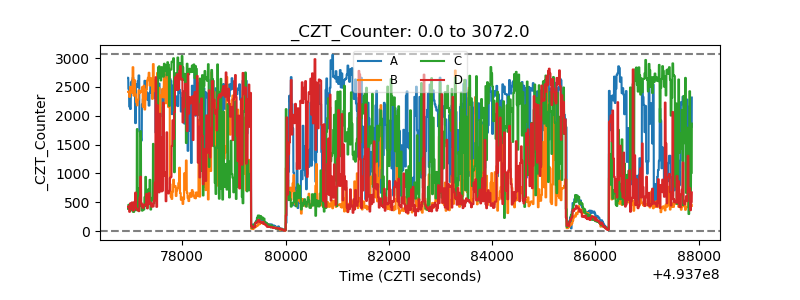 |
| +2.5 Volts monitor |  |
| +5 Volts monitor |  |
| _ROLL_ROT | 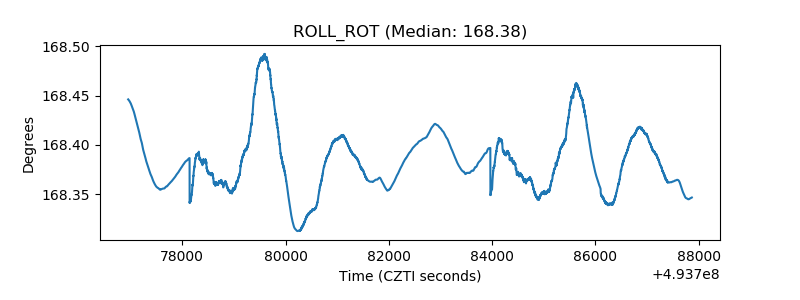 |
| _Roll_DEC | 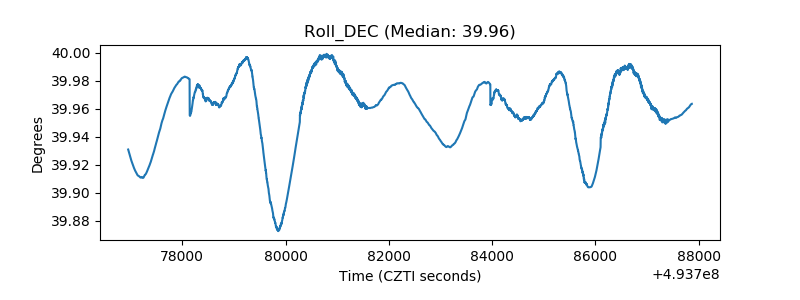 |
| _Roll_RA | 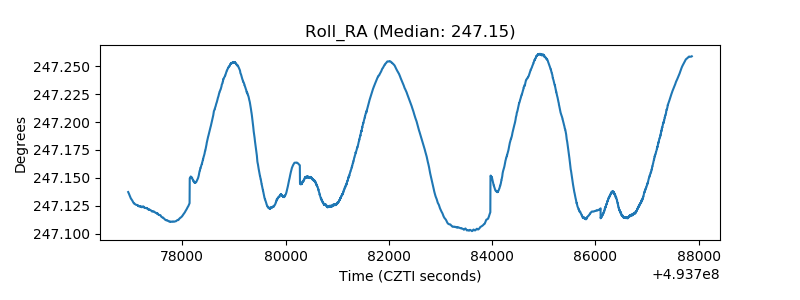 |
| Veto Counter | 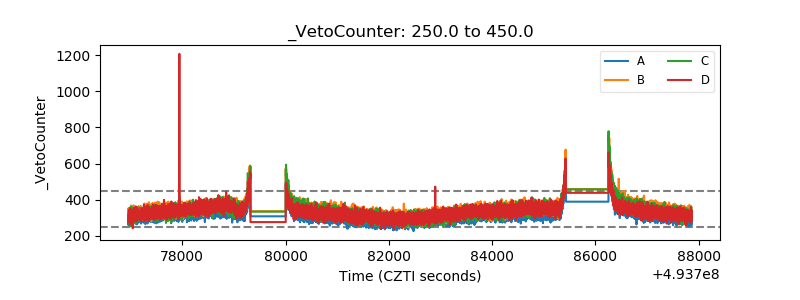 |