| Param | Original file | Final file |
|---|---|---|
| Filename | modeM0/AS1A14_004T05_9000006502_53599cztM0_level2.fits | modeM0/AS1A14_004T05_9000006502_53599cztM0_level2_quad_clean.evt |
| Size (bytes) | 695,790,720 | 86,235,840 |
| Size | 663.6 MB | 82.2 MB |
| Events in quadrant A | 7,040,289 | 564,644 |
| Events in quadrant B | 4,457,543 | 637,757 |
| Events in quadrant C | 9,131,288 | 424,934 |
| Events in quadrant D | 4,636,260 | 541,766 |
| Mode M9 | |||
|---|---|---|---|
| Quadrant | BADHDUFLAG | Total packets | Discarded packets |
| A | 0 | 11 | 0 |
| B | 0 | 11 | 0 |
| C | 0 | 11 | 0 |
| D | 0 | 11 | 0 |
| Mode SS | |||
|---|---|---|---|
| Quadrant | BADHDUFLAG | Total packets | Discarded packets |
| A | 0 | 128 | 0 |
| B | 0 | 128 | 0 |
| C | 0 | 128 | 0 |
| D | 0 | 128 | 0 |
| Mode M0 | |||
|---|---|---|---|
| Quadrant | BADHDUFLAG | Total packets | Discarded packets |
| A | 0 | 25321 | 2 |
| B | 0 | 17387 | 1 |
| C | 0 | 31479 | 1 |
| D | 0 | 18101 | 1 |
| Quadrant | Total seconds | Saturated seconds | Saturation percentage |
|---|---|---|---|
| A | 6335 | 956 | 15.090766% |
| B | 6335 | 537 | 8.476717% |
| C | 6336 | 2080 | 32.828283% |
| D | 6336 | 384 | 6.060606% |
Noise dominated data is calculated using 1-second bins in cleaned event files. If a bin has >2000 counts, and if more than 50% of those come from <1% of pixels, then it is considered to be noise-dominated and hence unusable.
| Quadrant | # 1 sec bins | Bins with >0 counts | Bins with >2000 counts | High rate bins dominated by noise | Noise dominated (total time) | Noise dominated (detector-on time) | Marked lightcurve |
|---|---|---|---|---|---|---|---|
| A | 7445 | 6335 | 704 | 704 | 9.46% | 11.11% | 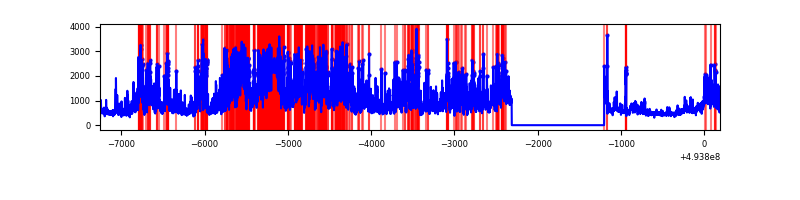 |
| B | 7445 | 6335 | 356 | 356 | 4.78% | 5.62% | 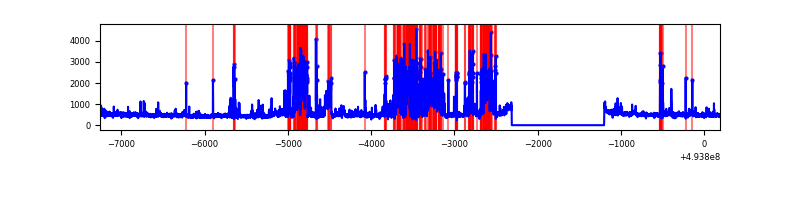 |
| C | 7446 | 6336 | 1900 | 1900 | 25.52% | 29.99% | 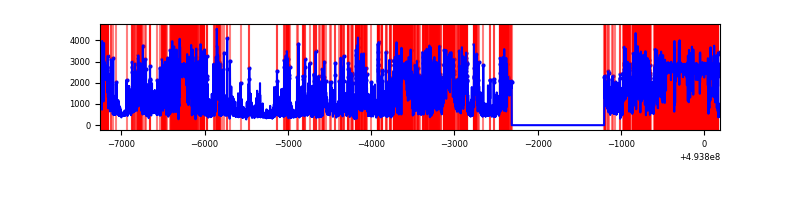 |
| D | 7446 | 6336 | 317 | 317 | 4.26% | 5.00% | 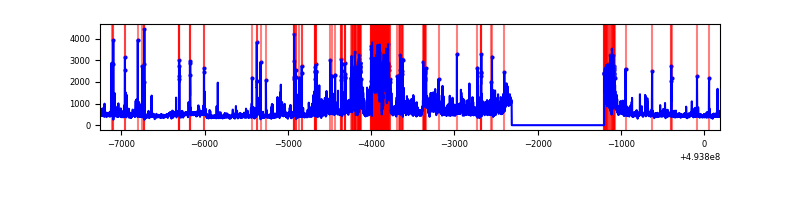 |
Top three noisy pixels from each quadrant. If the there are fewer than three noisy pixels in the level2.evt file, extra rows are filled as -1
| Pixel properties | Quadrant properties | ||||||
|---|---|---|---|---|---|---|---|
| Quadrant | DetID | PixID | Counts | Sigma | Mean | Median | Sigma |
| A | 3 | 62 | 3912663 | 23096.75 | 681 | 662 | 169.4 |
| A | 15 | 174 | 290849 | 1713.29 | 681 | 662 | 169.4 |
| A | 3 | 63 | 101079 | 592.87 | 681 | 662 | 169.4 |
| B | 5 | 172 | 1218577 | 8347.1 | 678 | 653 | 145.9 |
| B | 2 | 249 | 108641 | 740.1 | 678 | 653 | 145.9 |
| B | 15 | 32 | 88237 | 600.26 | 678 | 653 | 145.9 |
| C | 1 | 241 | 3608398 | 23151.96 | 569 | 567 | 155.8 |
| C | 15 | 224 | 2189497 | 14046.67 | 569 | 567 | 155.8 |
| C | 4 | 5 | 317187 | 2031.8 | 569 | 567 | 155.8 |
| D | 8 | 176 | 1107167 | 5837.34 | 671 | 642 | 189.6 |
| D | 10 | 172 | 193800 | 1018.98 | 671 | 642 | 189.6 |
| D | 2 | 120 | 96710 | 506.8 | 671 | 642 | 189.6 |
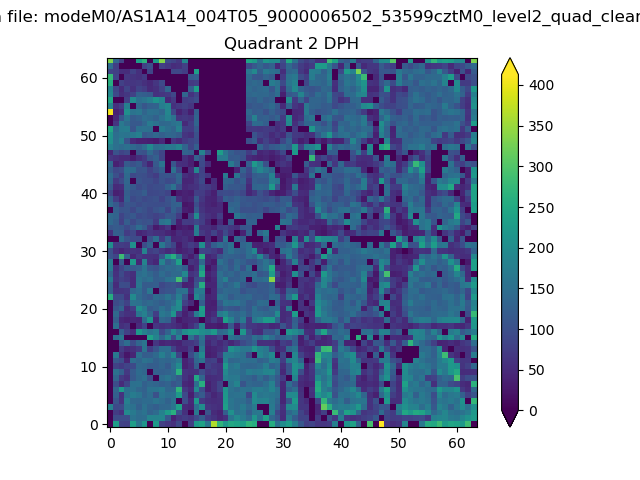
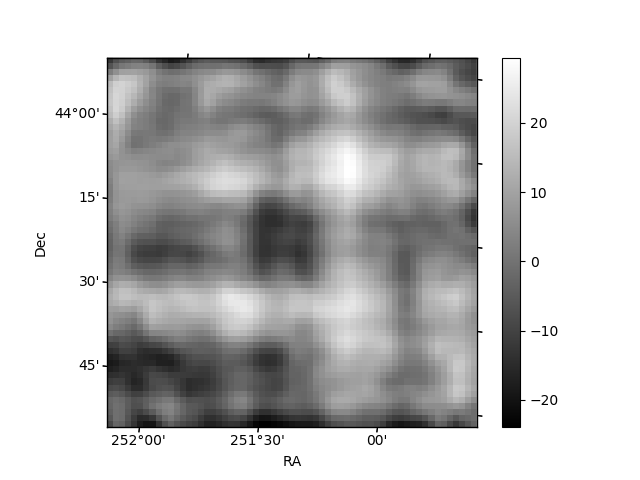
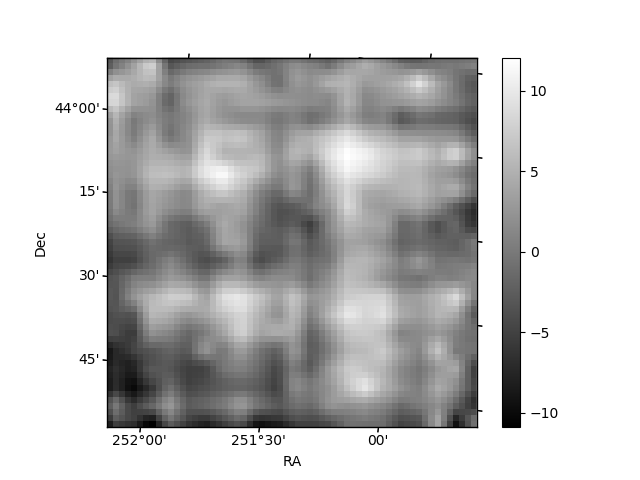
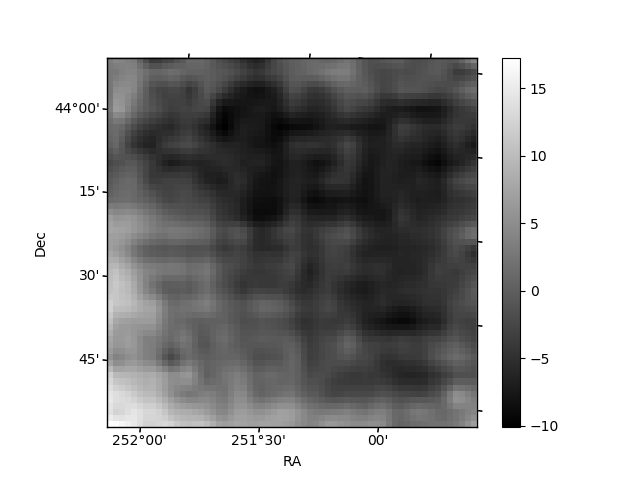
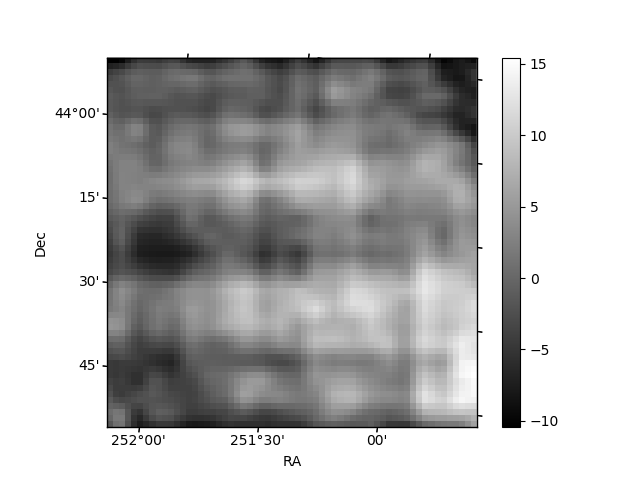
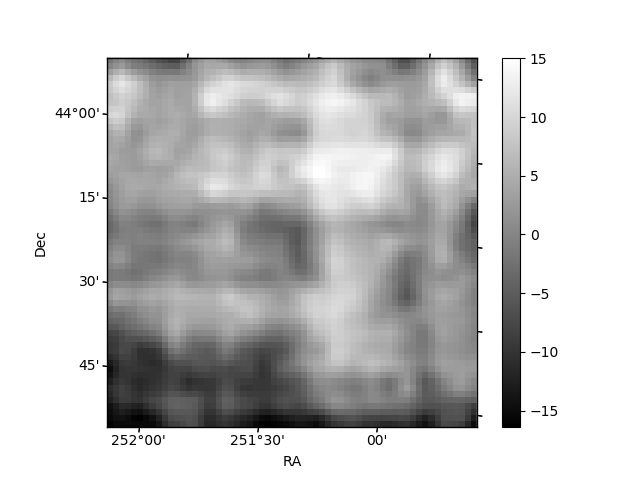
Histogram calculated using DETX and DETY for each event in the final _common_clean file
| Quadrant A | 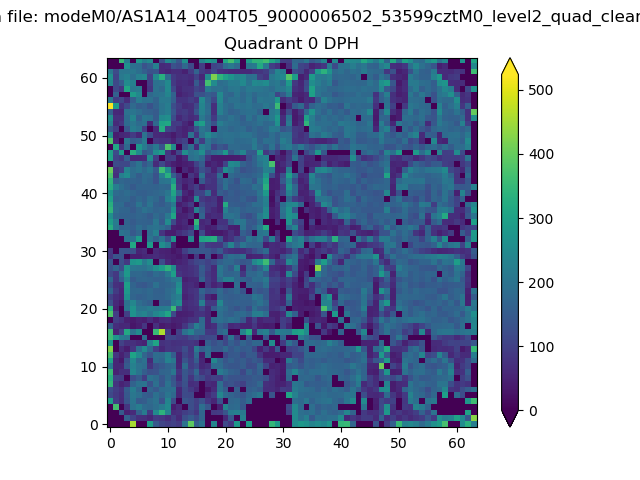 |
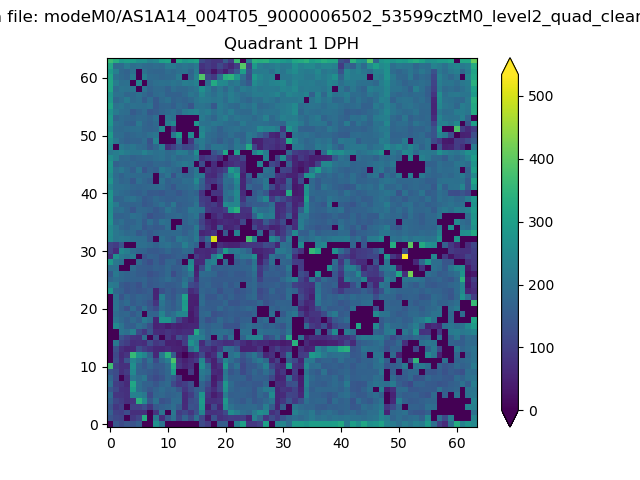 |
Quadrant B |
|---|---|---|---|
| Quadrant D | 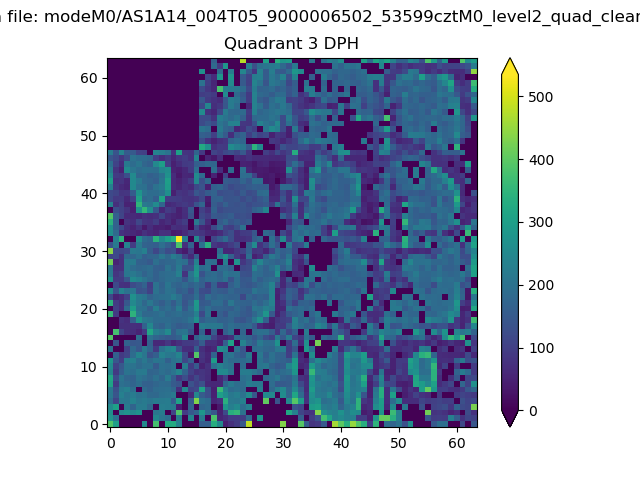 |
 |
Quadrant C |
| Plot type | Count rate plots | Images |
|---|---|---|
| Comparison with Poisson distribution Blue bars denote a histogram of data divided into 1 sec bins. Red curve is a Poisson curve with rate = median count rate of data. |
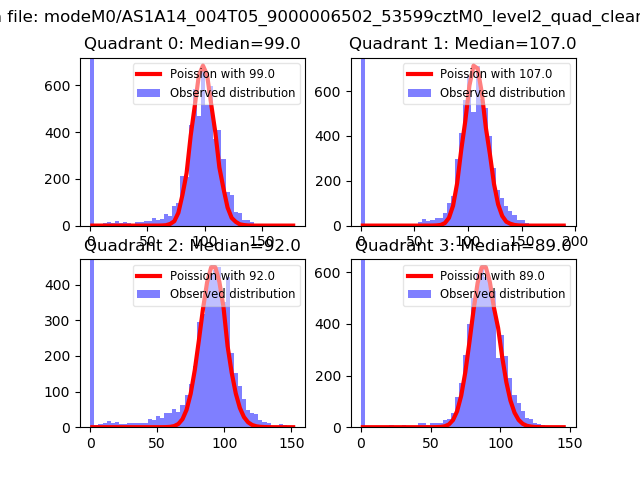 |
 |
| Quadrant-wise count rates Data is divided into 100 sec bins |
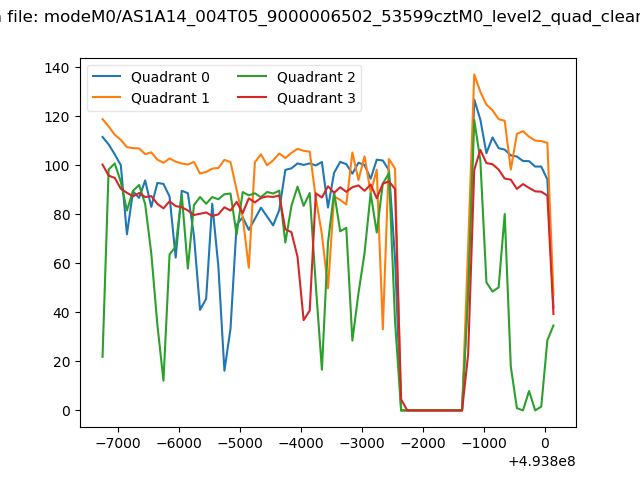 |
|
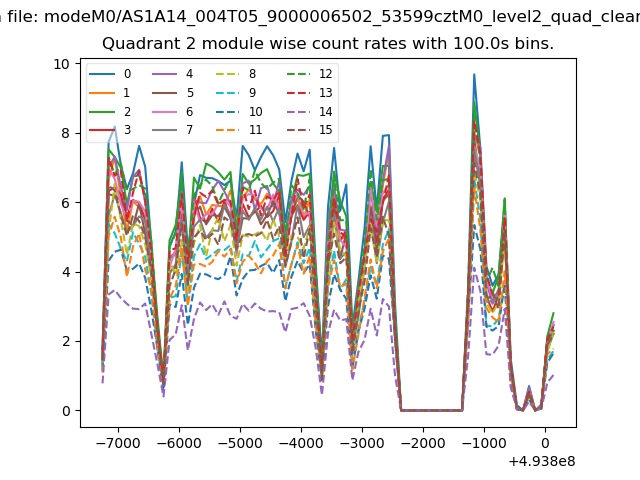
| Module-wise count rates for Quadrant A Data is divided into 100 sec bins |
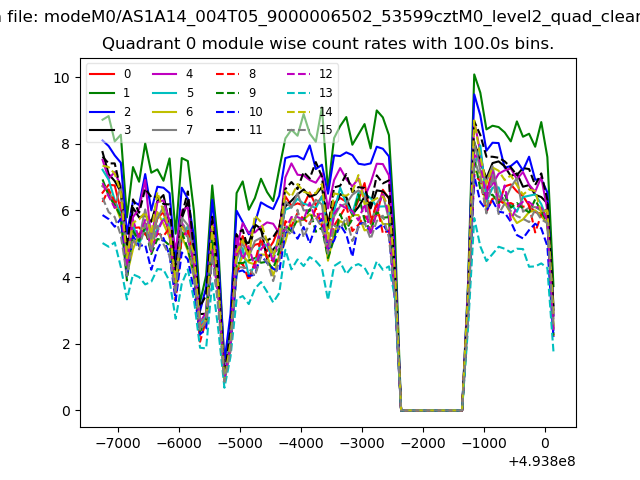 |
 |
| Module-wise count rates for Quadrant B Data is divided into 100 sec bins |
 |
 |
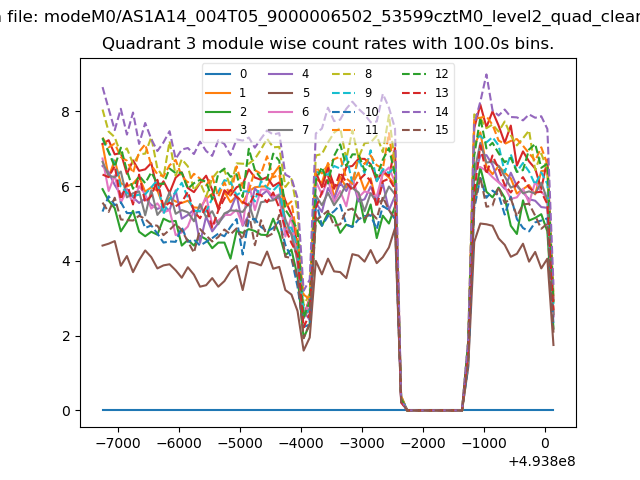
| Module-wise count rates for Quadrant C Data is divided into 100 sec bins |
 |
 |
| Module-wise count rates for Quadrant D Data is divided into 100 sec bins |
 |
 |
| Parameter | Plot |
|---|---|
| CZT HV Monitor | 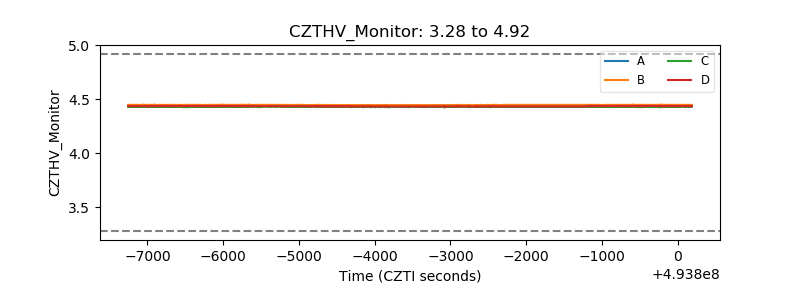 |
| D_VDD | 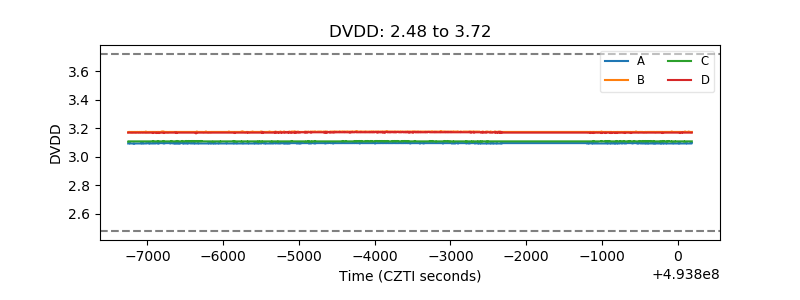 |
| Temperature 1 | 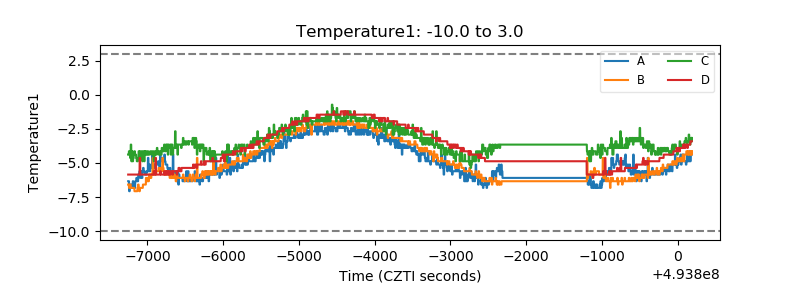 |
| Veto HV Monitor | 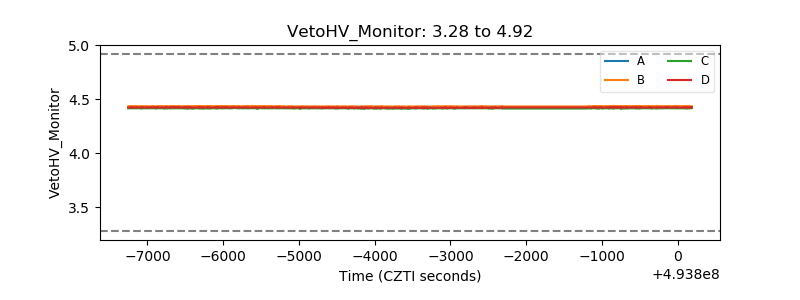 |
| Veto LLD | 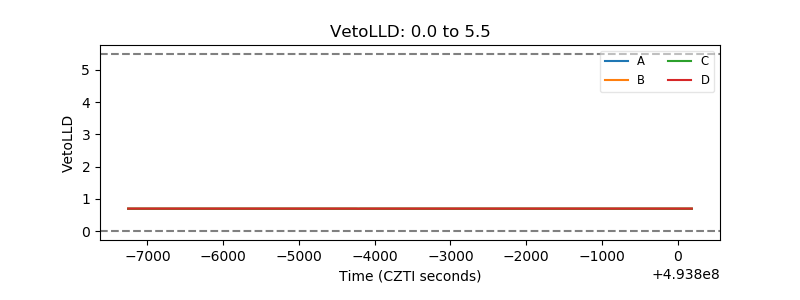 |
| Alpha Counter | 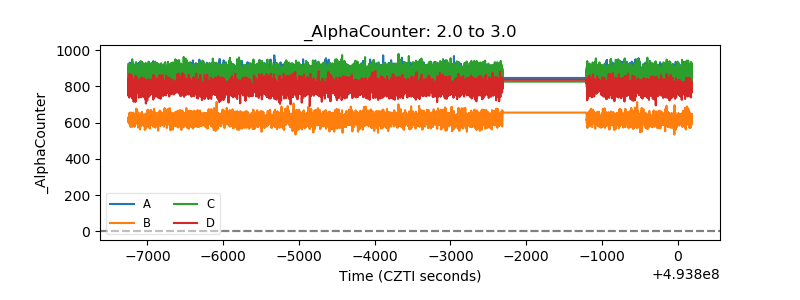 |
| _CPM_Rate | 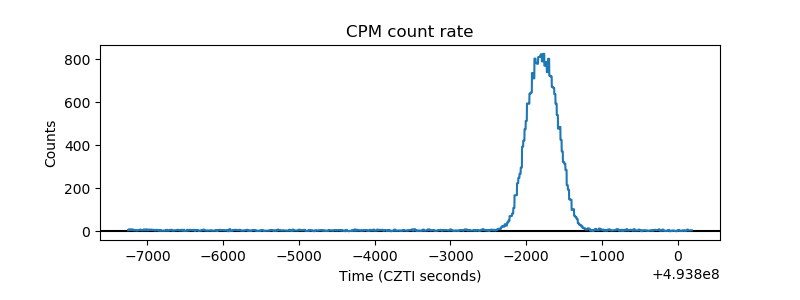 |
| CZT Counter | 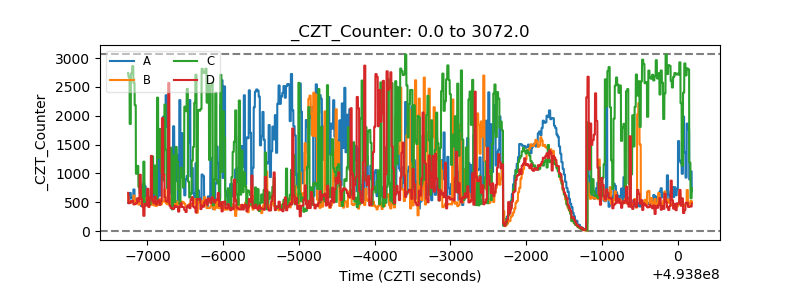 |
| +2.5 Volts monitor |  |
| +5 Volts monitor |  |
| _ROLL_ROT | 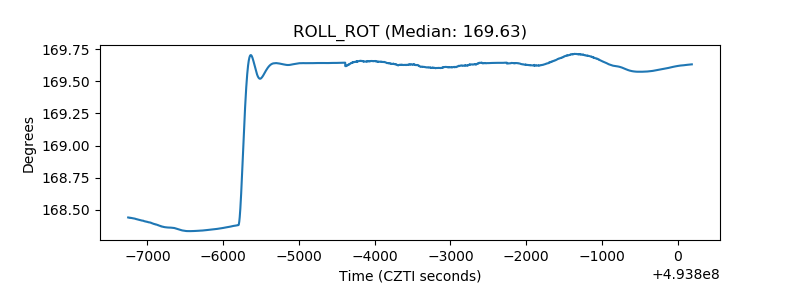 |
| _Roll_DEC | 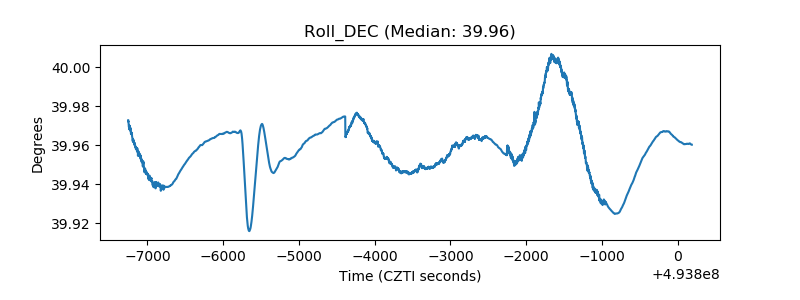 |
| _Roll_RA | 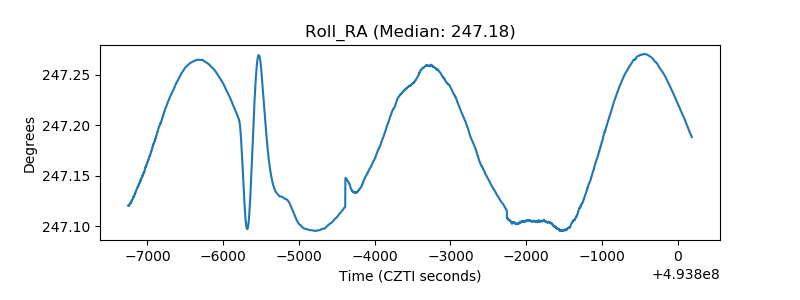 |
| Veto Counter | 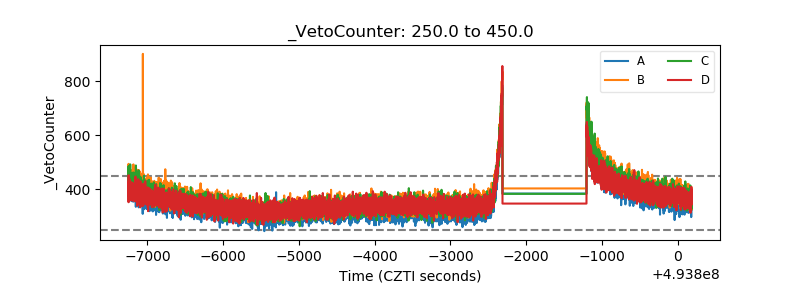 |