| Param | Original file | Final file |
|---|---|---|
| Filename | modeM0/AS1A14_004T05_9000006502_53601cztM0_level2.fits | modeM0/AS1A14_004T05_9000006502_53601cztM0_level2_quad_clean.evt |
| Size (bytes) | 696,283,200 | 89,660,160 |
| Size | 664.0 MB | 85.5 MB |
| Events in quadrant A | 3,785,492 | 662,629 |
| Events in quadrant B | 5,589,600 | 655,149 |
| Events in quadrant C | 7,792,652 | 524,145 |
| Events in quadrant D | 8,113,832 | 429,066 |
| Mode M9 | |||
|---|---|---|---|
| Quadrant | BADHDUFLAG | Total packets | Discarded packets |
| A | 0 | 12 | 0 |
| B | 0 | 12 | 0 |
| C | 0 | 12 | 0 |
| D | 0 | 12 | 0 |
| Mode SS | |||
|---|---|---|---|
| Quadrant | BADHDUFLAG | Total packets | Discarded packets |
| A | 0 | 130 | 0 |
| B | 0 | 130 | 0 |
| C | 0 | 130 | 0 |
| D | 0 | 130 | 0 |
| Mode M0 | |||
|---|---|---|---|
| Quadrant | BADHDUFLAG | Total packets | Discarded packets |
| A | 0 | 15410 | 2 |
| B | 0 | 20907 | 2 |
| C | 0 | 27543 | 8 |
| D | 0 | 28462 | 2 |
| Quadrant | Total seconds | Saturated seconds | Saturation percentage |
|---|---|---|---|
| A | 6357 | 209 | 3.287714% |
| B | 6358 | 736 | 11.575967% |
| C | 6357 | 1432 | 22.526349% |
| D | 6357 | 1963 | 30.879346% |
Noise dominated data is calculated using 1-second bins in cleaned event files. If a bin has >2000 counts, and if more than 50% of those come from <1% of pixels, then it is considered to be noise-dominated and hence unusable.
| Quadrant | # 1 sec bins | Bins with >0 counts | Bins with >2000 counts | High rate bins dominated by noise | Noise dominated (total time) | Noise dominated (detector-on time) | Marked lightcurve |
|---|---|---|---|---|---|---|---|
| A | 7537 | 6359 | 72 | 72 | 0.96% | 1.13% | 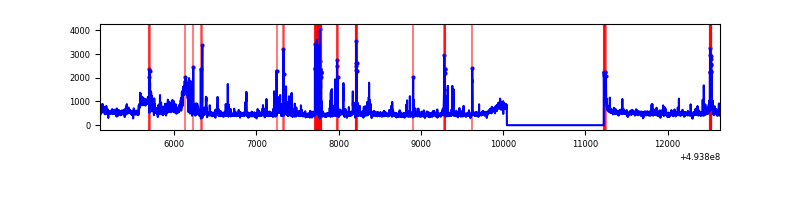 |
| B | 7538 | 6360 | 319 | 319 | 4.23% | 5.02% | 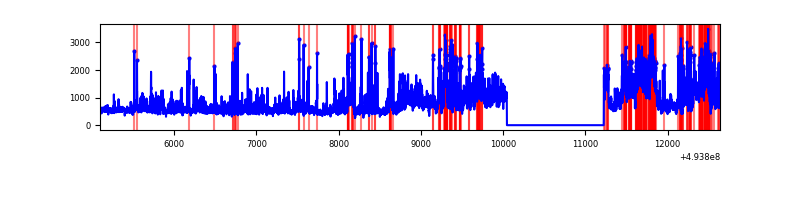 |
| C | 7537 | 6359 | 1162 | 1162 | 15.42% | 18.27% | 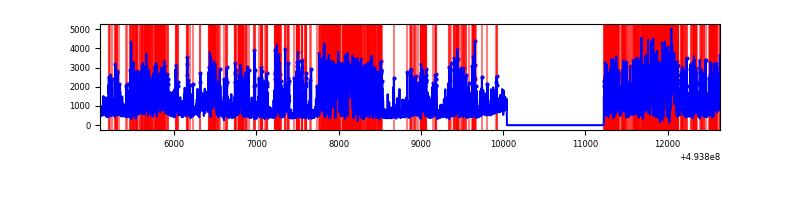 |
| D | 7537 | 6359 | 1699 | 1699 | 22.54% | 26.72% | 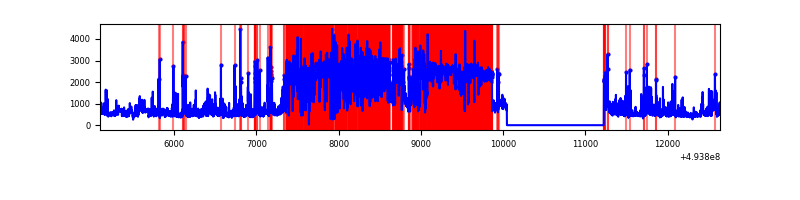 |
Top three noisy pixels from each quadrant. If the there are fewer than three noisy pixels in the level2.evt file, extra rows are filled as -1
| Pixel properties | Quadrant properties | ||||||
|---|---|---|---|---|---|---|---|
| Quadrant | DetID | PixID | Counts | Sigma | Mean | Median | Sigma |
| A | 15 | 174 | 347883 | 1895.06 | 742 | 725 | 183.2 |
| A | 3 | 62 | 157598 | 856.33 | 742 | 725 | 183.2 |
| A | 3 | 63 | 110633 | 599.96 | 742 | 725 | 183.2 |
| B | 4 | 206 | 719656 | 4734.05 | 709 | 685 | 151.9 |
| B | 10 | 254 | 715545 | 4706.98 | 709 | 685 | 151.9 |
| B | 10 | 28 | 504195 | 3315.35 | 709 | 685 | 151.9 |
| C | 15 | 224 | 3010726 | 17047.81 | 647 | 643 | 176.6 |
| C | 15 | 231 | 968923 | 5483.92 | 647 | 643 | 176.6 |
| C | 4 | 5 | 380385 | 2150.69 | 647 | 643 | 176.6 |
| D | 8 | 176 | 4427566 | 27008.29 | 578 | 554 | 163.9 |
| D | 2 | 153 | 552250 | 3365.78 | 578 | 554 | 163.9 |
| D | 10 | 172 | 136582 | 829.88 | 578 | 554 | 163.9 |
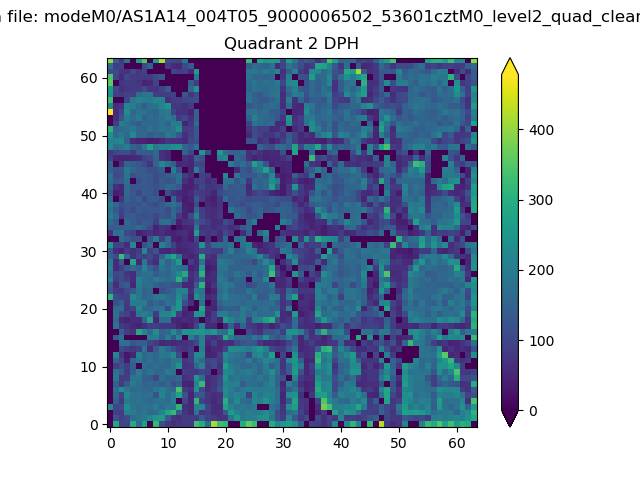
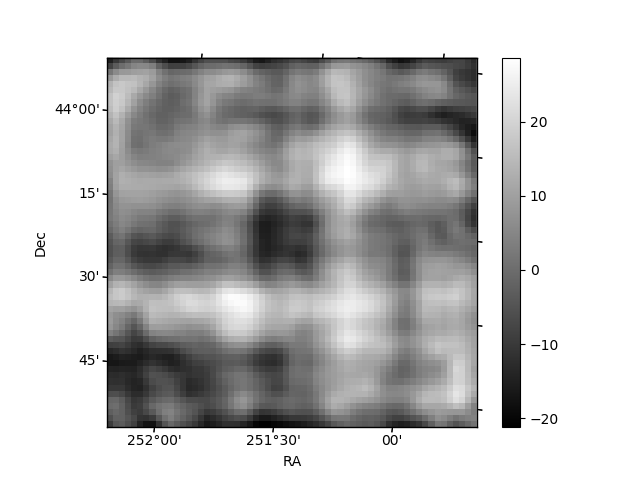
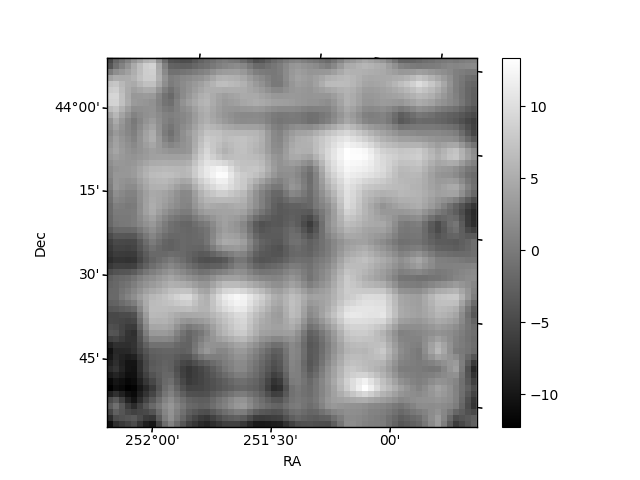
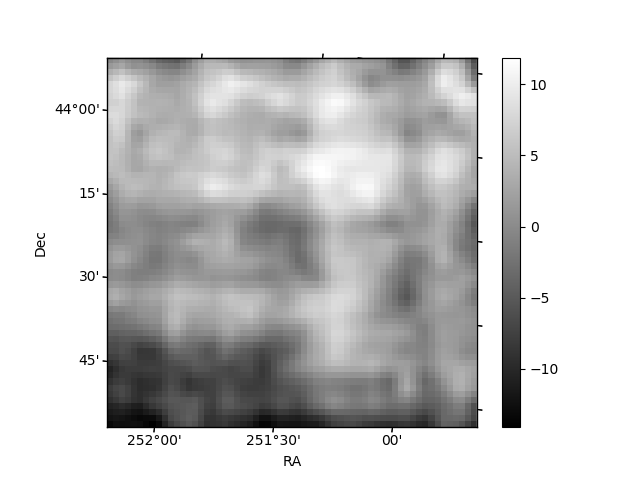
Histogram calculated using DETX and DETY for each event in the final _common_clean file
| Quadrant A | 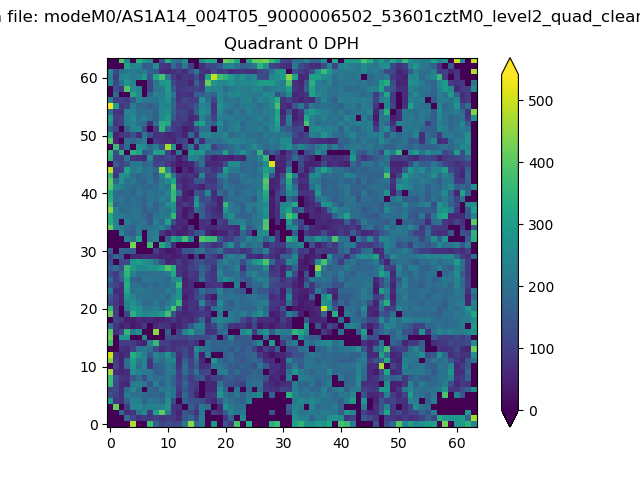 |
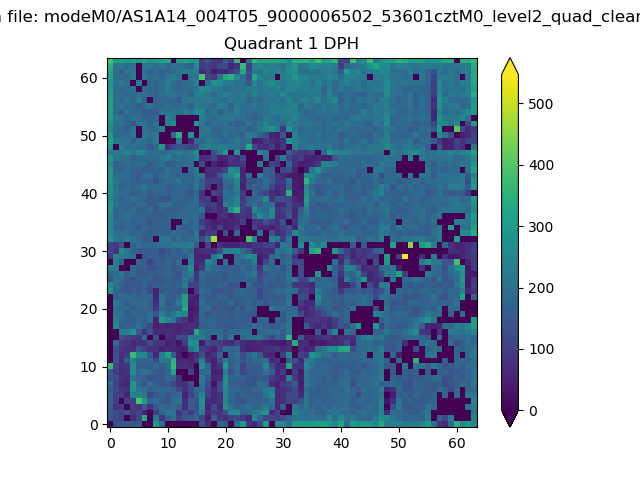 |
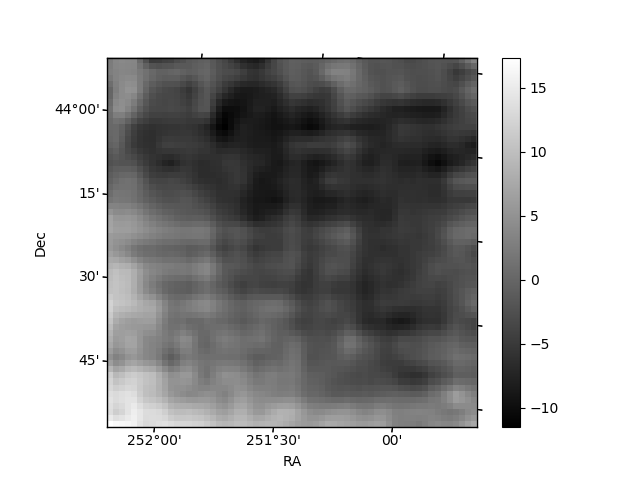
Quadrant B |
|---|---|---|---|
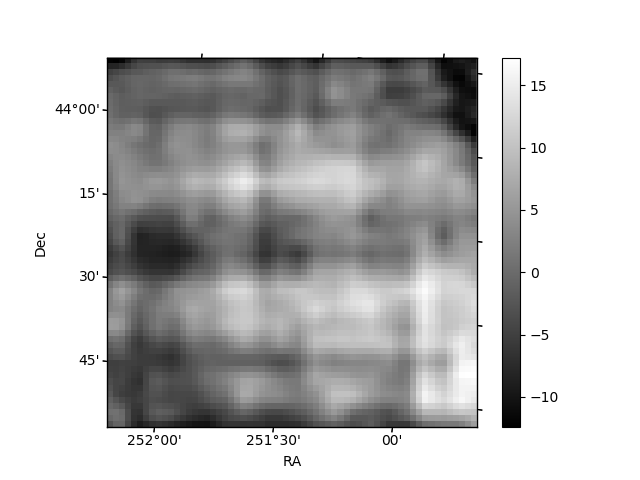
| Quadrant D | 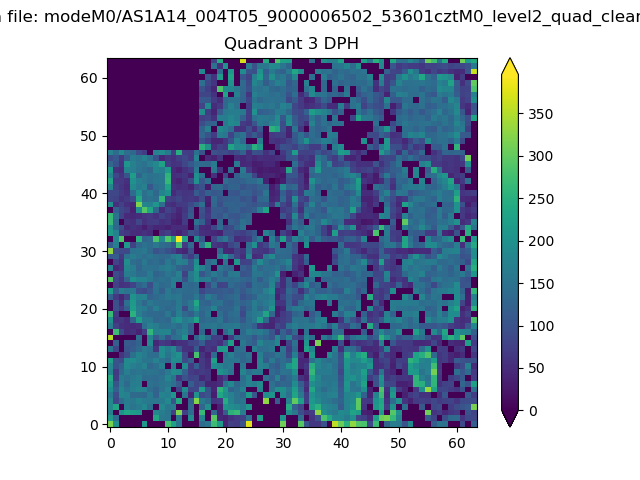 |
 |
Quadrant C |
| Plot type | Count rate plots | Images |
|---|---|---|
| Comparison with Poisson distribution Blue bars denote a histogram of data divided into 1 sec bins. Red curve is a Poisson curve with rate = median count rate of data. |
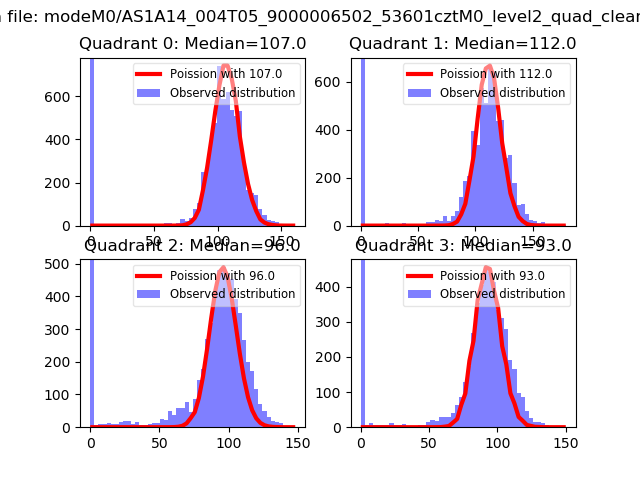 |
 |
| Quadrant-wise count rates Data is divided into 100 sec bins |
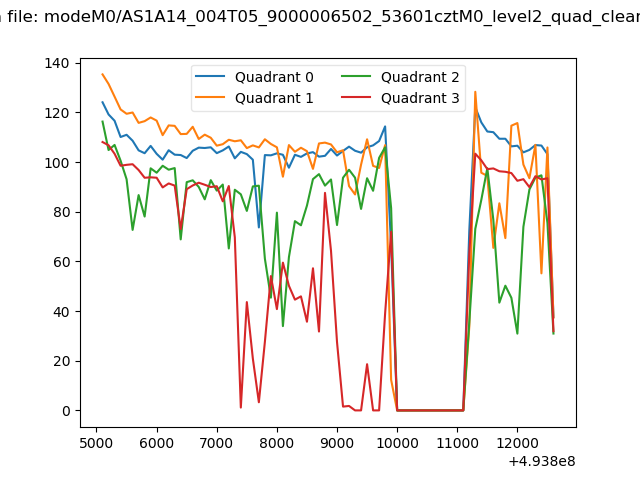 |
|
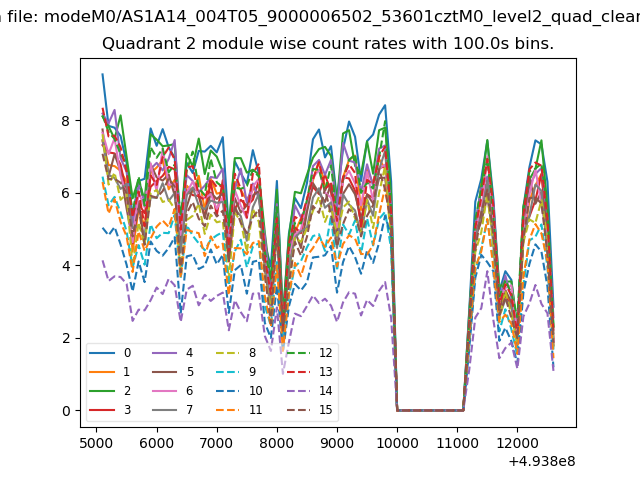
| Module-wise count rates for Quadrant A Data is divided into 100 sec bins |
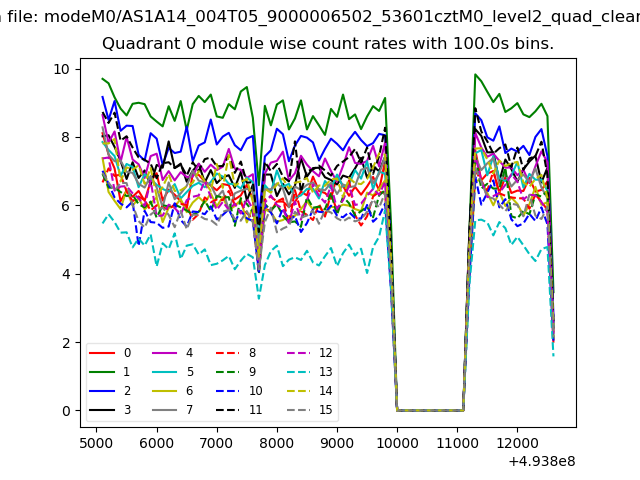 |
 |
| Module-wise count rates for Quadrant B Data is divided into 100 sec bins |
 |
 |
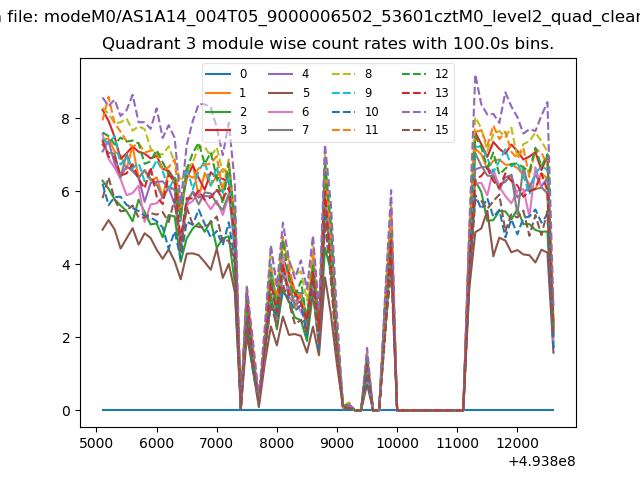
| Module-wise count rates for Quadrant C Data is divided into 100 sec bins |
 |
 |
| Module-wise count rates for Quadrant D Data is divided into 100 sec bins |
 |
 |
| Parameter | Plot |
|---|---|
| CZT HV Monitor | 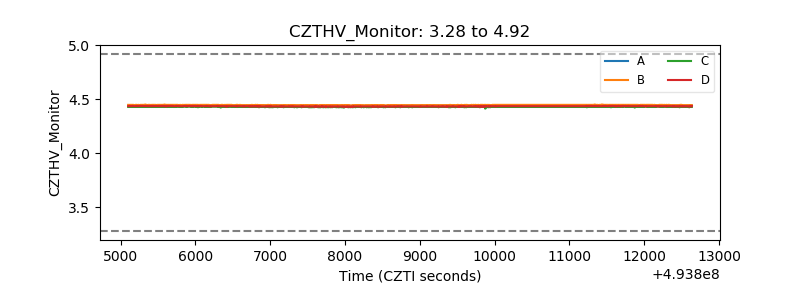 |
| D_VDD | 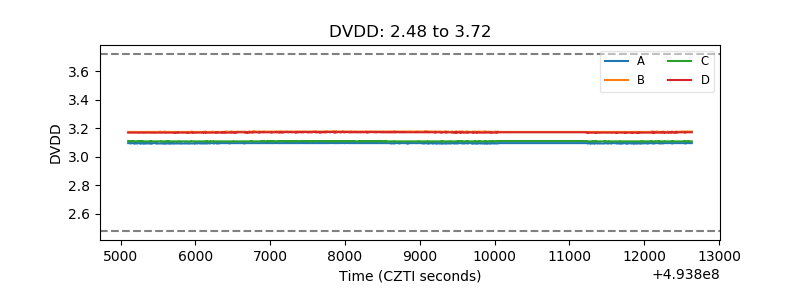 |
| Temperature 1 | 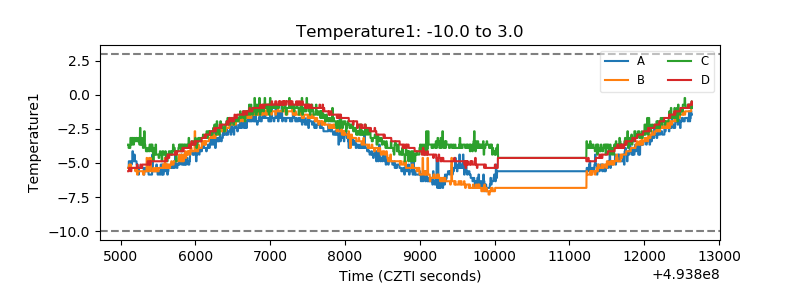 |
| Veto HV Monitor | 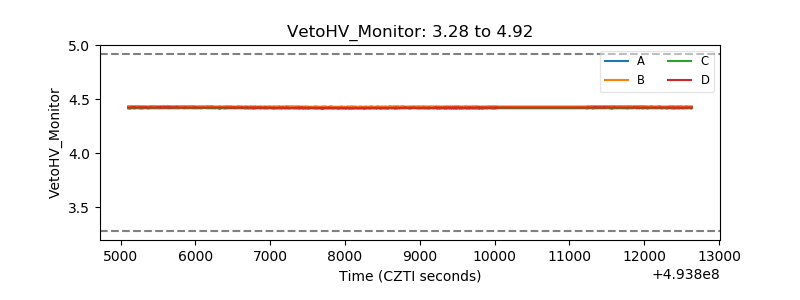 |
| Veto LLD | 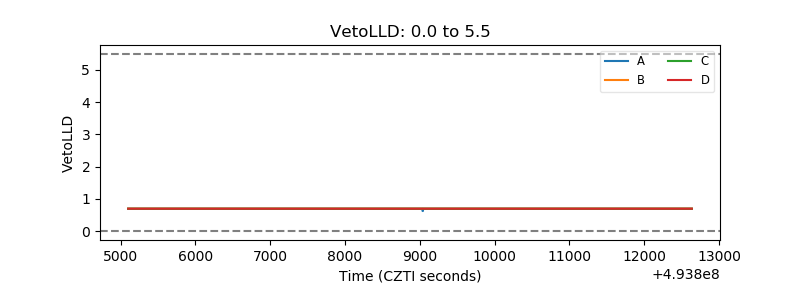 |
| Alpha Counter | 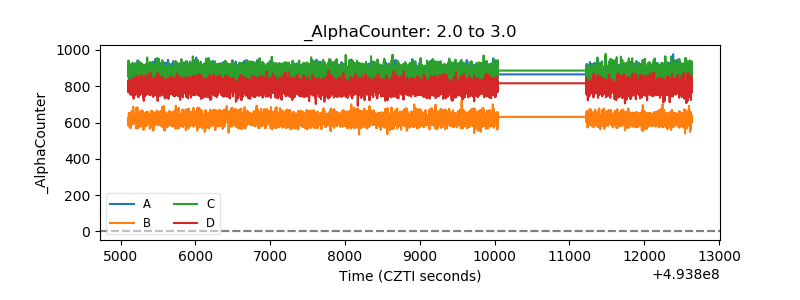 |
| _CPM_Rate | 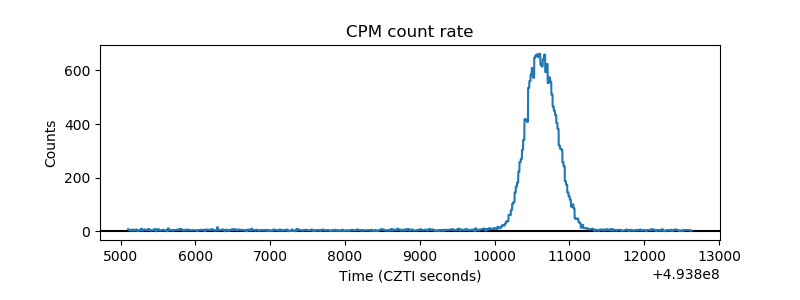 |
| CZT Counter | 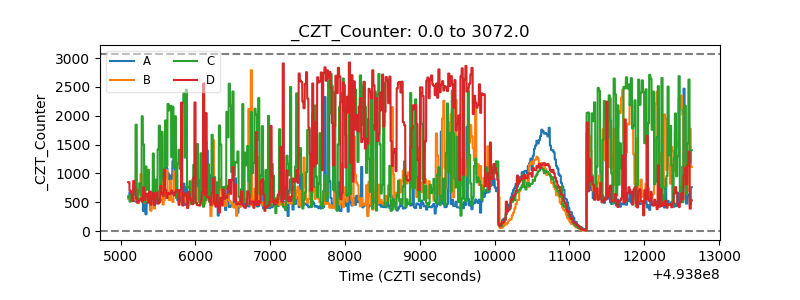 |
| +2.5 Volts monitor |  |
| +5 Volts monitor |  |
| _ROLL_ROT | 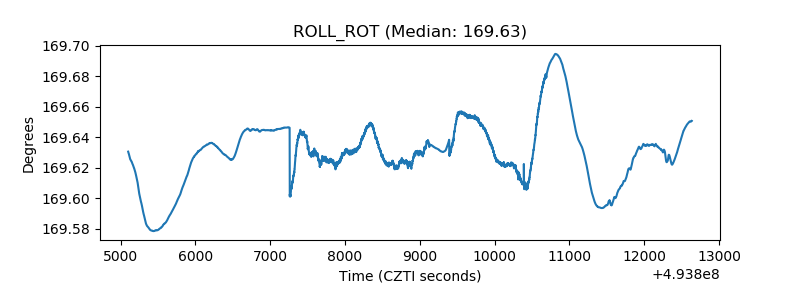 |
| _Roll_DEC | 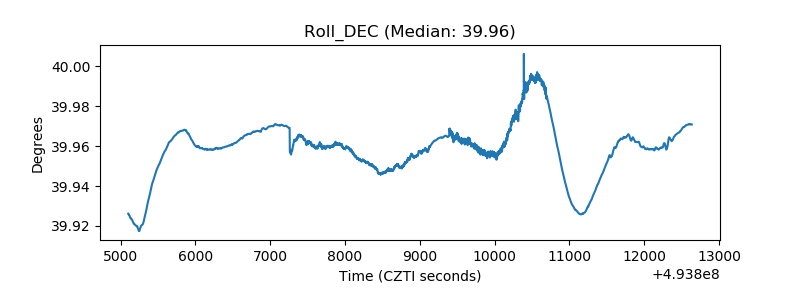 |
| _Roll_RA | 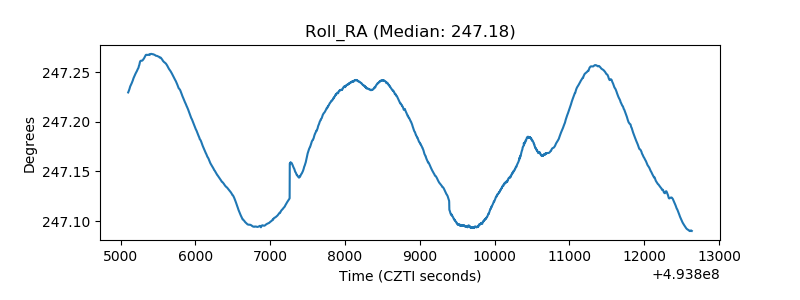 |
| Veto Counter | 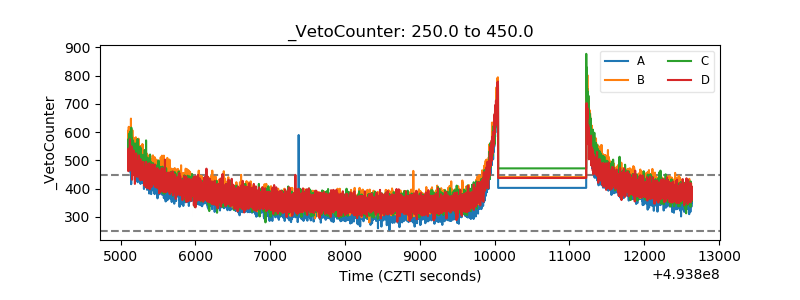 |