| Param | Original file | Final file |
|---|---|---|
| Filename | modeM0/AS1A14_004T05_9000006502_53602cztM0_level2.fits | modeM0/AS1A14_004T05_9000006502_53602cztM0_level2_quad_clean.evt |
| Size (bytes) | 713,099,520 | 81,083,520 |
| Size | 680.1 MB | 77.3 MB |
| Events in quadrant A | 3,913,649 | 593,203 |
| Events in quadrant B | 5,385,694 | 602,216 |
| Events in quadrant C | 8,252,352 | 451,726 |
| Events in quadrant D | 8,381,710 | 389,525 |
| Mode M9 | |||
|---|---|---|---|
| Quadrant | BADHDUFLAG | Total packets | Discarded packets |
| A | 0 | 11 | 0 |
| B | 0 | 11 | 0 |
| C | 0 | 11 | 0 |
| D | 0 | 11 | 0 |
| Mode SS | |||
|---|---|---|---|
| Quadrant | BADHDUFLAG | Total packets | Discarded packets |
| A | 0 | 122 | 0 |
| B | 0 | 122 | 0 |
| C | 0 | 122 | 0 |
| D | 0 | 122 | 0 |
| Mode M0 | |||
|---|---|---|---|
| Quadrant | BADHDUFLAG | Total packets | Discarded packets |
| A | 0 | 15595 | 1 |
| B | 0 | 20090 | 1 |
| C | 0 | 28664 | 1 |
| D | 0 | 28907 | 6 |
| Quadrant | Total seconds | Saturated seconds | Saturation percentage |
|---|---|---|---|
| A | 5984 | 388 | 6.483957% |
| B | 5984 | 683 | 11.413770% |
| C | 5984 | 1749 | 29.227941% |
| D | 5984 | 2017 | 33.706551% |
Noise dominated data is calculated using 1-second bins in cleaned event files. If a bin has >2000 counts, and if more than 50% of those come from <1% of pixels, then it is considered to be noise-dominated and hence unusable.
| Quadrant | # 1 sec bins | Bins with >0 counts | Bins with >2000 counts | High rate bins dominated by noise | Noise dominated (total time) | Noise dominated (detector-on time) | Marked lightcurve |
|---|---|---|---|---|---|---|---|
| A | 7082 | 5990 | 187 | 187 | 2.64% | 3.12% | 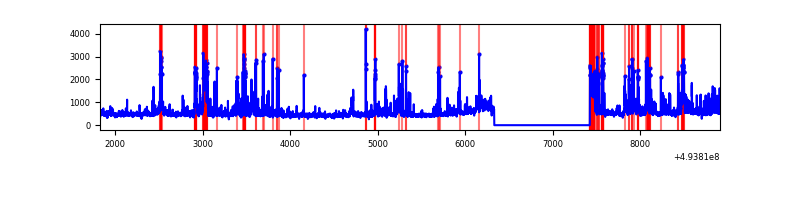 |
| B | 7082 | 5990 | 385 | 385 | 5.44% | 6.43% | 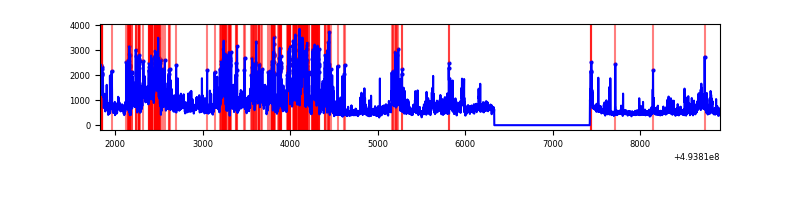 |
| C | 7081 | 5989 | 1413 | 1413 | 19.95% | 23.59% | 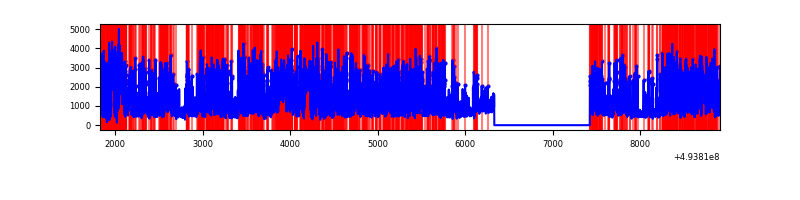 |
| D | 7081 | 5989 | 1855 | 1855 | 26.20% | 30.97% | 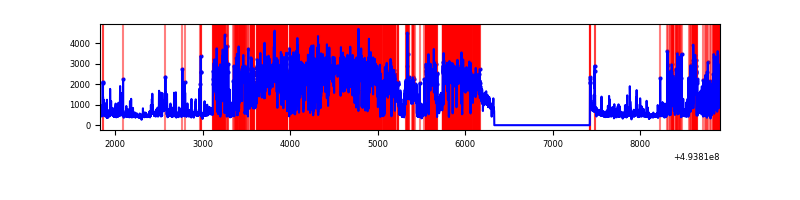 |
Top three noisy pixels from each quadrant. If the there are fewer than three noisy pixels in the level2.evt file, extra rows are filled as -1
| Pixel properties | Quadrant properties | ||||||
|---|---|---|---|---|---|---|---|
| Quadrant | DetID | PixID | Counts | Sigma | Mean | Median | Sigma |
| A | 3 | 63 | 346870 | 2085.25 | 674 | 657 | 166.0 |
| A | 15 | 174 | 238064 | 1429.91 | 674 | 657 | 166.0 |
| A | 12 | 115 | 224461 | 1347.98 | 674 | 657 | 166.0 |
| B | 4 | 206 | 955643 | 6926.09 | 650 | 628 | 137.9 |
| B | 10 | 28 | 805227 | 5835.22 | 650 | 628 | 137.9 |
| B | 5 | 172 | 333577 | 2414.66 | 650 | 628 | 137.9 |
| C | 15 | 224 | 3563693 | 22167.45 | 583 | 578 | 160.7 |
| C | 15 | 231 | 807149 | 5017.98 | 583 | 578 | 160.7 |
| C | 13 | 3 | 600771 | 3734.02 | 583 | 578 | 160.7 |
| D | 8 | 176 | 4565179 | 26537.19 | 594 | 565 | 172.0 |
| D | 3 | 12 | 342134 | 1985.77 | 594 | 565 | 172.0 |
| D | 2 | 62 | 287945 | 1670.73 | 594 | 565 | 172.0 |
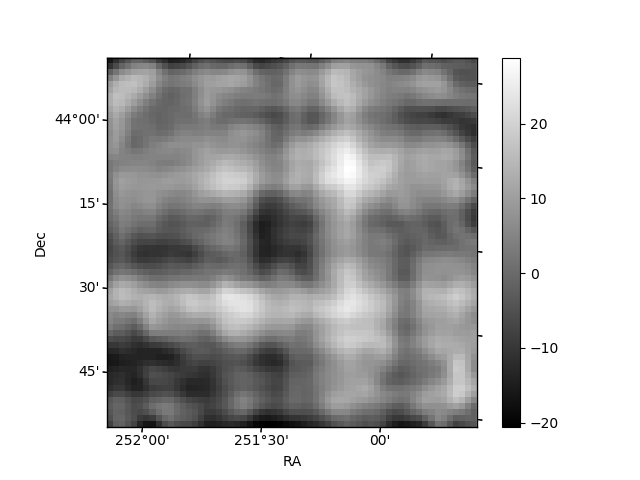
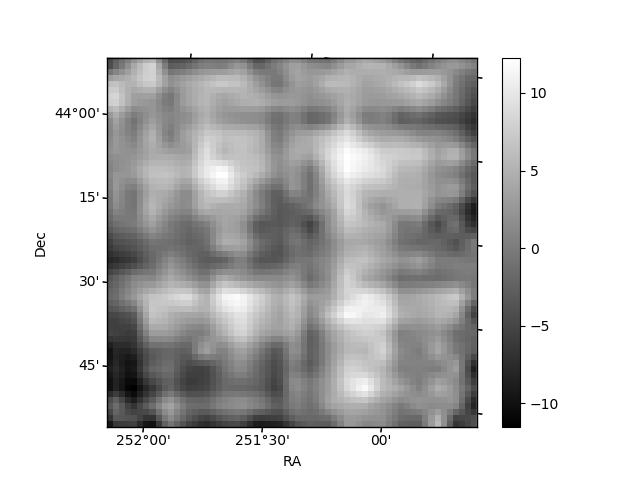
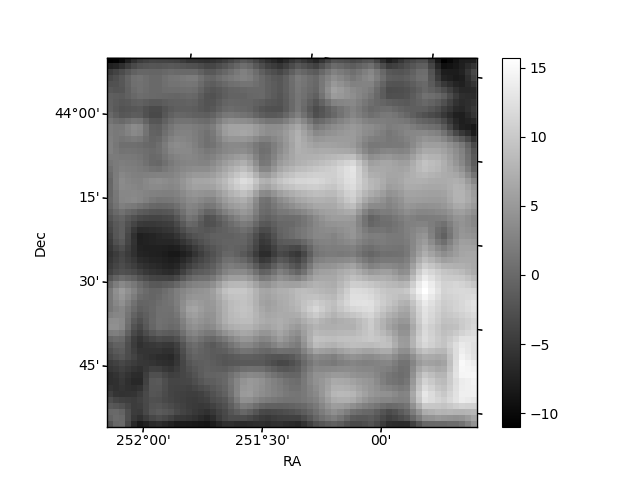
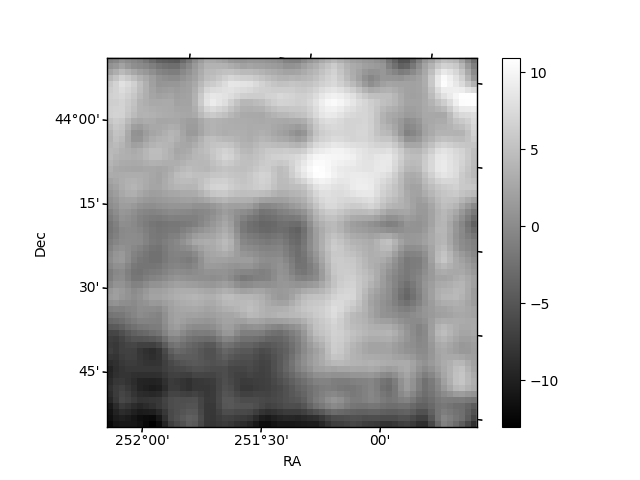
Histogram calculated using DETX and DETY for each event in the final _common_clean file
| Quadrant A | 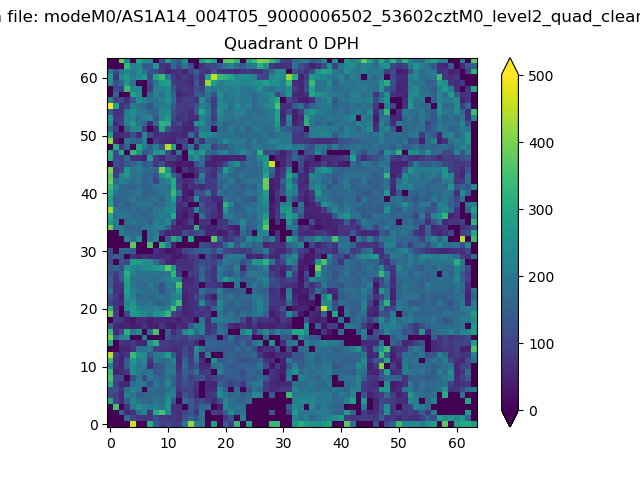 |
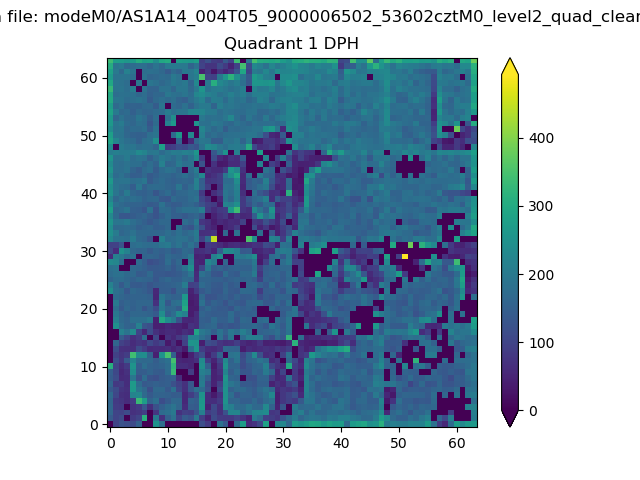 |
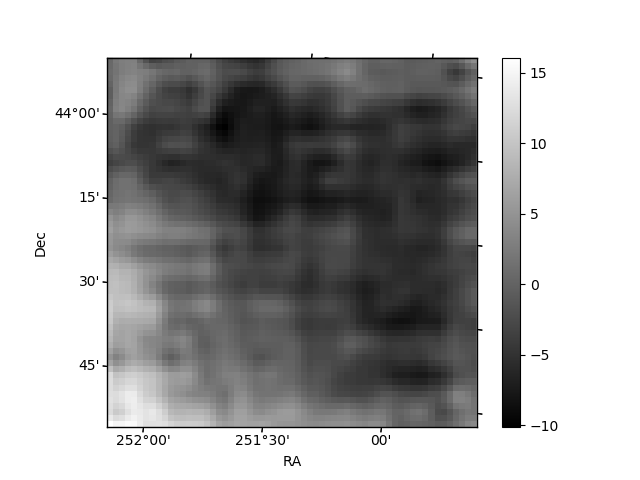
Quadrant B |
|---|---|---|---|
| Quadrant D | 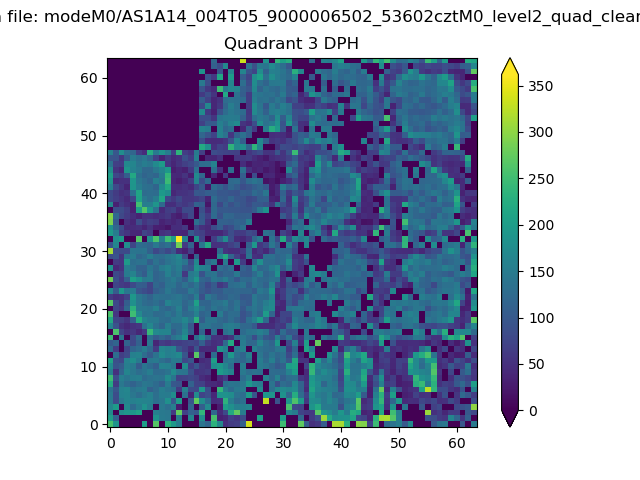 |
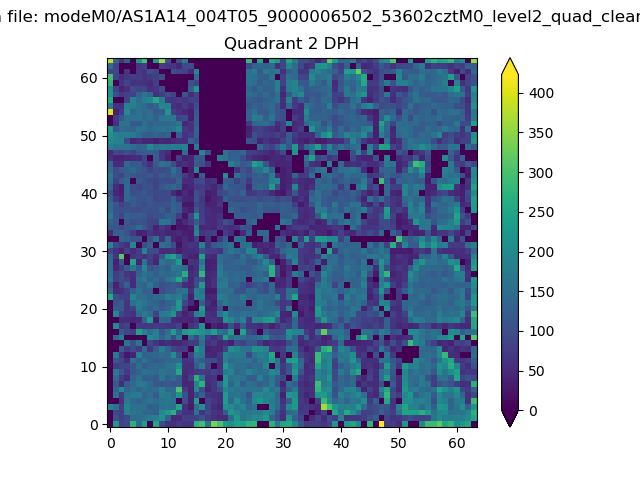 |
Quadrant C |
| Plot type | Count rate plots | Images |
|---|---|---|
| Comparison with Poisson distribution Blue bars denote a histogram of data divided into 1 sec bins. Red curve is a Poisson curve with rate = median count rate of data. |
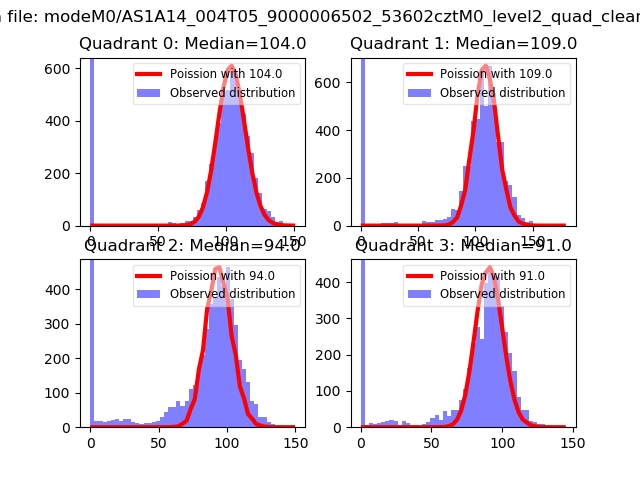 |
 |
| Quadrant-wise count rates Data is divided into 100 sec bins |
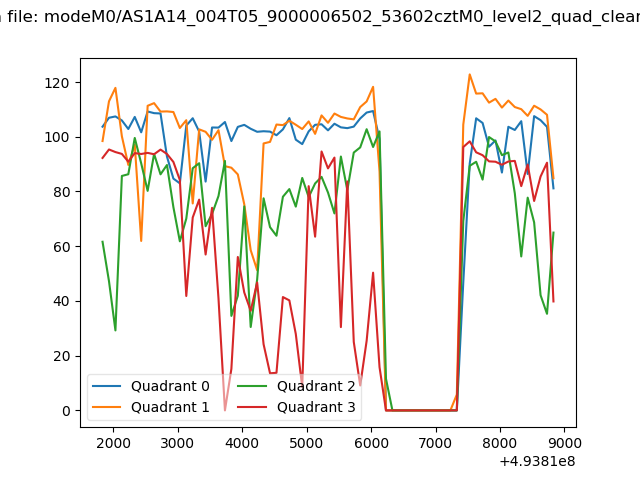 |
|
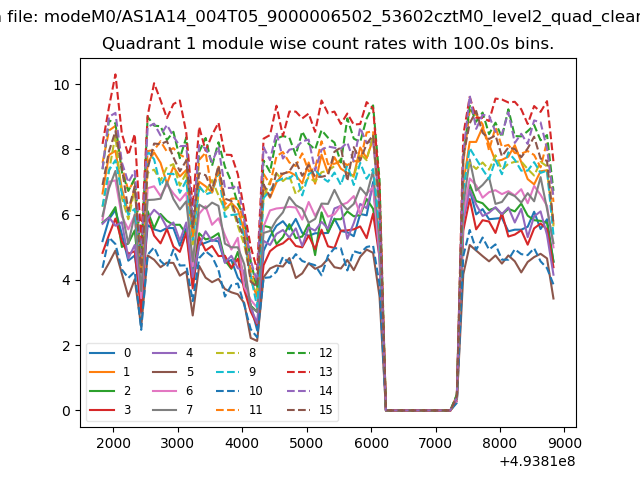
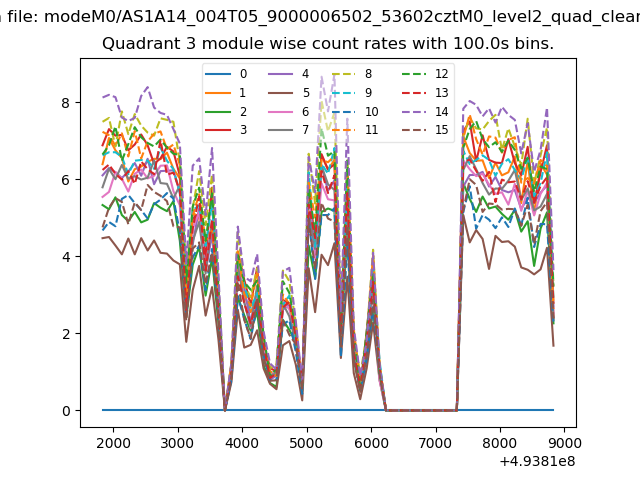
| Module-wise count rates for Quadrant A Data is divided into 100 sec bins |
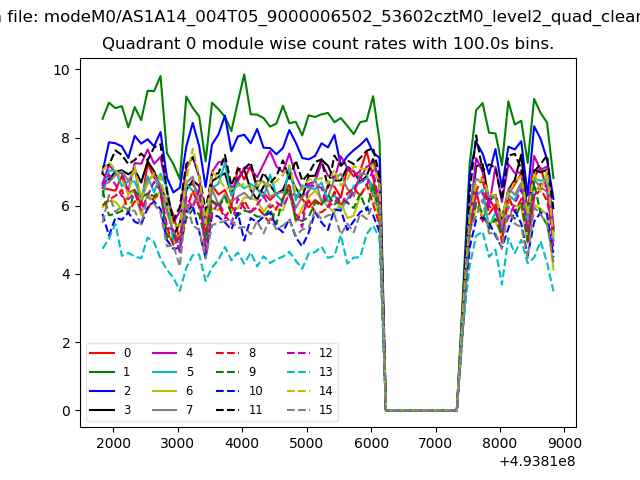 |
 |
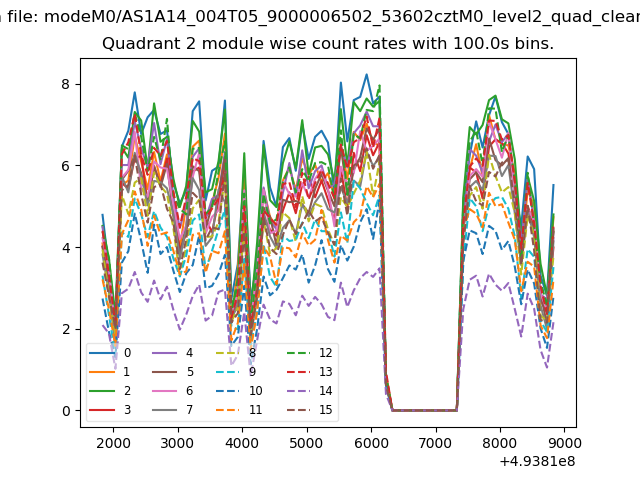
| Module-wise count rates for Quadrant B Data is divided into 100 sec bins |
 |
 |
| Module-wise count rates for Quadrant C Data is divided into 100 sec bins |
 |
 |
| Module-wise count rates for Quadrant D Data is divided into 100 sec bins |
 |
 |
| Parameter | Plot |
|---|---|
| CZT HV Monitor | 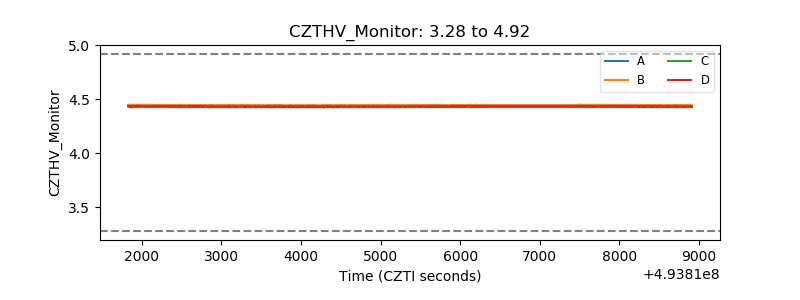 |
| D_VDD | 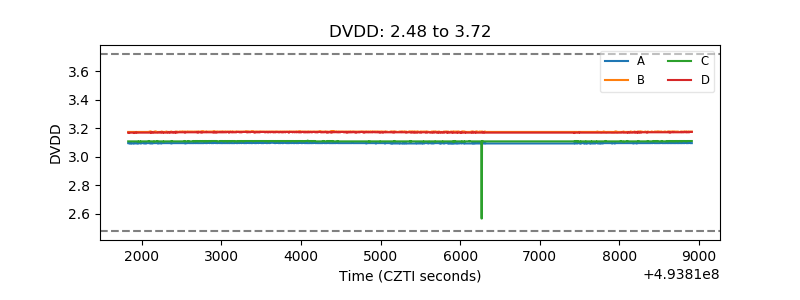 |
| Temperature 1 | 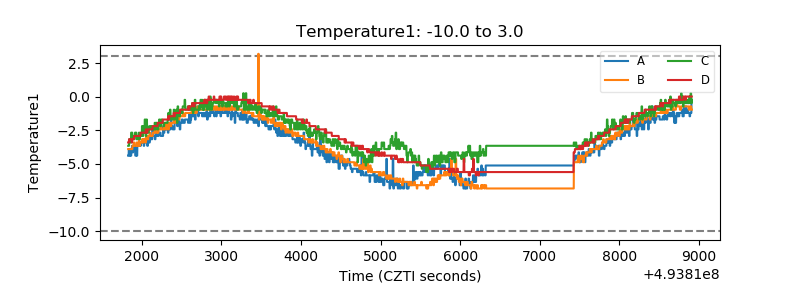 |
| Veto HV Monitor | 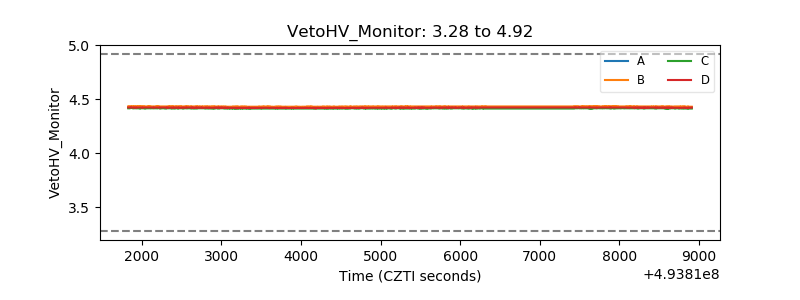 |
| Veto LLD | 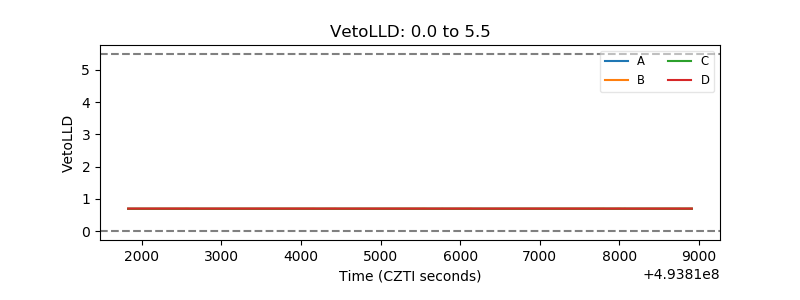 |
| Alpha Counter | 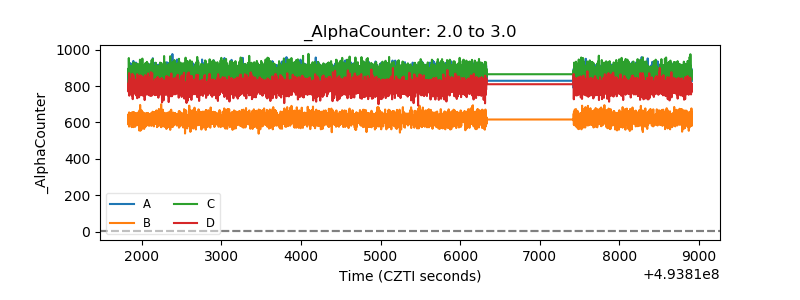 |
| _CPM_Rate | 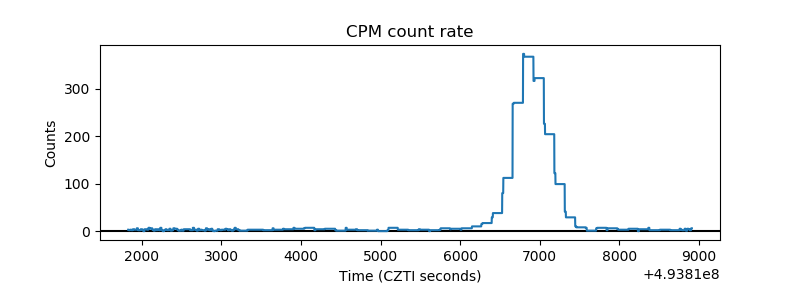 |
| CZT Counter | 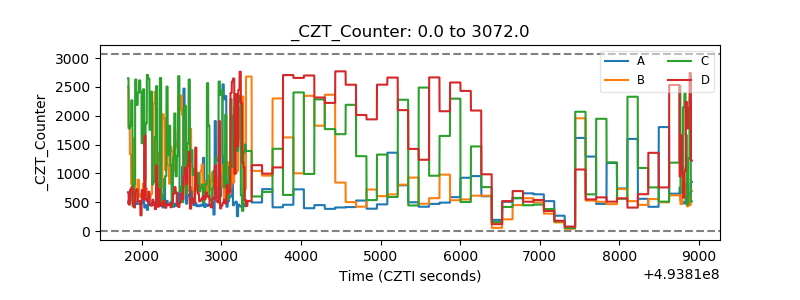 |
| +2.5 Volts monitor |  |
| +5 Volts monitor |  |
| _ROLL_ROT | 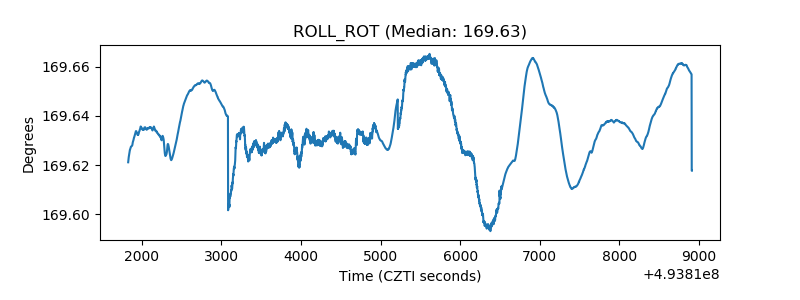 |
| _Roll_DEC | 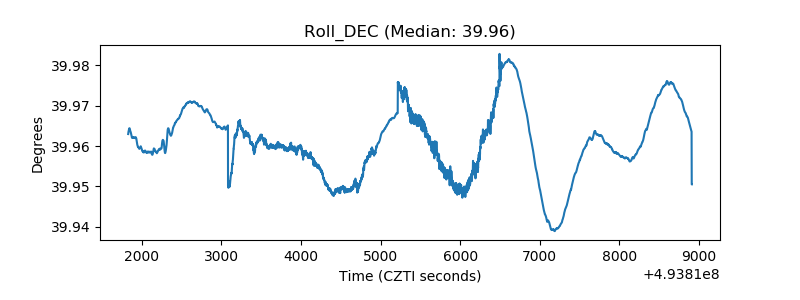 |
| _Roll_RA | 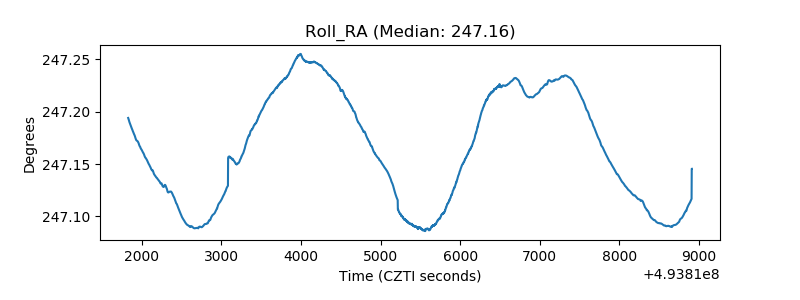 |
| Veto Counter | 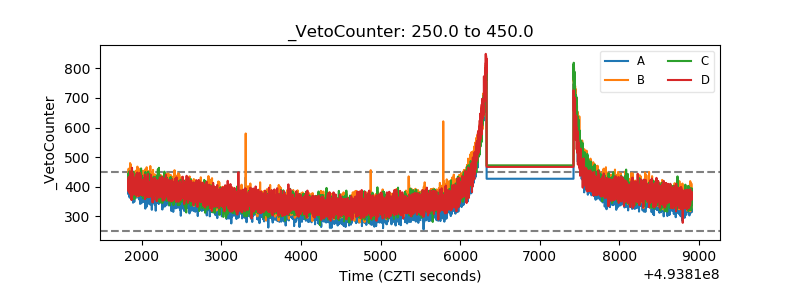 |