| Param | Original file | Final file |
|---|---|---|
| Filename | modeM0/AS1A14_004T05_9000006502_53603cztM0_level2.fits | modeM0/AS1A14_004T05_9000006502_53603cztM0_level2_quad_clean.evt |
| Size (bytes) | 810,164,160 | 81,244,800 |
| Size | 772.6 MB | 77.5 MB |
| Events in quadrant A | 5,998,642 | 553,344 |
| Events in quadrant B | 4,388,955 | 653,942 |
| Events in quadrant C | 9,240,765 | 436,470 |
| Events in quadrant D | 9,865,833 | 369,751 |
| Mode M9 | |||
|---|---|---|---|
| Quadrant | BADHDUFLAG | Total packets | Discarded packets |
| A | 0 | 10 | 0 |
| B | 0 | 10 | 0 |
| C | 0 | 10 | 0 |
| D | 0 | 10 | 0 |
| Mode SS | |||
|---|---|---|---|
| Quadrant | BADHDUFLAG | Total packets | Discarded packets |
| A | 0 | 128 | 0 |
| B | 0 | 128 | 0 |
| C | 0 | 128 | 0 |
| D | 0 | 128 | 0 |
| Mode M0 | |||
|---|---|---|---|
| Quadrant | BADHDUFLAG | Total packets | Discarded packets |
| A | 0 | 22038 | 1 |
| B | 0 | 17288 | 1 |
| C | 0 | 31886 | 1 |
| D | 0 | 33671 | 1 |
| Quadrant | Total seconds | Saturated seconds | Saturation percentage |
|---|---|---|---|
| A | 6399 | 1078 | 16.846382% |
| B | 6400 | 352 | 5.500000% |
| C | 6400 | 2154 | 33.656250% |
| D | 6400 | 2579 | 40.296875% |
Noise dominated data is calculated using 1-second bins in cleaned event files. If a bin has >2000 counts, and if more than 50% of those come from <1% of pixels, then it is considered to be noise-dominated and hence unusable.
| Quadrant | # 1 sec bins | Bins with >0 counts | Bins with >2000 counts | High rate bins dominated by noise | Noise dominated (total time) | Noise dominated (detector-on time) | Marked lightcurve |
|---|---|---|---|---|---|---|---|
| A | 7319 | 6399 | 822 | 822 | 11.23% | 12.85% | 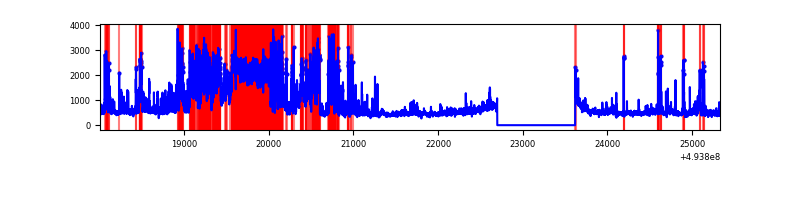 |
| B | 7320 | 6400 | 144 | 144 | 1.97% | 2.25% | 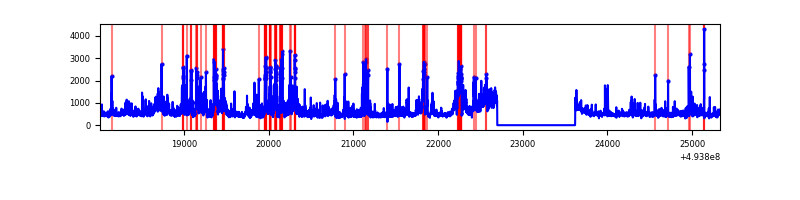 |
| C | 7320 | 6401 | 1831 | 1831 | 25.01% | 28.60% | 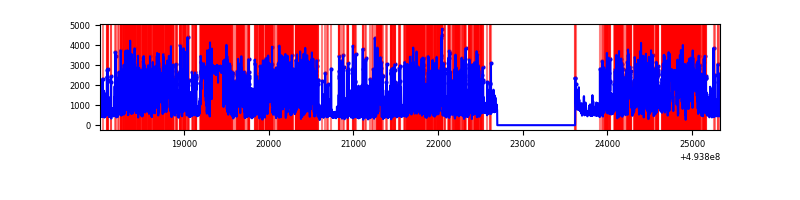 |
| D | 7319 | 6399 | 2260 | 2260 | 30.88% | 35.32% | 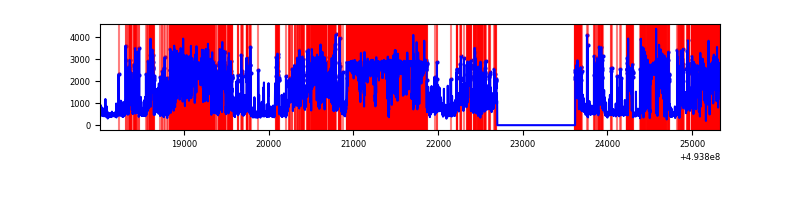 |
Top three noisy pixels from each quadrant. If the there are fewer than three noisy pixels in the level2.evt file, extra rows are filled as -1
| Pixel properties | Quadrant properties | ||||||
|---|---|---|---|---|---|---|---|
| Quadrant | DetID | PixID | Counts | Sigma | Mean | Median | Sigma |
| A | 3 | 63 | 2815025 | 17319.28 | 659 | 641 | 162.5 |
| A | 15 | 174 | 205761 | 1262.28 | 659 | 641 | 162.5 |
| A | 12 | 115 | 102281 | 625.48 | 659 | 641 | 162.5 |
| B | 10 | 28 | 464488 | 3159.2 | 690 | 664 | 146.8 |
| B | 10 | 254 | 438368 | 2981.29 | 690 | 664 | 146.8 |
| B | 5 | 172 | 168198 | 1141.11 | 690 | 664 | 146.8 |
| C | 15 | 224 | 4106208 | 25576.71 | 584 | 579 | 160.5 |
| C | 15 | 231 | 874736 | 5445.71 | 584 | 579 | 160.5 |
| C | 13 | 3 | 638508 | 3974.09 | 584 | 579 | 160.5 |
| D | 8 | 176 | 6277311 | 39712.09 | 544 | 519 | 158.1 |
| D | 2 | 62 | 380670 | 2405.14 | 544 | 519 | 158.1 |
| D | 7 | 70 | 276775 | 1747.82 | 544 | 519 | 158.1 |
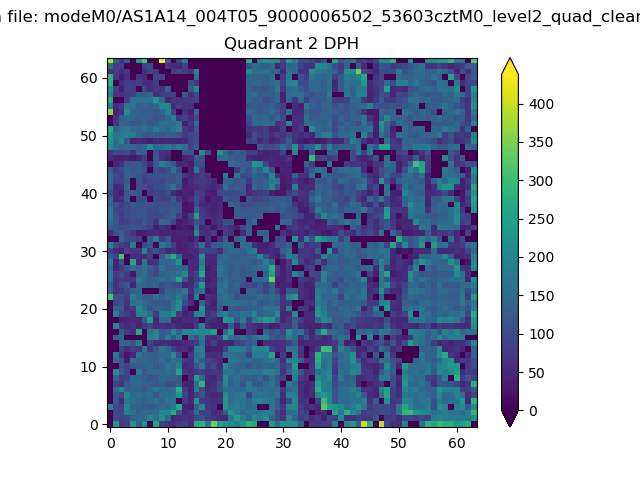
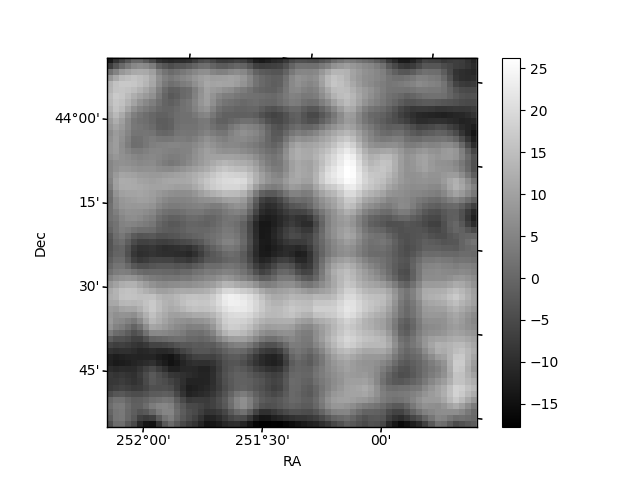
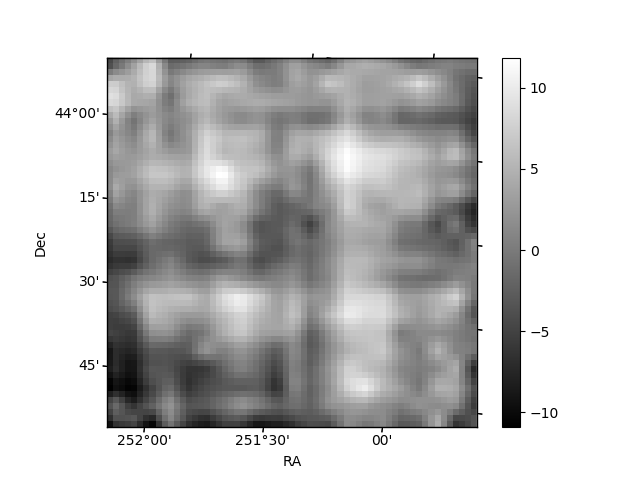
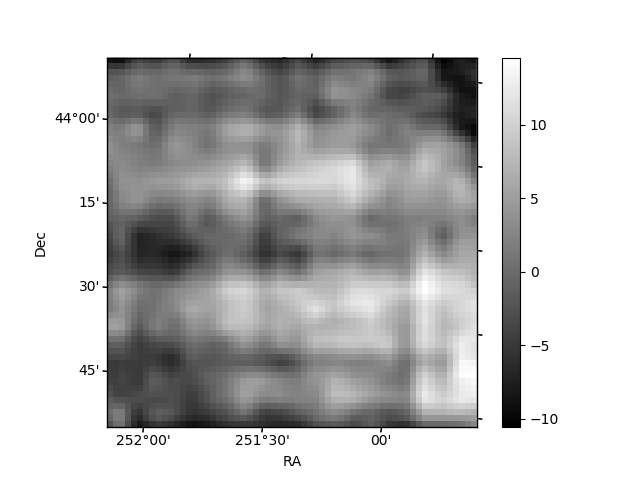
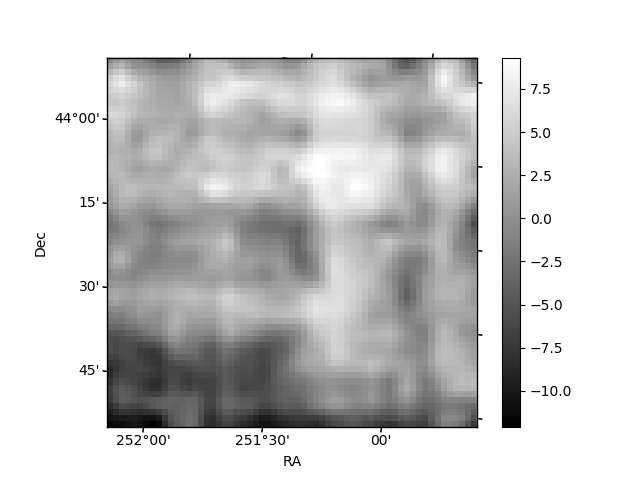
Histogram calculated using DETX and DETY for each event in the final _common_clean file
| Quadrant A | 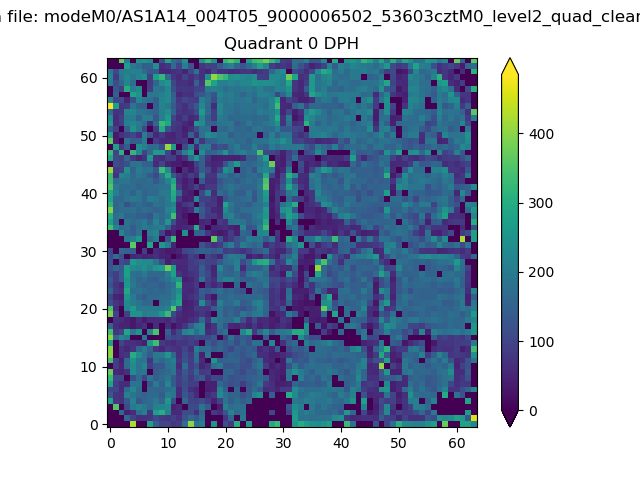 |
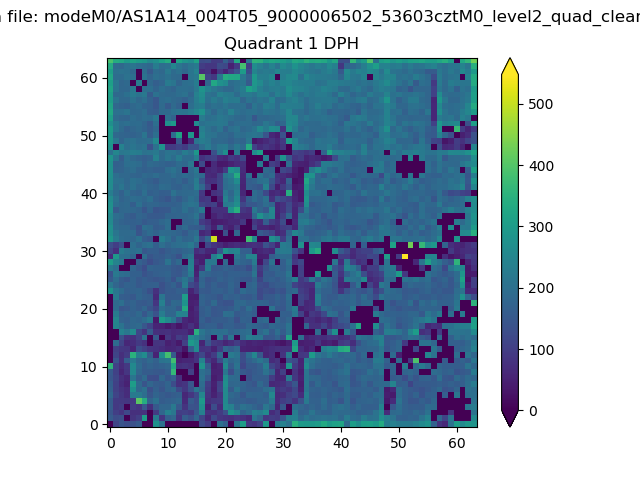 |
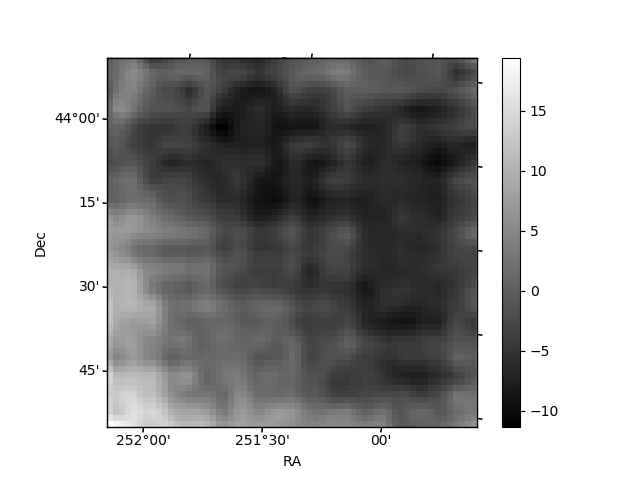
Quadrant B |
|---|---|---|---|
| Quadrant D | 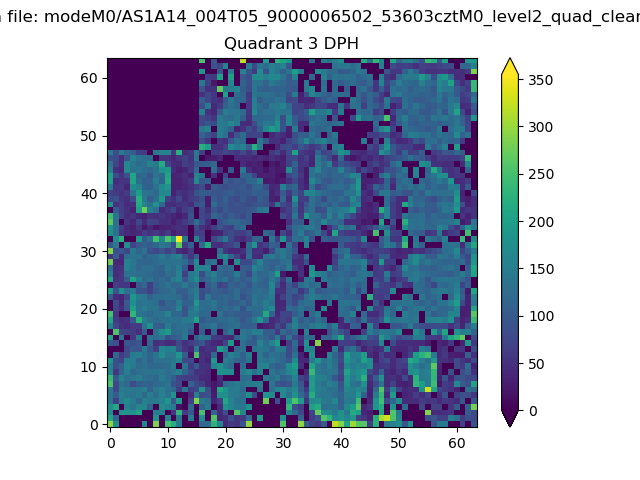 |
 |
Quadrant C |
| Plot type | Count rate plots | Images |
|---|---|---|
| Comparison with Poisson distribution Blue bars denote a histogram of data divided into 1 sec bins. Red curve is a Poisson curve with rate = median count rate of data. |
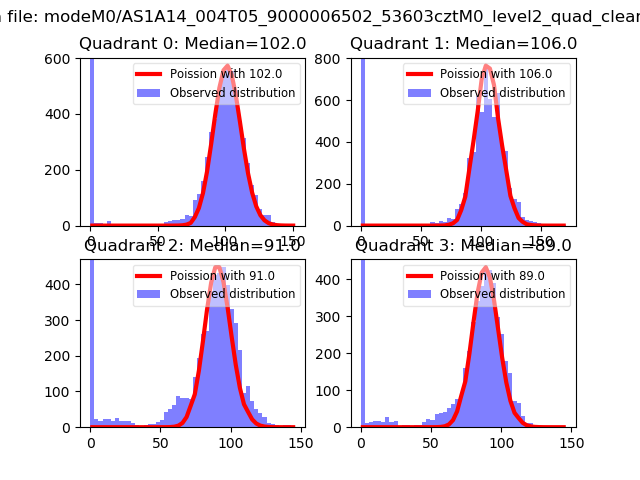 |
 |
| Quadrant-wise count rates Data is divided into 100 sec bins |
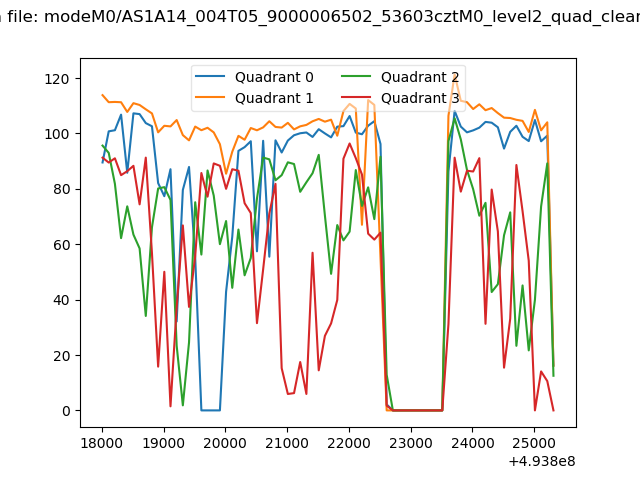 |
|
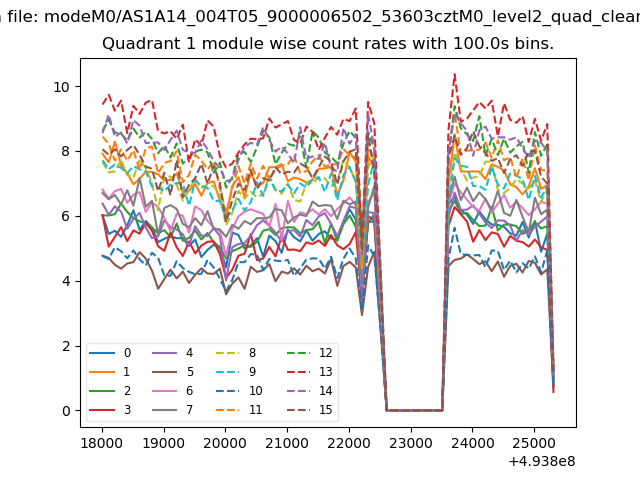
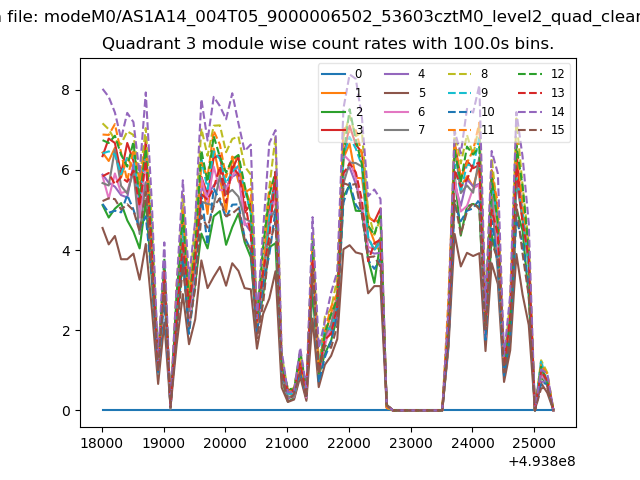
| Module-wise count rates for Quadrant A Data is divided into 100 sec bins |
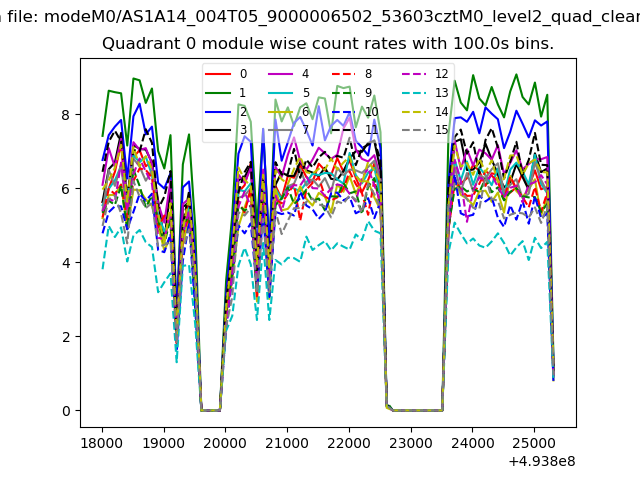 |
 |
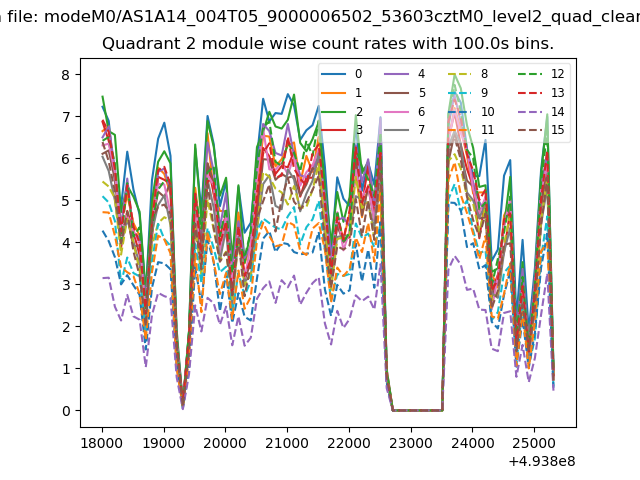
| Module-wise count rates for Quadrant B Data is divided into 100 sec bins |
 |
 |
| Module-wise count rates for Quadrant C Data is divided into 100 sec bins |
 |
 |
| Module-wise count rates for Quadrant D Data is divided into 100 sec bins |
 |
 |
| Parameter | Plot |
|---|---|
| CZT HV Monitor | 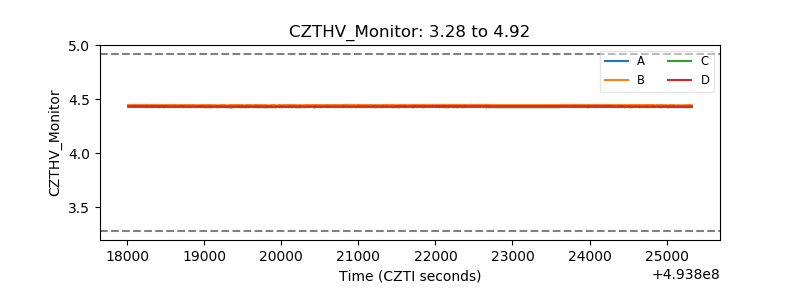 |
| D_VDD | 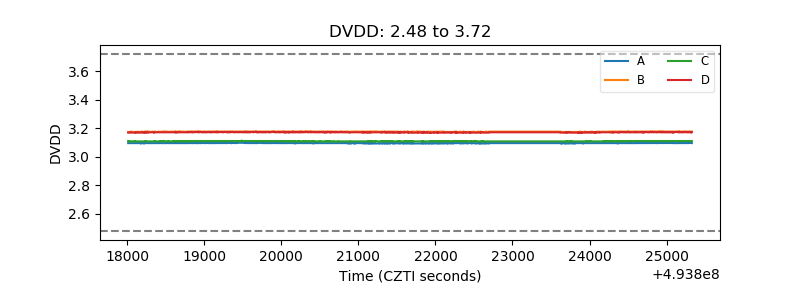 |
| Temperature 1 | 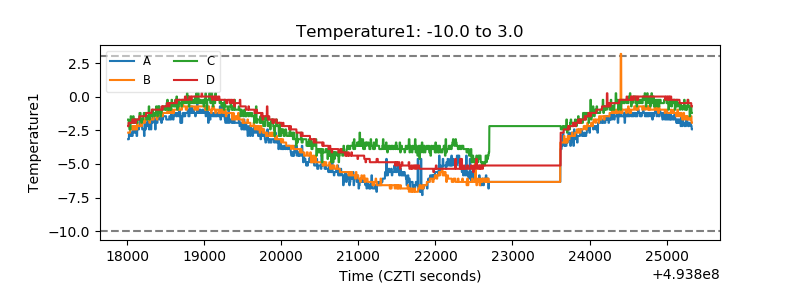 |
| Veto HV Monitor | 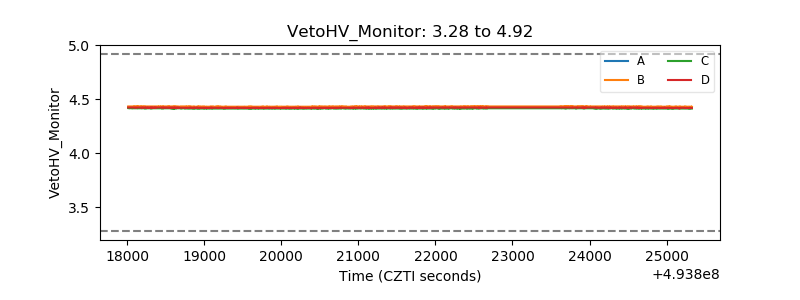 |
| Veto LLD | 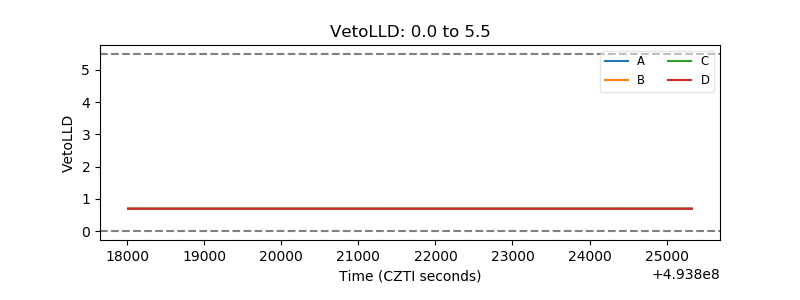 |
| Alpha Counter | 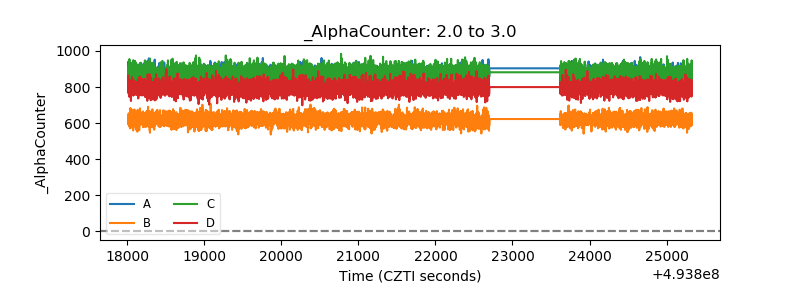 |
| _CPM_Rate | 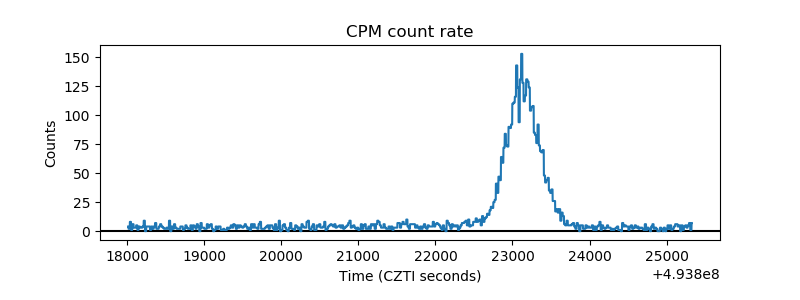 |
| CZT Counter | 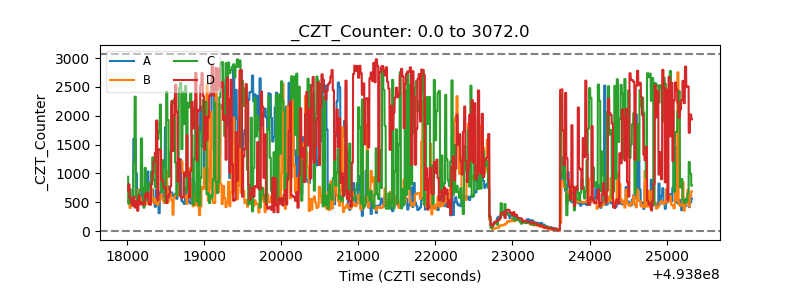 |
| +2.5 Volts monitor |  |
| +5 Volts monitor | 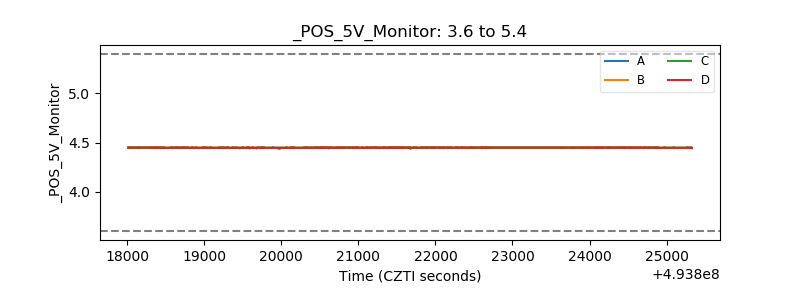 |
| _ROLL_ROT | 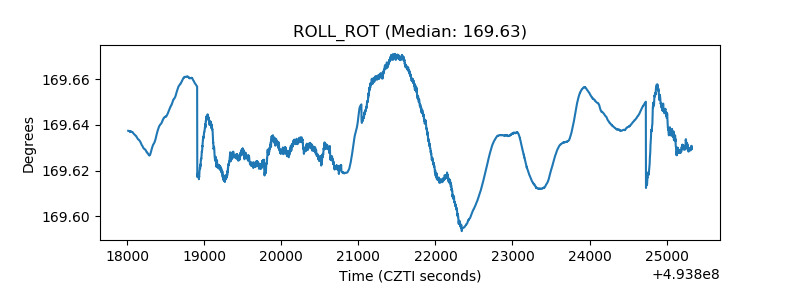 |
| _Roll_DEC | 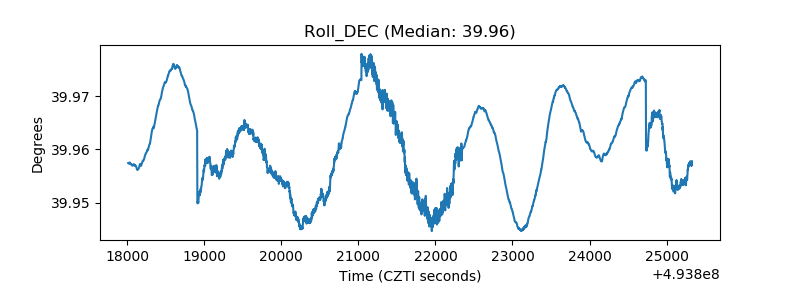 |
| _Roll_RA | 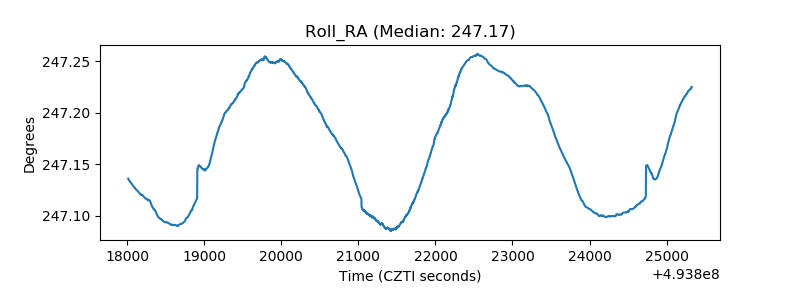 |
| Veto Counter | 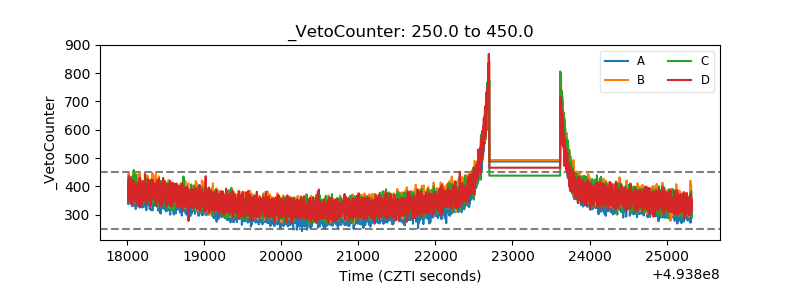 |