| Param | Original file | Final file |
|---|---|---|
| Filename | modeM0/AS1A14_004T05_9000006502_53605cztM0_level2.fits | modeM0/AS1A14_004T05_9000006502_53605cztM0_level2_quad_clean.evt |
| Size (bytes) | 899,792,640 | 94,769,280 |
| Size | 858.1 MB | 90.4 MB |
| Events in quadrant A | 4,994,454 | 723,002 |
| Events in quadrant B | 5,296,641 | 759,718 |
| Events in quadrant C | 10,656,573 | 491,842 |
| Events in quadrant D | 11,780,142 | 373,278 |
| Mode SS | |||
|---|---|---|---|
| Quadrant | BADHDUFLAG | Total packets | Discarded packets |
| A | 0 | 150 | 0 |
| B | 0 | 150 | 0 |
| C | 0 | 150 | 0 |
| D | 0 | 150 | 0 |
| Mode M0 | |||
|---|---|---|---|
| Quadrant | BADHDUFLAG | Total packets | Discarded packets |
| A | 0 | 20094 | 0 |
| B | 0 | 20820 | 0 |
| C | 0 | 36849 | 0 |
| D | 0 | 40100 | 0 |
| Quadrant | Total seconds | Saturated seconds | Saturation percentage |
|---|---|---|---|
| A | 7489 | 235 | 3.137936% |
| B | 7490 | 313 | 4.178905% |
| C | 7490 | 2555 | 34.112150% |
| D | 7490 | 3539 | 47.249666% |
Noise dominated data is calculated using 1-second bins in cleaned event files. If a bin has >2000 counts, and if more than 50% of those come from <1% of pixels, then it is considered to be noise-dominated and hence unusable.
| Quadrant | # 1 sec bins | Bins with >0 counts | Bins with >2000 counts | High rate bins dominated by noise | Noise dominated (total time) | Noise dominated (detector-on time) | Marked lightcurve |
|---|---|---|---|---|---|---|---|
| A | 7494 | 7494 | 191 | 191 | 2.55% | 2.55% | 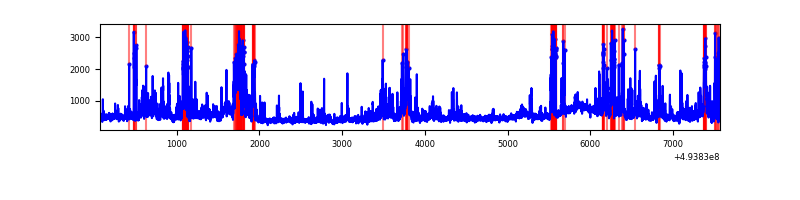 |
| B | 7495 | 7495 | 242 | 242 | 3.23% | 3.23% | 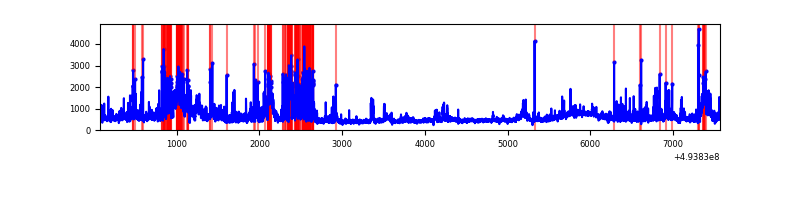 |
| C | 7494 | 7494 | 2155 | 2155 | 28.76% | 28.76% | 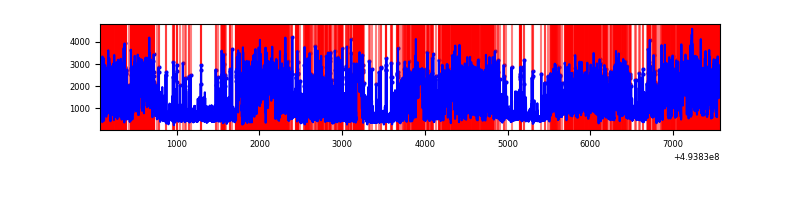 |
| D | 7495 | 7493 | 2987 | 2987 | 39.85% | 39.86% | 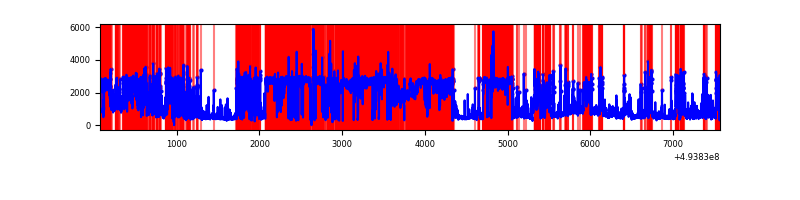 |
Top three noisy pixels from each quadrant. If the there are fewer than three noisy pixels in the level2.evt file, extra rows are filled as -1
| Pixel properties | Quadrant properties | ||||||
|---|---|---|---|---|---|---|---|
| Quadrant | DetID | PixID | Counts | Sigma | Mean | Median | Sigma |
| A | 15 | 174 | 648466 | 3169.76 | 827 | 804 | 204.3 |
| A | 3 | 63 | 356242 | 1739.57 | 827 | 804 | 204.3 |
| A | 12 | 17 | 244297 | 1191.69 | 827 | 804 | 204.3 |
| B | 10 | 28 | 1191140 | 6802.1 | 815 | 786 | 175.0 |
| B | 5 | 172 | 219078 | 1247.39 | 815 | 786 | 175.0 |
| B | 0 | 213 | 184700 | 1050.95 | 815 | 786 | 175.0 |
| C | 15 | 224 | 6102916 | 31852.9 | 688 | 679 | 191.6 |
| C | 13 | 3 | 505935 | 2637.37 | 688 | 679 | 191.6 |
| C | 12 | 254 | 369066 | 1922.93 | 688 | 679 | 191.6 |
| D | 8 | 176 | 8751035 | 54412.98 | 563 | 538 | 160.8 |
| D | 3 | 12 | 236423 | 1466.8 | 563 | 538 | 160.8 |
| D | 2 | 153 | 125874 | 779.37 | 563 | 538 | 160.8 |
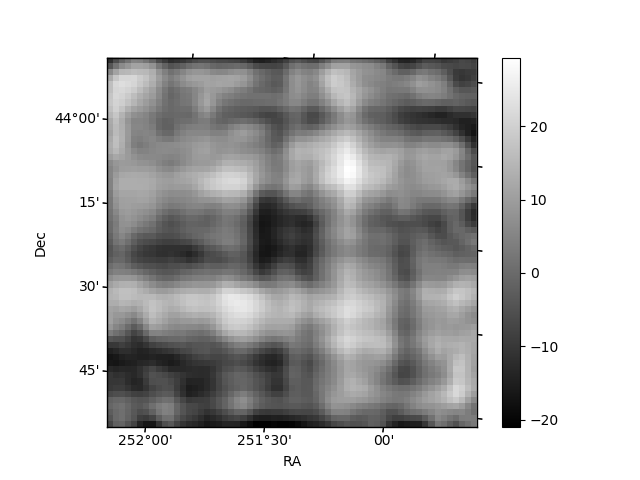
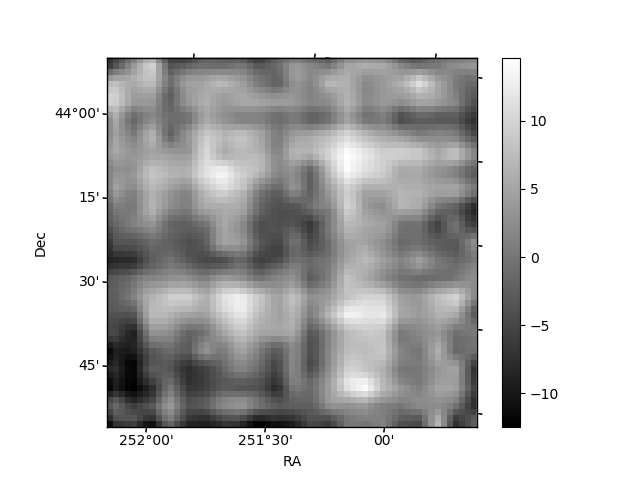
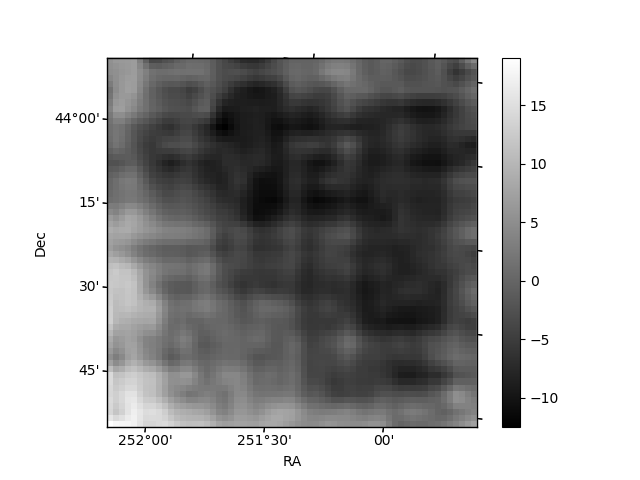
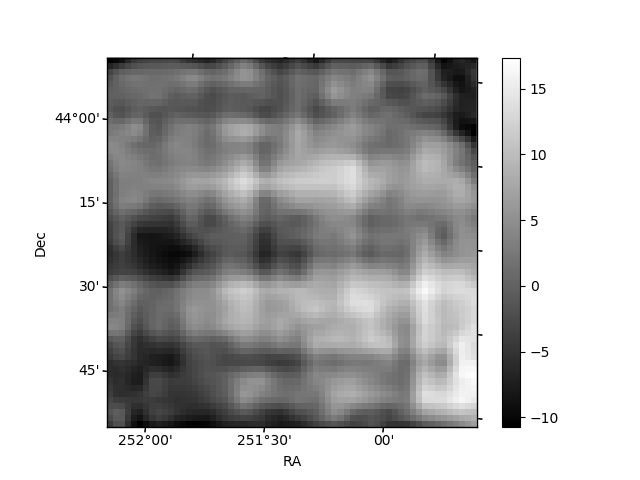
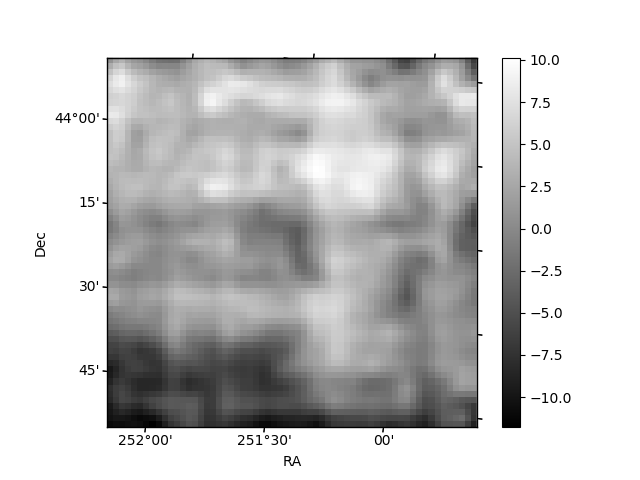
Histogram calculated using DETX and DETY for each event in the final _common_clean file
| Quadrant A | 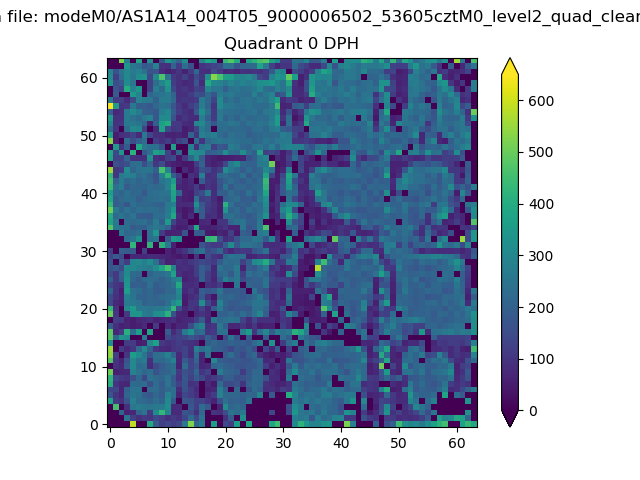 |
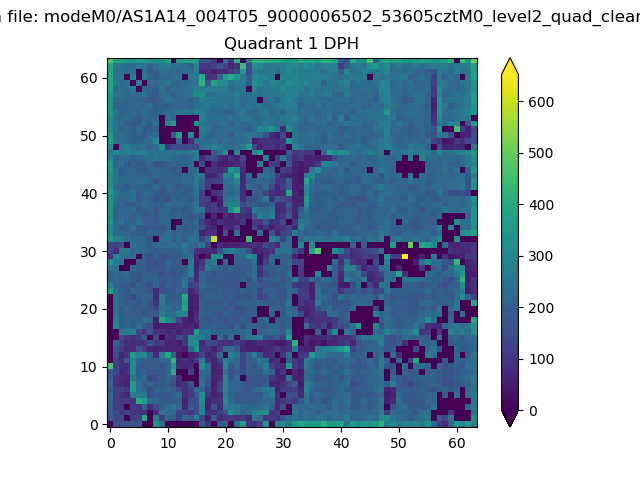 |
Quadrant B |
|---|---|---|---|
| Quadrant D | 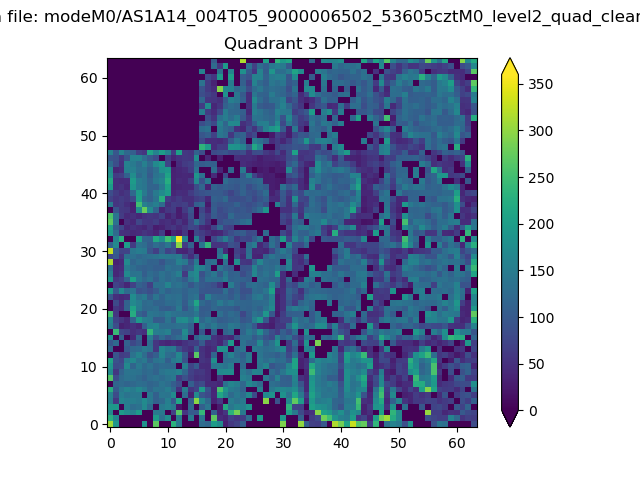 |
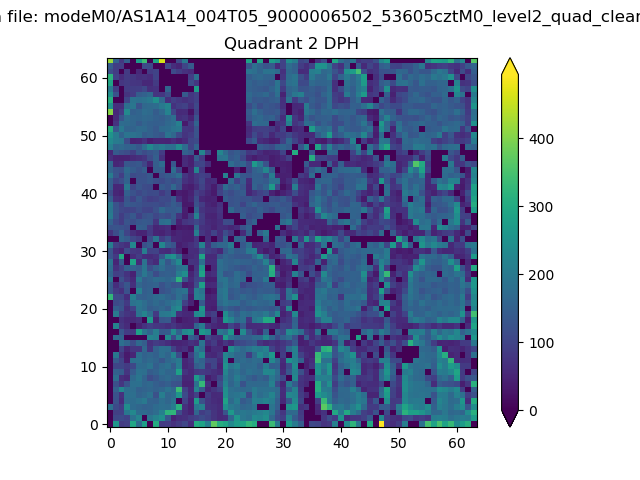 |
Quadrant C |
| Plot type | Count rate plots | Images |
|---|---|---|
| Comparison with Poisson distribution Blue bars denote a histogram of data divided into 1 sec bins. Red curve is a Poisson curve with rate = median count rate of data. |
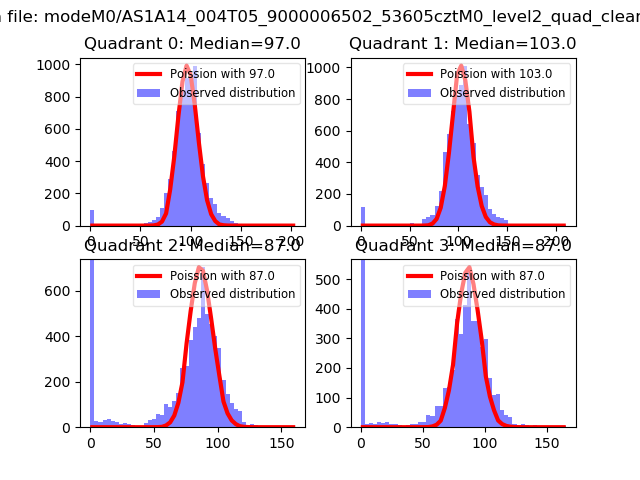 |
 |
| Quadrant-wise count rates Data is divided into 100 sec bins |
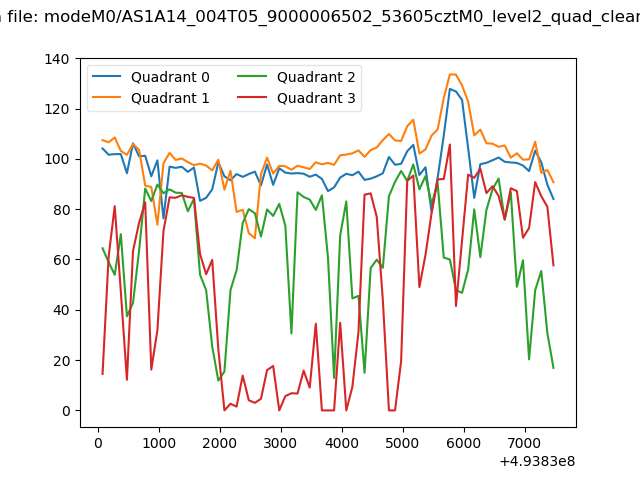 |
|
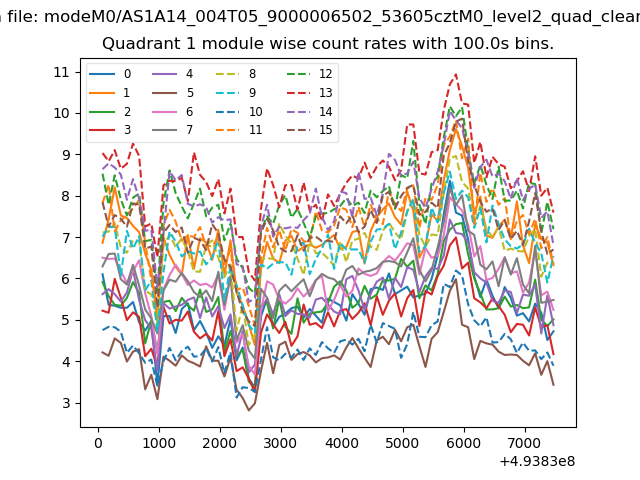
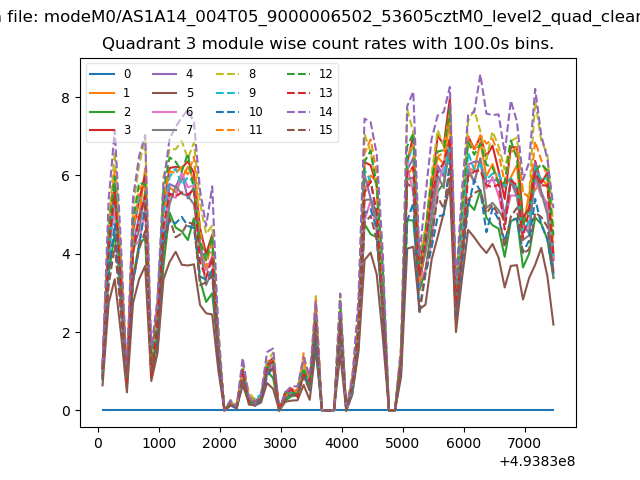
| Module-wise count rates for Quadrant A Data is divided into 100 sec bins |
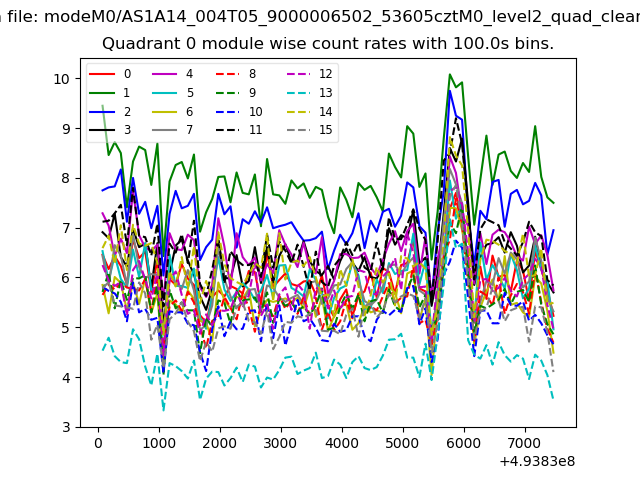 |
 |
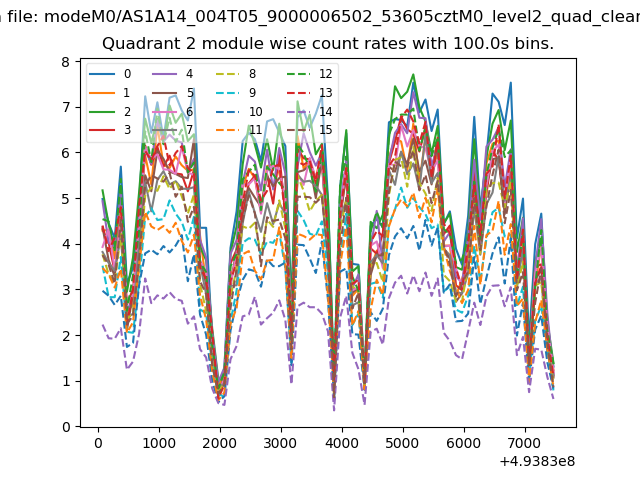
| Module-wise count rates for Quadrant B Data is divided into 100 sec bins |
 |
 |
| Module-wise count rates for Quadrant C Data is divided into 100 sec bins |
 |
 |
| Module-wise count rates for Quadrant D Data is divided into 100 sec bins |
 |
 |
| Parameter | Plot |
|---|---|
| CZT HV Monitor | 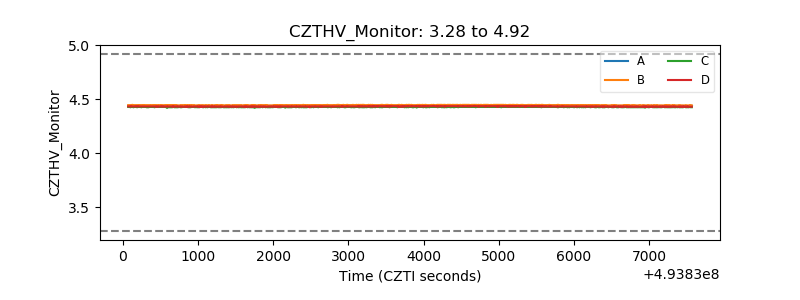 |
| D_VDD | 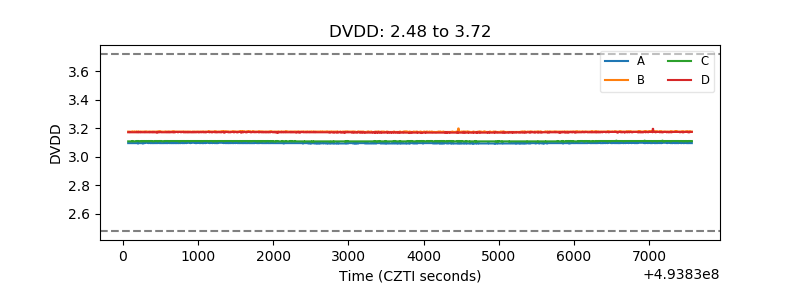 |
| Temperature 1 | 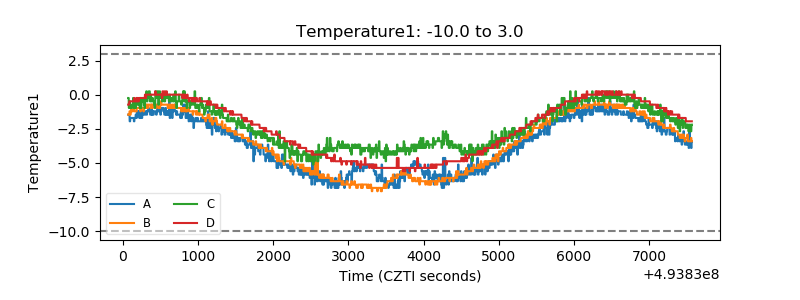 |
| Veto HV Monitor | 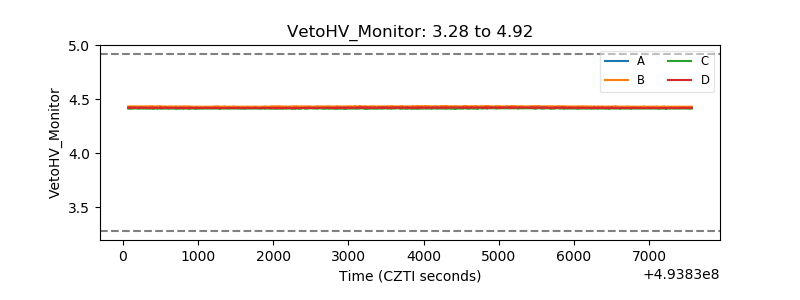 |
| Veto LLD | 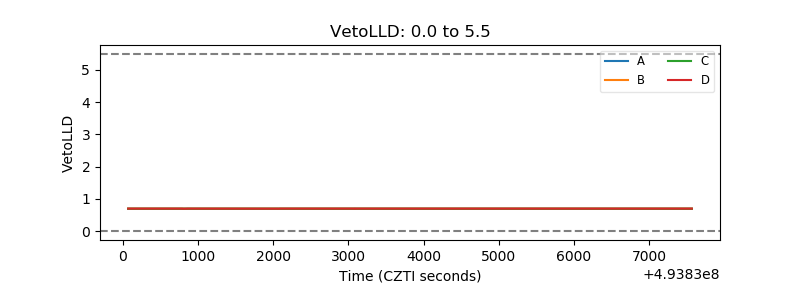 |
| Alpha Counter | 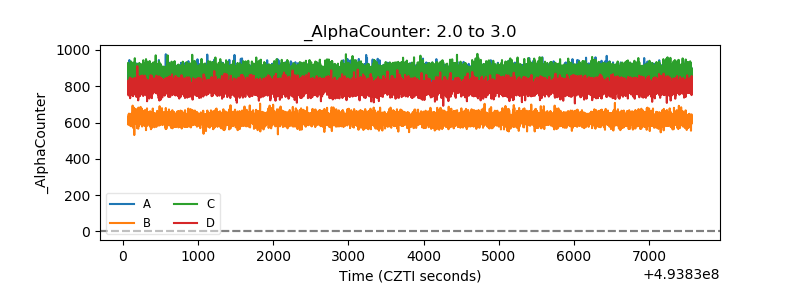 |
| _CPM_Rate | 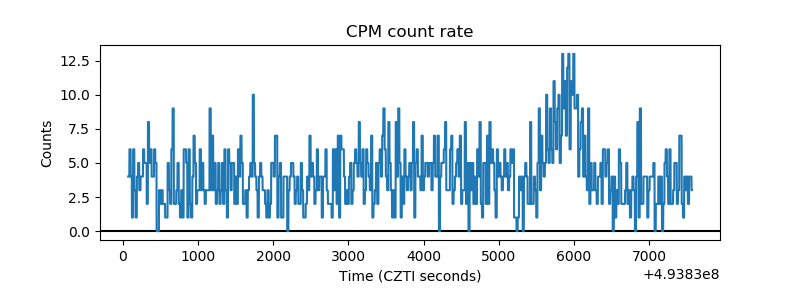 |
| CZT Counter | 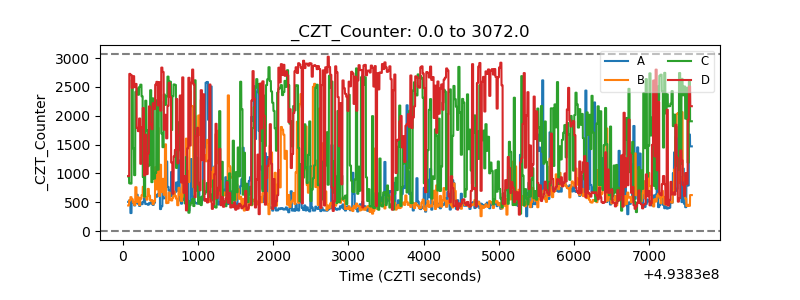 |
| +2.5 Volts monitor | 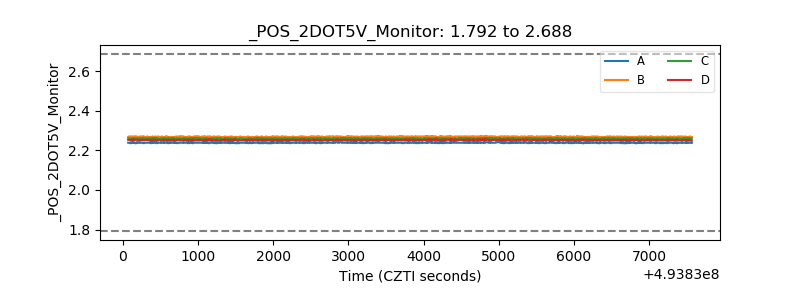 |
| +5 Volts monitor | 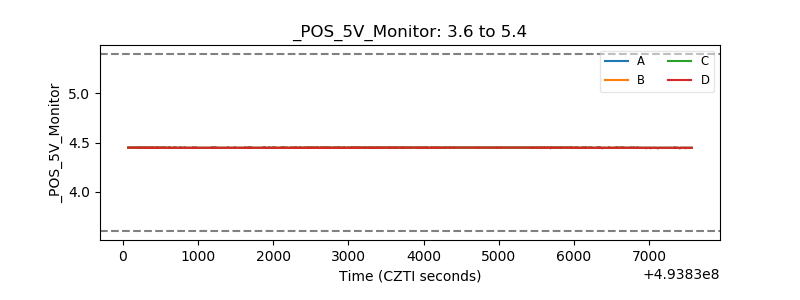 |
| _ROLL_ROT | 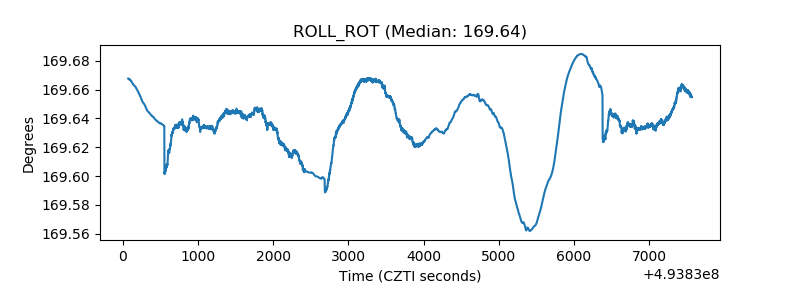 |
| _Roll_DEC | 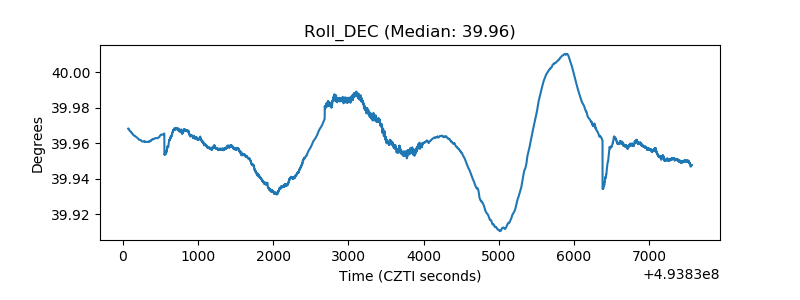 |
| _Roll_RA | 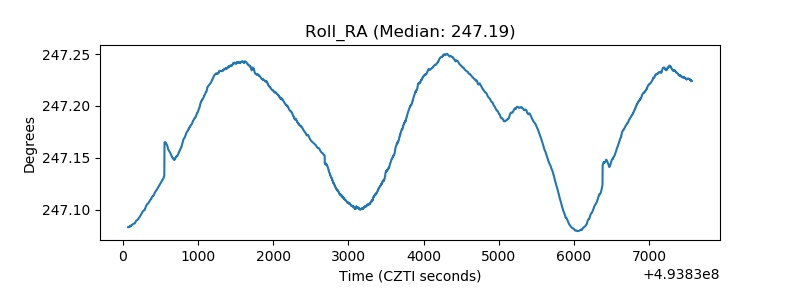 |
| Veto Counter | 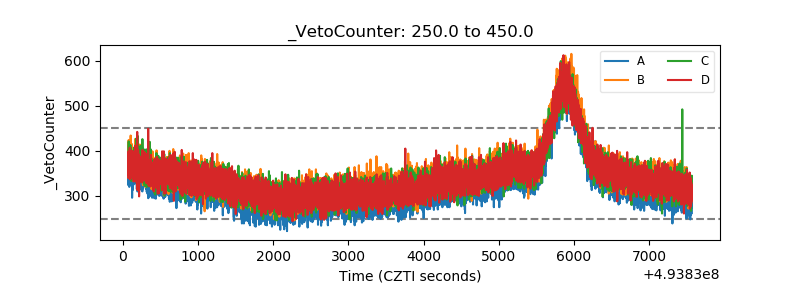 |