| Param | Original file | Final file |
|---|---|---|
| Filename | modeM0/AS1A14_004T05_9000006502_53606cztM0_level2.fits | modeM0/AS1A14_004T05_9000006502_53606cztM0_level2_quad_clean.evt |
| Size (bytes) | 871,251,840 | 94,432,320 |
| Size | 830.9 MB | 90.1 MB |
| Events in quadrant A | 4,705,684 | 717,393 |
| Events in quadrant B | 5,501,069 | 732,906 |
| Events in quadrant C | 13,446,278 | 345,268 |
| Events in quadrant D | 8,023,261 | 546,321 |
| Mode SS | |||
|---|---|---|---|
| Quadrant | BADHDUFLAG | Total packets | Discarded packets |
| A | 0 | 148 | 0 |
| B | 0 | 148 | 0 |
| C | 0 | 148 | 0 |
| D | 0 | 148 | 0 |
| Mode M0 | |||
|---|---|---|---|
| Quadrant | BADHDUFLAG | Total packets | Discarded packets |
| A | 0 | 19006 | 0 |
| B | 0 | 21414 | 0 |
| C | 0 | 45047 | 0 |
| D | 0 | 28981 | 0 |
| Quadrant | Total seconds | Saturated seconds | Saturation percentage |
|---|---|---|---|
| A | 7428 | 118 | 1.588584% |
| B | 7429 | 318 | 4.280522% |
| C | 7429 | 4085 | 54.987212% |
| D | 7429 | 1288 | 17.337461% |
Noise dominated data is calculated using 1-second bins in cleaned event files. If a bin has >2000 counts, and if more than 50% of those come from <1% of pixels, then it is considered to be noise-dominated and hence unusable.
| Quadrant | # 1 sec bins | Bins with >0 counts | Bins with >2000 counts | High rate bins dominated by noise | Noise dominated (total time) | Noise dominated (detector-on time) | Marked lightcurve |
|---|---|---|---|---|---|---|---|
| A | 7433 | 7433 | 97 | 97 | 1.30% | 1.30% | 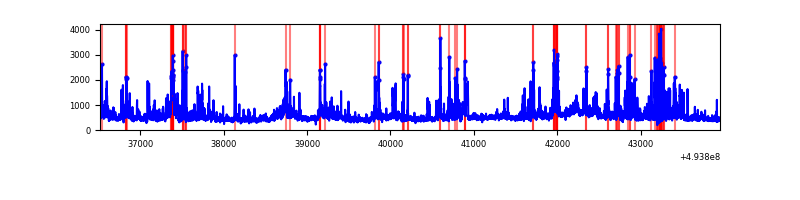 |
| B | 7434 | 7434 | 184 | 184 | 2.48% | 2.48% | 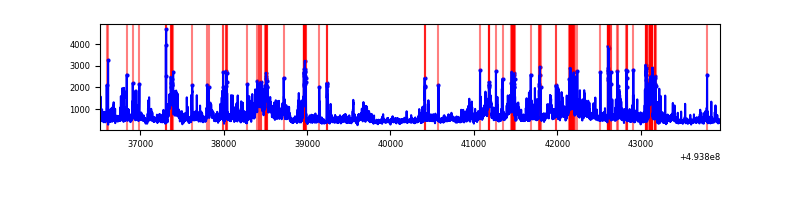 |
| C | 7433 | 7431 | 3548 | 3548 | 47.73% | 47.75% | 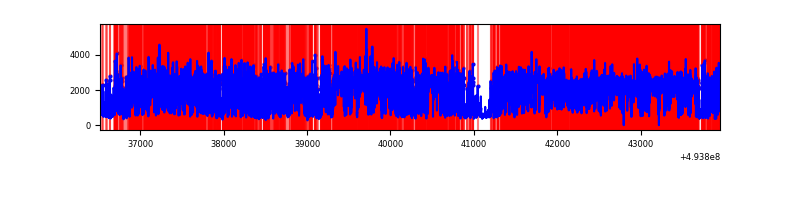 |
| D | 7434 | 7434 | 1216 | 1216 | 16.36% | 16.36% | 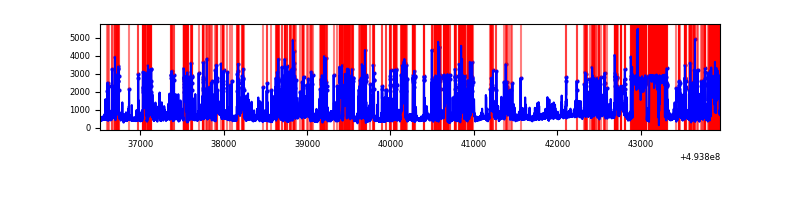 |
Top three noisy pixels from each quadrant. If the there are fewer than three noisy pixels in the level2.evt file, extra rows are filled as -1
| Pixel properties | Quadrant properties | ||||||
|---|---|---|---|---|---|---|---|
| Quadrant | DetID | PixID | Counts | Sigma | Mean | Median | Sigma |
| A | 3 | 63 | 460314 | 2308.73 | 796 | 777 | 199.0 |
| A | 12 | 17 | 394392 | 1977.53 | 796 | 777 | 199.0 |
| A | 10 | 253 | 123829 | 618.22 | 796 | 777 | 199.0 |
| B | 10 | 28 | 872465 | 5259.16 | 779 | 753 | 165.8 |
| B | 0 | 213 | 415586 | 2502.74 | 779 | 753 | 165.8 |
| B | 4 | 206 | 285916 | 1720.43 | 779 | 753 | 165.8 |
| C | 15 | 224 | 7315881 | 47057.81 | 559 | 555 | 155.5 |
| C | 12 | 254 | 1633479 | 10504.22 | 559 | 555 | 155.5 |
| C | 15 | 164 | 900927 | 5791.89 | 559 | 555 | 155.5 |
| D | 8 | 176 | 3659249 | 17986.22 | 709 | 678 | 203.4 |
| D | 10 | 172 | 349545 | 1715.1 | 709 | 678 | 203.4 |
| D | 3 | 12 | 230130 | 1128.03 | 709 | 678 | 203.4 |
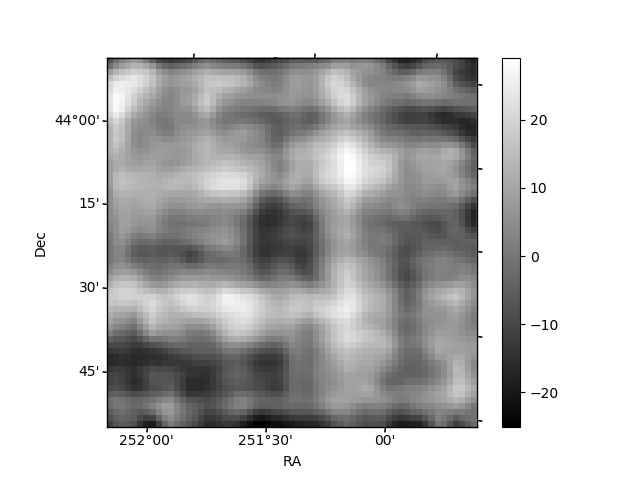
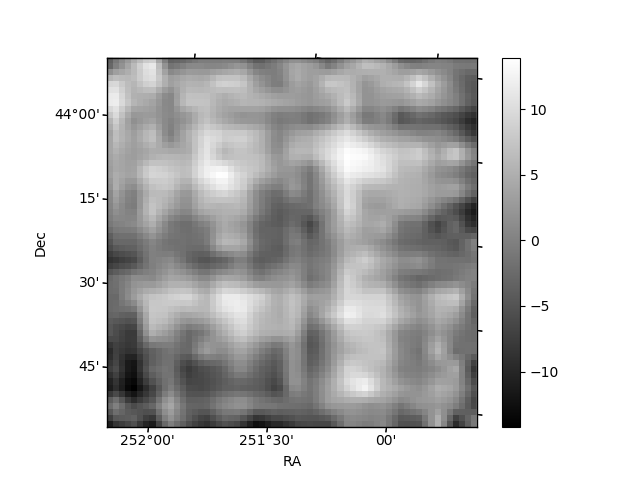
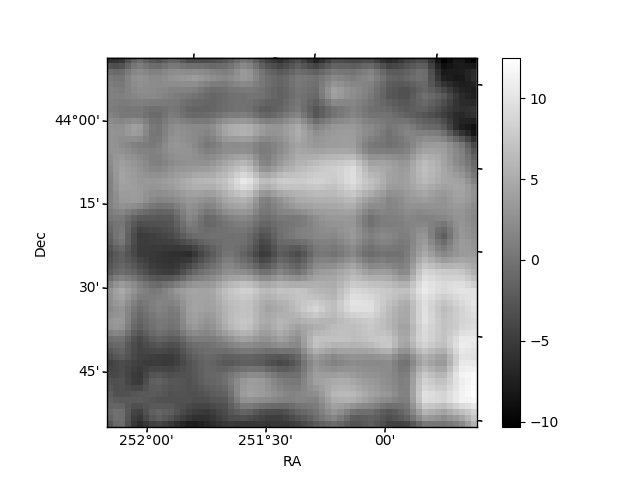
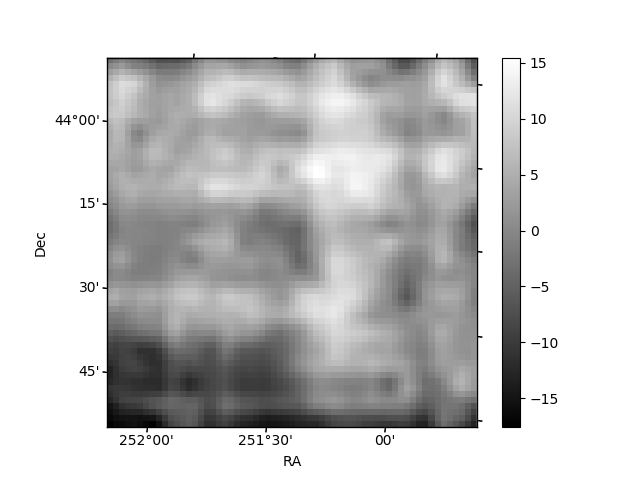
Histogram calculated using DETX and DETY for each event in the final _common_clean file
| Quadrant A | 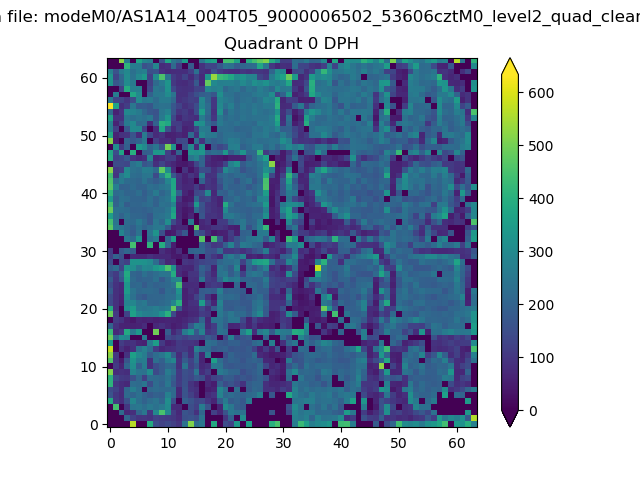 |
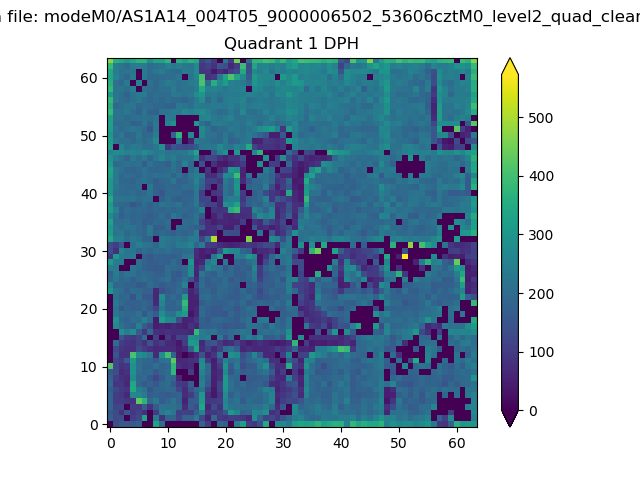 |
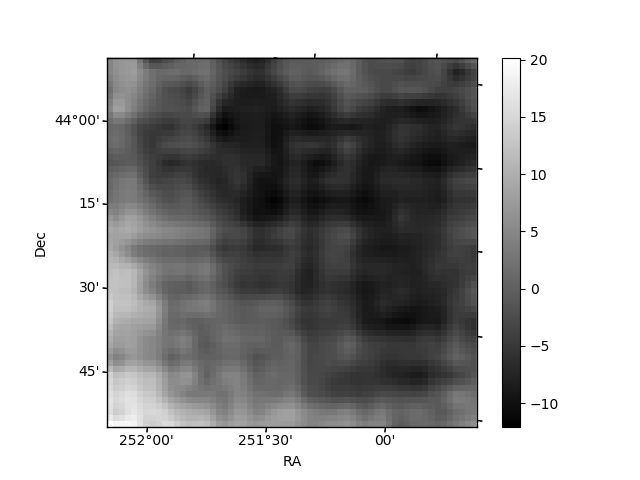
Quadrant B |
|---|---|---|---|
| Quadrant D | 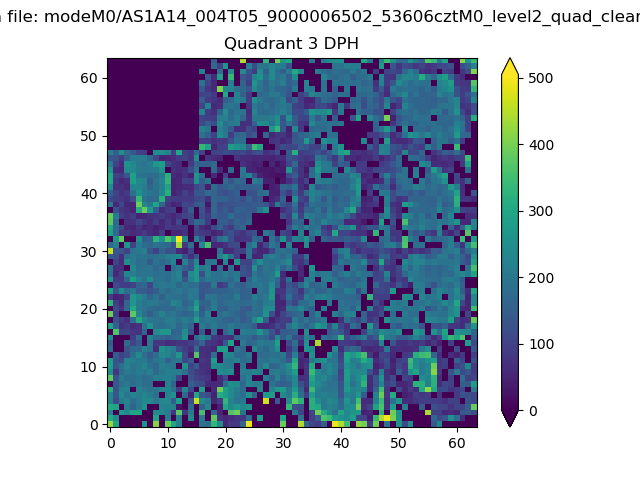 |
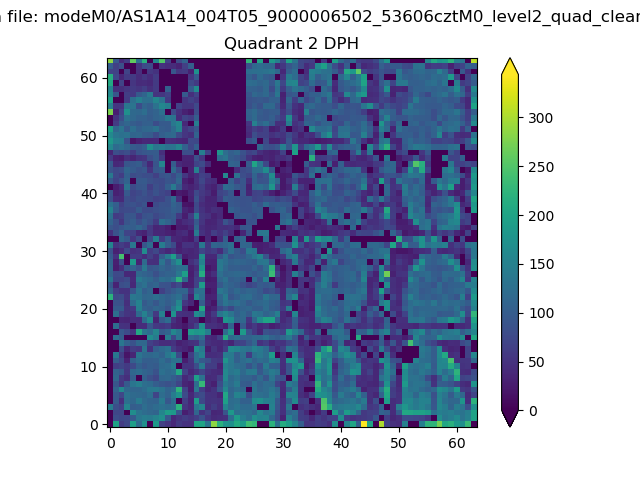 |
Quadrant C |
| Plot type | Count rate plots | Images |
|---|---|---|
| Comparison with Poisson distribution Blue bars denote a histogram of data divided into 1 sec bins. Red curve is a Poisson curve with rate = median count rate of data. |
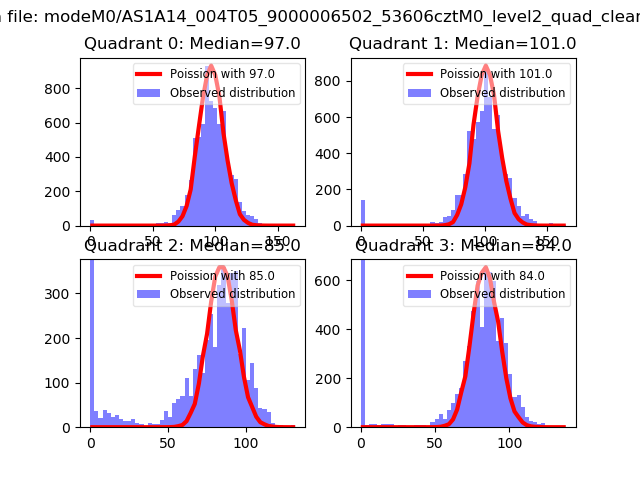 |
 |
| Quadrant-wise count rates Data is divided into 100 sec bins |
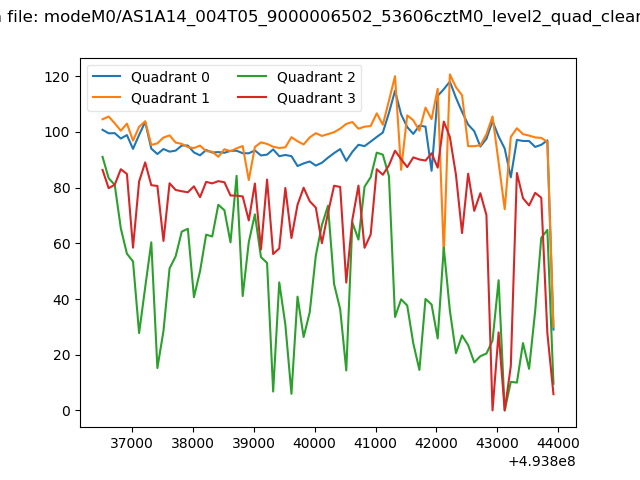 |
|
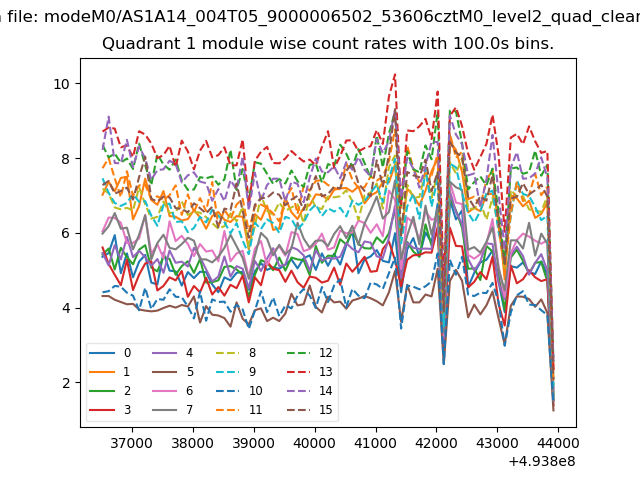
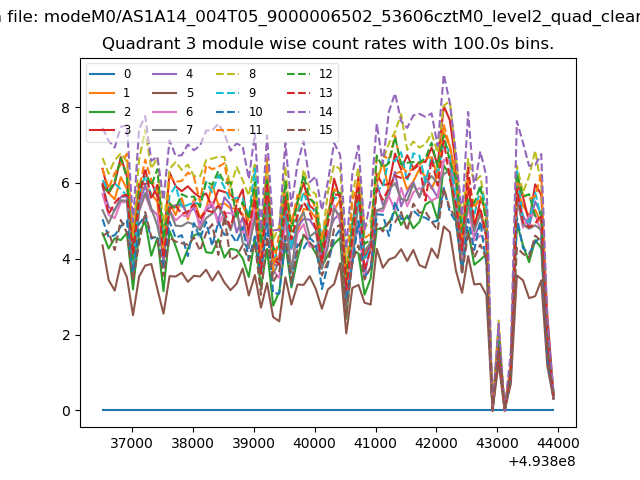
| Module-wise count rates for Quadrant A Data is divided into 100 sec bins |
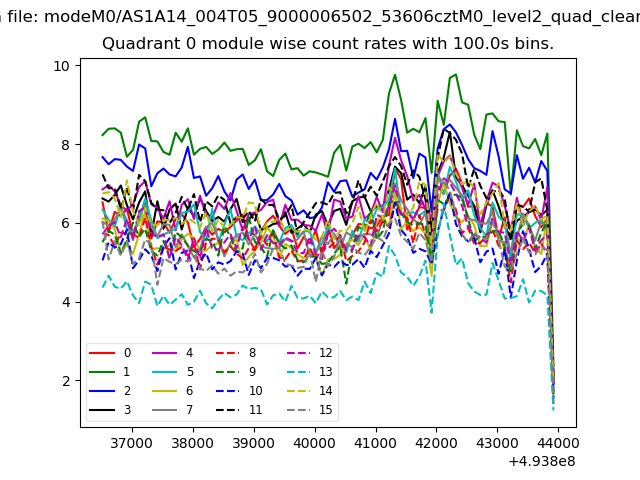 |
 |
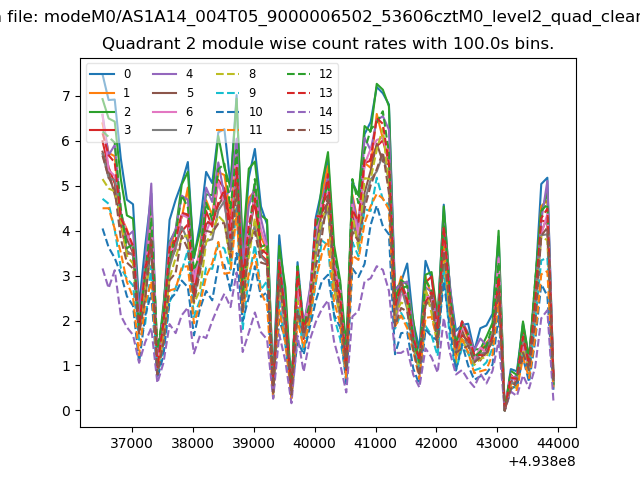
| Module-wise count rates for Quadrant B Data is divided into 100 sec bins |
 |
 |
| Module-wise count rates for Quadrant C Data is divided into 100 sec bins |
 |
 |
| Module-wise count rates for Quadrant D Data is divided into 100 sec bins |
 |
 |
| Parameter | Plot |
|---|---|
| CZT HV Monitor | 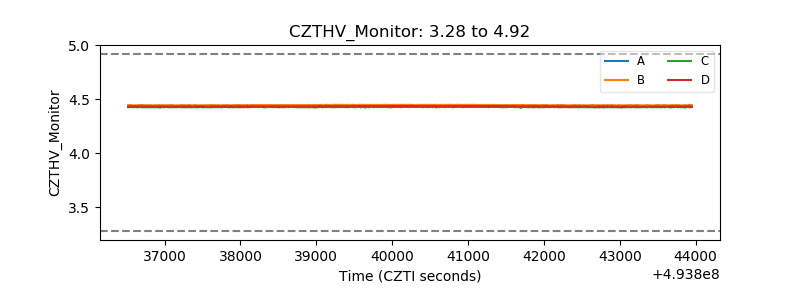 |
| D_VDD | 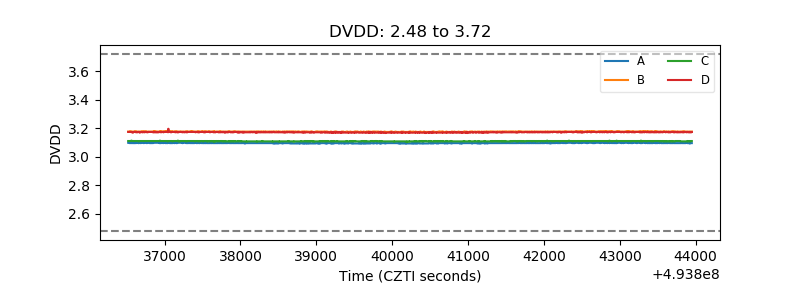 |
| Temperature 1 | 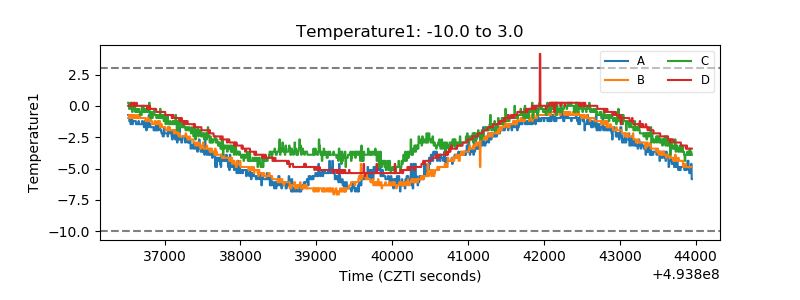 |
| Veto HV Monitor | 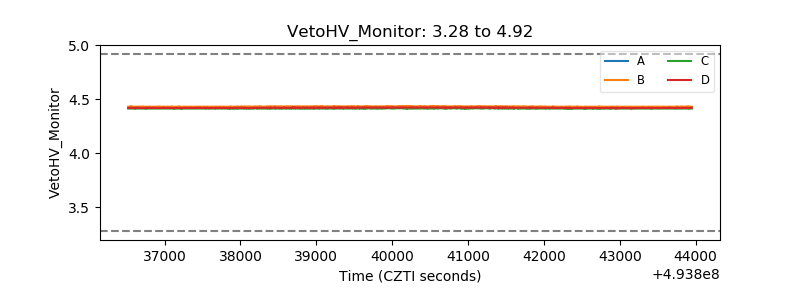 |
| Veto LLD | 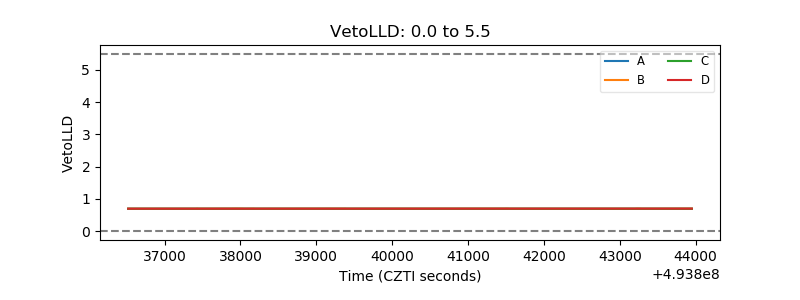 |
| Alpha Counter | 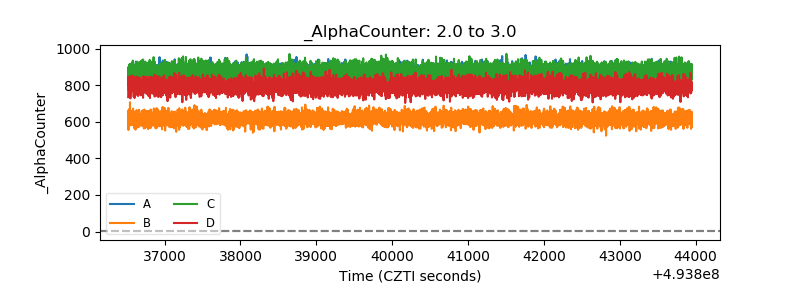 |
| _CPM_Rate | 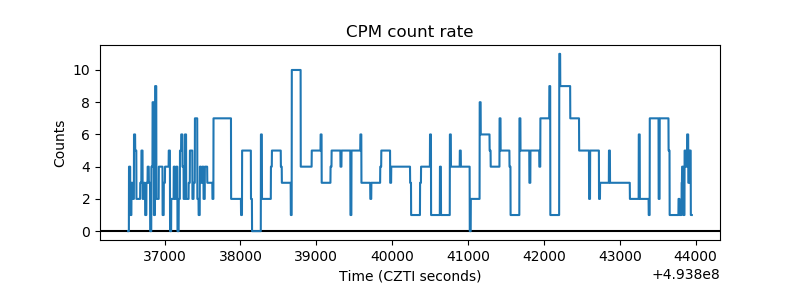 |
| CZT Counter | 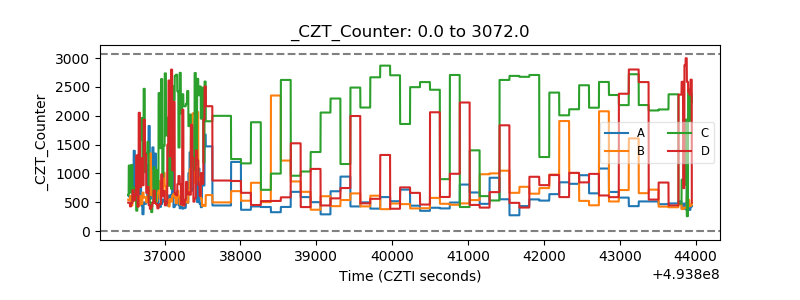 |
| +2.5 Volts monitor |  |
| +5 Volts monitor |  |
| _ROLL_ROT | 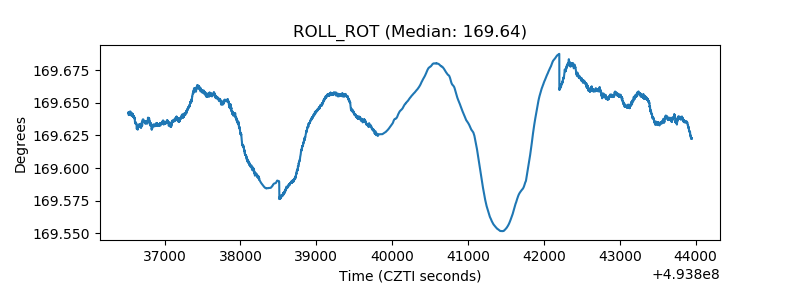 |
| _Roll_DEC | 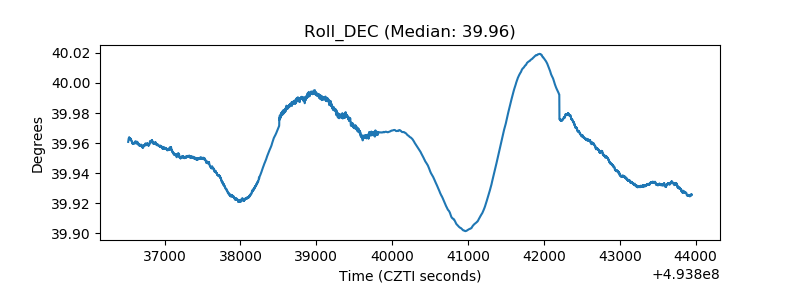 |
| _Roll_RA |  |
| Veto Counter | 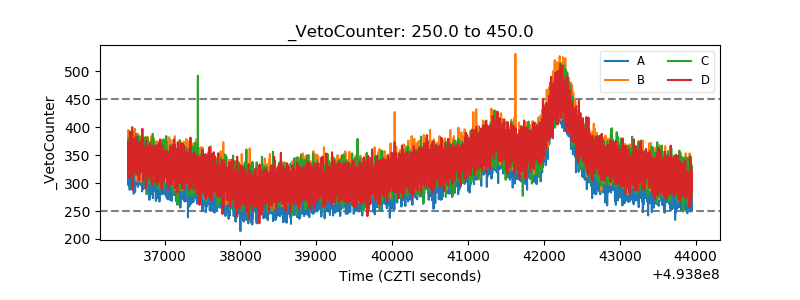 |