| Param | Original file | Final file |
|---|---|---|
| Filename | modeM0/AS1A14_004T05_9000006502_53607cztM0_level2.fits | modeM0/AS1A14_004T05_9000006502_53607cztM0_level2_quad_clean.evt |
| Size (bytes) | 959,875,200 | 99,175,680 |
| Size | 915.4 MB | 94.6 MB |
| Events in quadrant A | 6,023,836 | 721,531 |
| Events in quadrant B | 6,288,570 | 777,632 |
| Events in quadrant C | 14,049,251 | 365,717 |
| Events in quadrant D | 8,555,895 | 585,191 |
| Mode SS | |||
|---|---|---|---|
| Quadrant | BADHDUFLAG | Total packets | Discarded packets |
| A | 0 | 160 | 0 |
| B | 0 | 160 | 0 |
| C | 0 | 160 | 0 |
| D | 0 | 160 | 0 |
| Mode M0 | |||
|---|---|---|---|
| Quadrant | BADHDUFLAG | Total packets | Discarded packets |
| A | 0 | 23526 | 0 |
| B | 0 | 24304 | 0 |
| C | 0 | 47220 | 1 |
| D | 0 | 30904 | 0 |
| Quadrant | Total seconds | Saturated seconds | Saturation percentage |
|---|---|---|---|
| A | 7940 | 608 | 7.657431% |
| B | 7940 | 486 | 6.120907% |
| C | 7940 | 4349 | 54.773300% |
| D | 7940 | 1398 | 17.607053% |
Noise dominated data is calculated using 1-second bins in cleaned event files. If a bin has >2000 counts, and if more than 50% of those come from <1% of pixels, then it is considered to be noise-dominated and hence unusable.
| Quadrant | # 1 sec bins | Bins with >0 counts | Bins with >2000 counts | High rate bins dominated by noise | Noise dominated (total time) | Noise dominated (detector-on time) | Marked lightcurve |
|---|---|---|---|---|---|---|---|
| A | 7945 | 7945 | 419 | 419 | 5.27% | 5.27% | 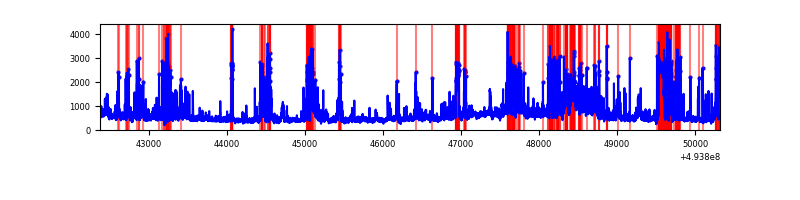 |
| B | 7946 | 7946 | 325 | 325 | 4.09% | 4.09% | 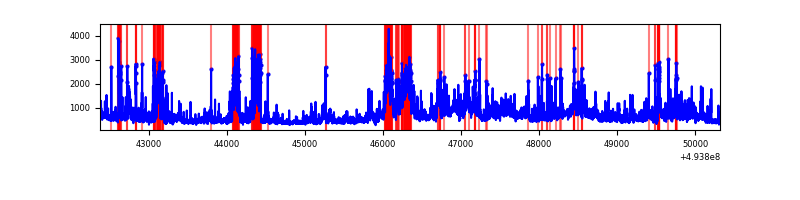 |
| C | 7945 | 7943 | 3674 | 3674 | 46.24% | 46.25% | 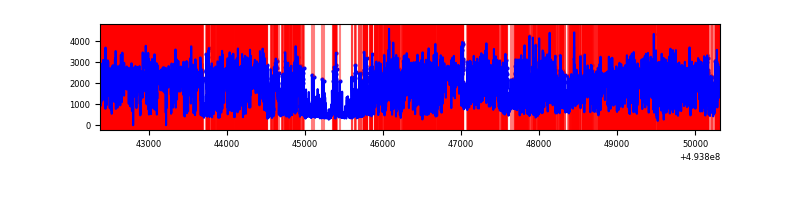 |
| D | 7946 | 7946 | 1273 | 1273 | 16.02% | 16.02% | 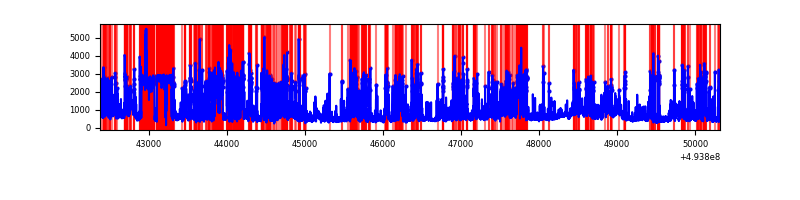 |
Top three noisy pixels from each quadrant. If the there are fewer than three noisy pixels in the level2.evt file, extra rows are filled as -1
| Pixel properties | Quadrant properties | ||||||
|---|---|---|---|---|---|---|---|
| Quadrant | DetID | PixID | Counts | Sigma | Mean | Median | Sigma |
| A | 3 | 78 | 1166176 | 5644.1 | 837 | 816 | 206.5 |
| A | 10 | 253 | 385893 | 1865.02 | 837 | 816 | 206.5 |
| A | 3 | 63 | 245502 | 1185.07 | 837 | 816 | 206.5 |
| B | 10 | 254 | 775245 | 4294.73 | 839 | 811 | 180.3 |
| B | 0 | 213 | 682878 | 3782.49 | 839 | 811 | 180.3 |
| B | 10 | 28 | 517234 | 2863.89 | 839 | 811 | 180.3 |
| C | 15 | 224 | 6072573 | 35609.92 | 613 | 607 | 170.5 |
| C | 15 | 164 | 1344810 | 7883.27 | 613 | 607 | 170.5 |
| C | 15 | 147 | 1307373 | 7663.72 | 613 | 607 | 170.5 |
| D | 8 | 176 | 2900773 | 13179.83 | 762 | 727 | 220.0 |
| D | 10 | 172 | 773798 | 3513.37 | 762 | 727 | 220.0 |
| D | 3 | 12 | 271106 | 1228.79 | 762 | 727 | 220.0 |
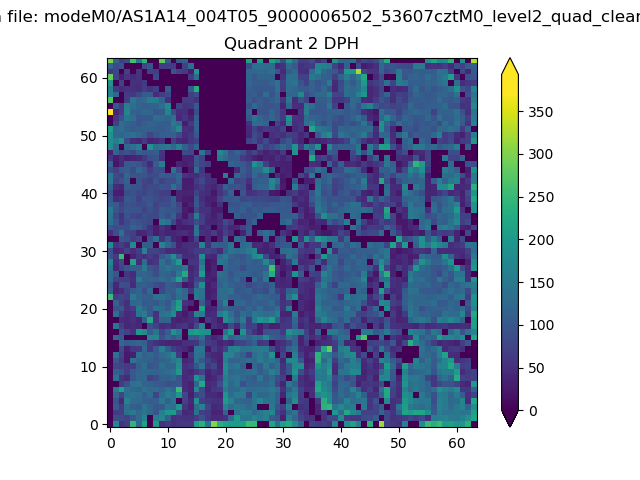
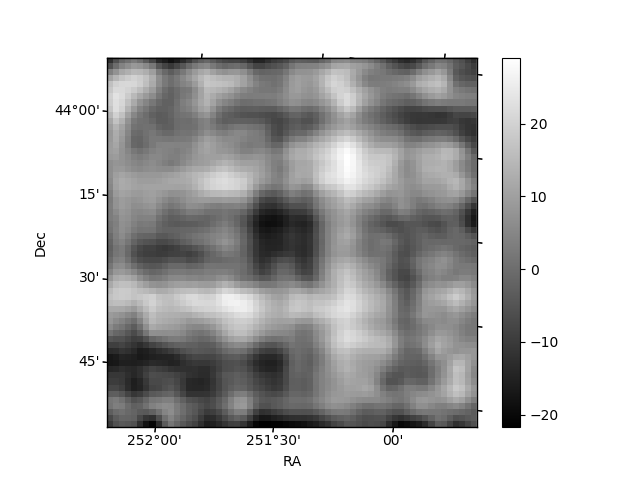
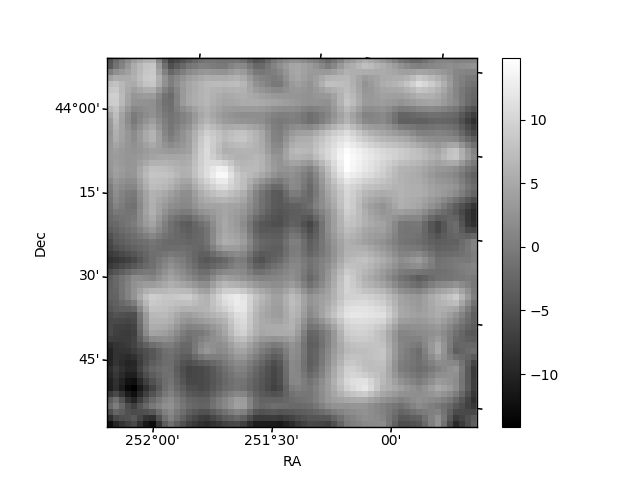
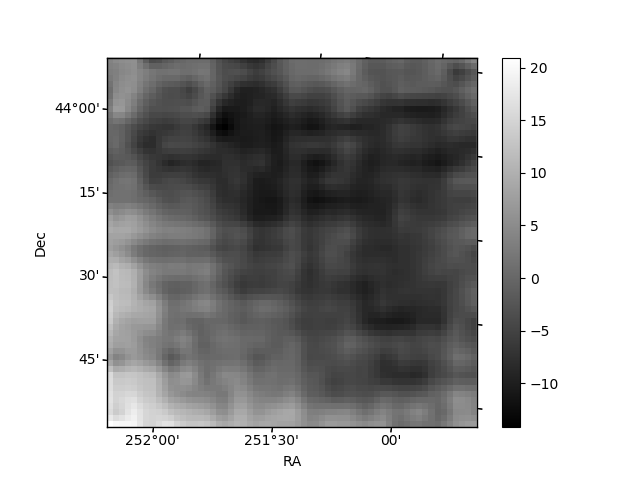
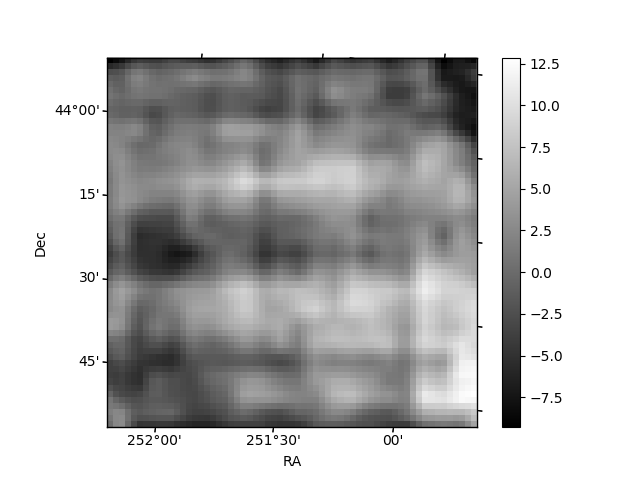
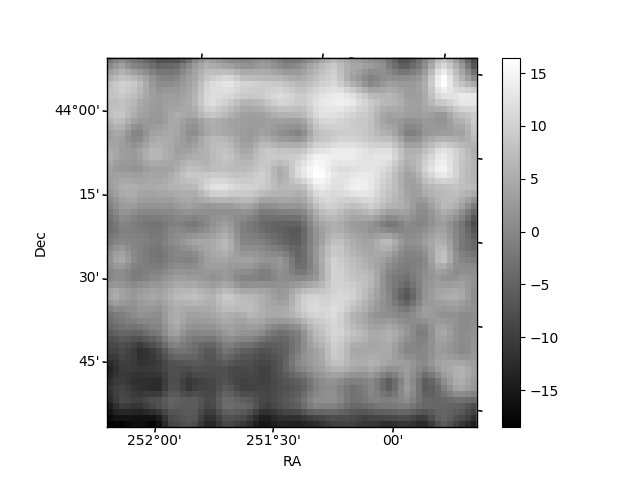
Histogram calculated using DETX and DETY for each event in the final _common_clean file
| Quadrant A | 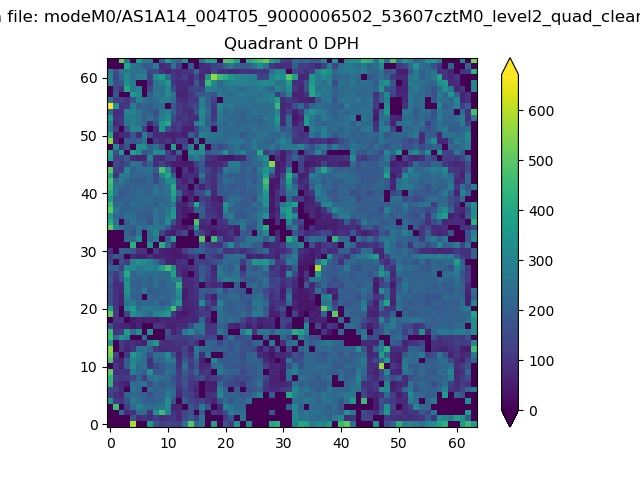 |
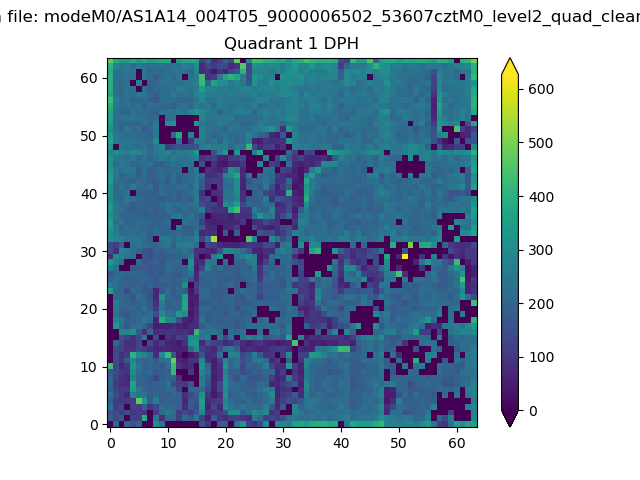 |
Quadrant B |
|---|---|---|---|
| Quadrant D | 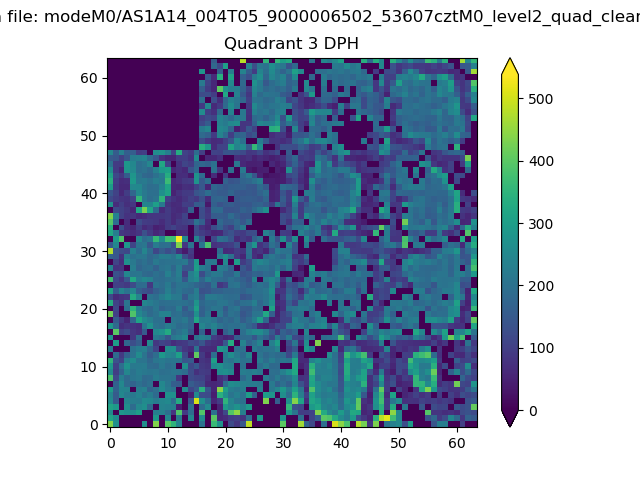 |
 |
Quadrant C |
| Plot type | Count rate plots | Images |
|---|---|---|
| Comparison with Poisson distribution Blue bars denote a histogram of data divided into 1 sec bins. Red curve is a Poisson curve with rate = median count rate of data. |
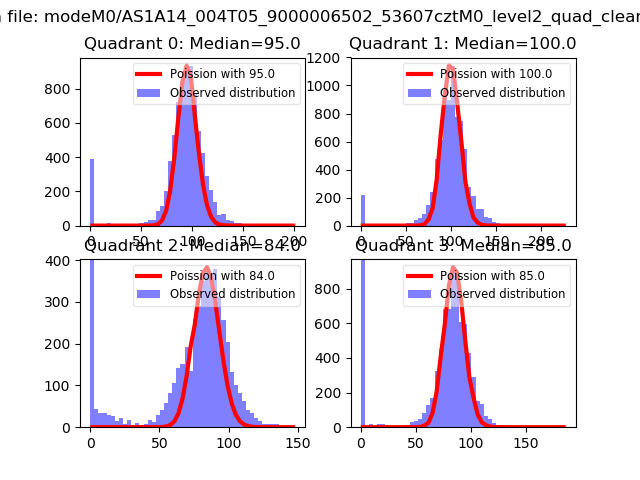 |
 |
| Quadrant-wise count rates Data is divided into 100 sec bins |
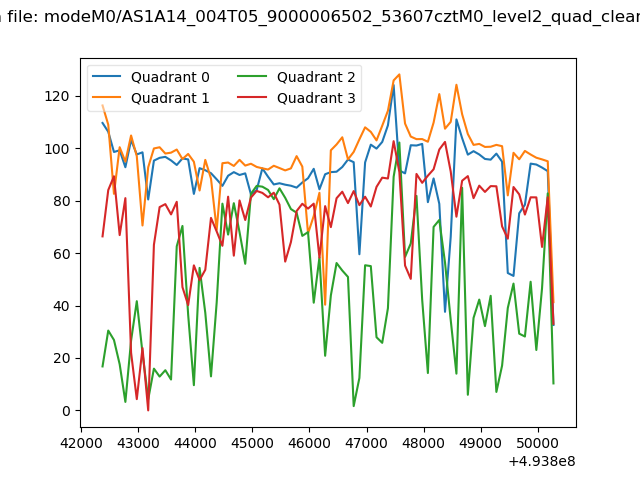 |
|
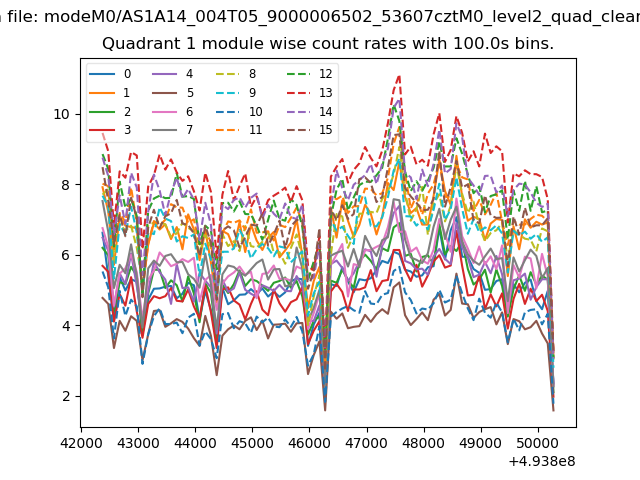
| Module-wise count rates for Quadrant A Data is divided into 100 sec bins |
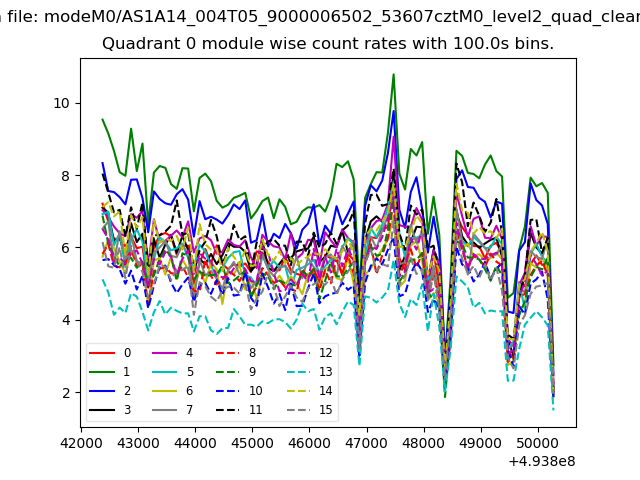 |
 |
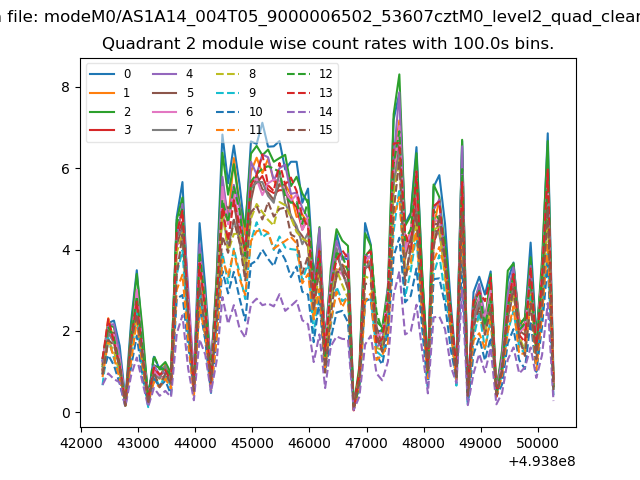
| Module-wise count rates for Quadrant B Data is divided into 100 sec bins |
 |
 |
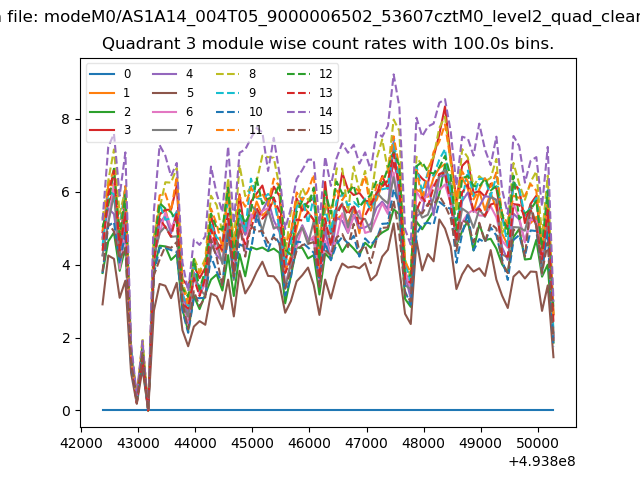
| Module-wise count rates for Quadrant C Data is divided into 100 sec bins |
 |
 |
| Module-wise count rates for Quadrant D Data is divided into 100 sec bins |
 |
 |
| Parameter | Plot |
|---|---|
| CZT HV Monitor | 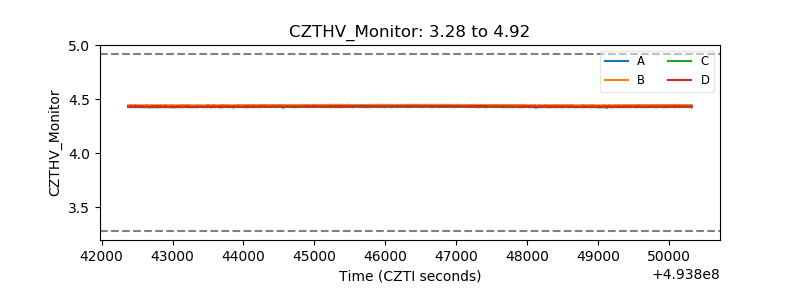 |
| D_VDD | 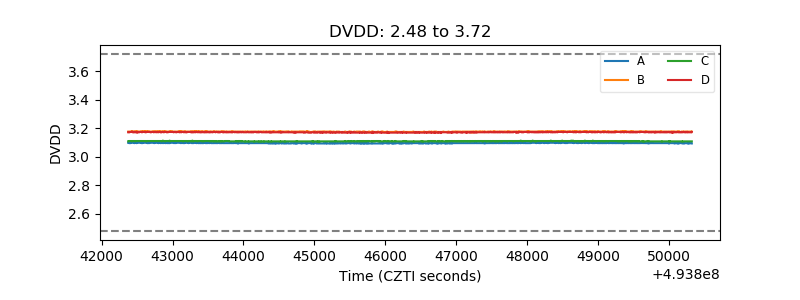 |
| Temperature 1 | 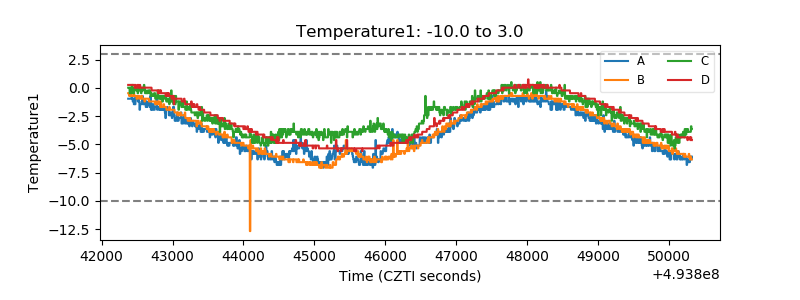 |
| Veto HV Monitor | 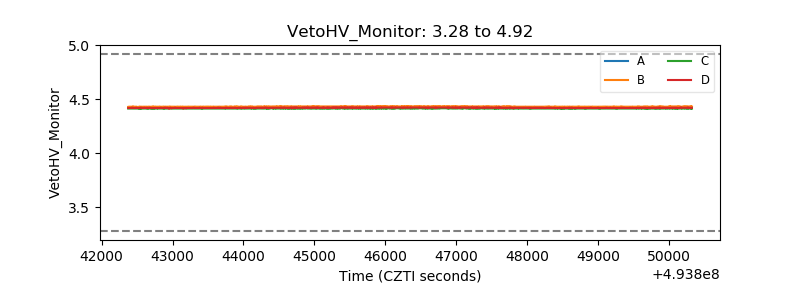 |
| Veto LLD | 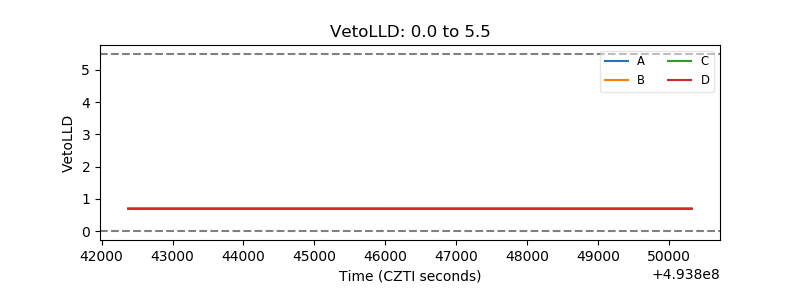 |
| Alpha Counter | 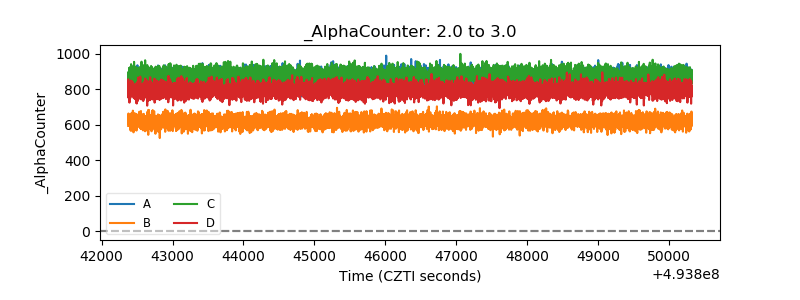 |
| _CPM_Rate | 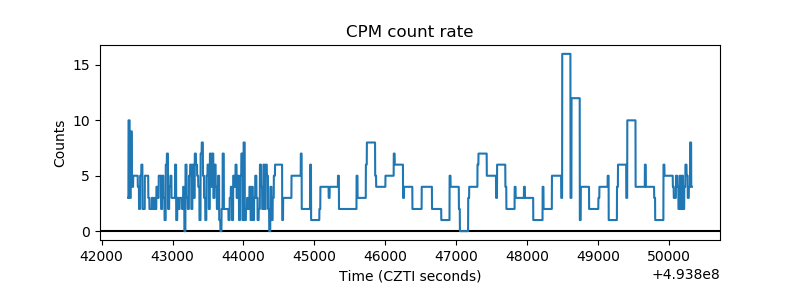 |
| CZT Counter | 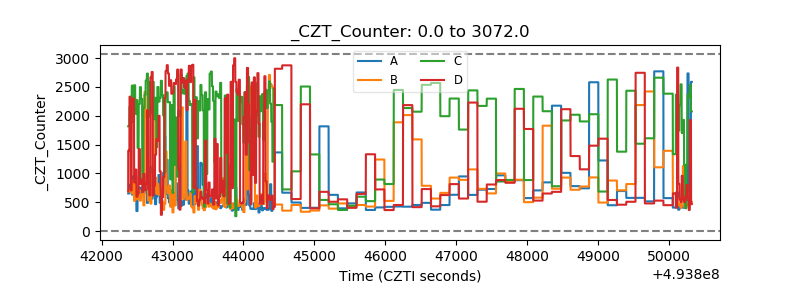 |
| +2.5 Volts monitor |  |
| +5 Volts monitor |  |
| _ROLL_ROT | 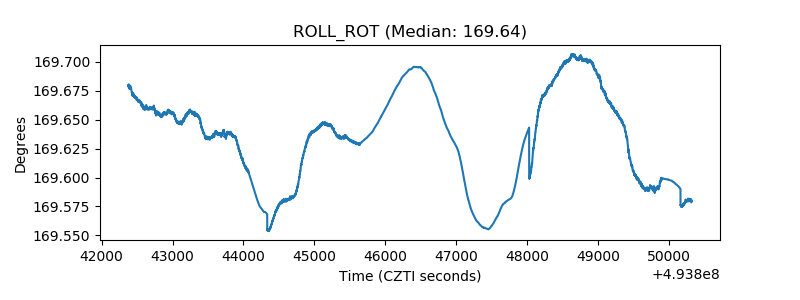 |
| _Roll_DEC | 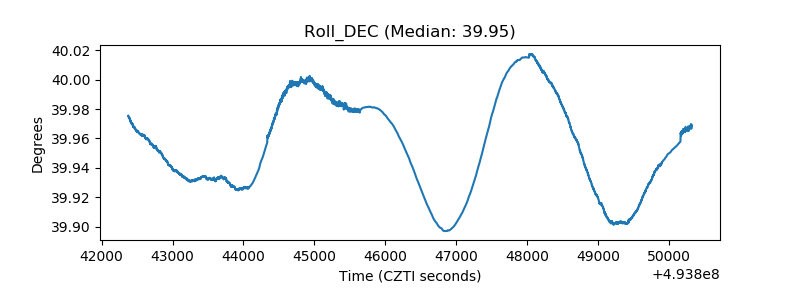 |
| _Roll_RA |  |
| Veto Counter | 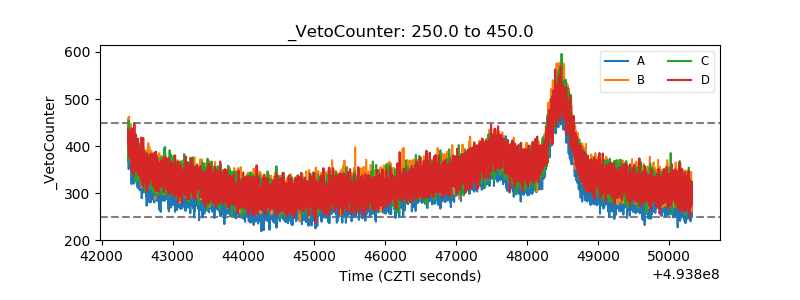 |