| Param | Original file | Final file |
|---|---|---|
| Filename | modeM0/AS1A14_004T05_9000006502_53609cztM0_level2.fits | modeM0/AS1A14_004T05_9000006502_53609cztM0_level2_quad_clean.evt |
| Size (bytes) | 1,061,804,160 | 88,617,600 |
| Size | 1012.6 MB | 84.5 MB |
| Events in quadrant A | 7,751,214 | 623,197 |
| Events in quadrant B | 6,870,587 | 715,523 |
| Events in quadrant C | 14,174,430 | 333,554 |
| Events in quadrant D | 9,919,020 | 479,219 |
| Mode M9 | |||
|---|---|---|---|
| Quadrant | BADHDUFLAG | Total packets | Discarded packets |
| A | 0 | 4 | 0 |
| B | 0 | 4 | 0 |
| C | 0 | 4 | 0 |
| D | 0 | 4 | 0 |
| Mode SS | |||
|---|---|---|---|
| Quadrant | BADHDUFLAG | Total packets | Discarded packets |
| A | 0 | 154 | 0 |
| B | 0 | 154 | 0 |
| C | 0 | 154 | 0 |
| D | 0 | 154 | 0 |
| Mode M0 | |||
|---|---|---|---|
| Quadrant | BADHDUFLAG | Total packets | Discarded packets |
| A | 0 | 28270 | 1 |
| B | 0 | 25715 | 1 |
| C | 0 | 47386 | 1 |
| D | 0 | 34684 | 2 |
| Quadrant | Total seconds | Saturated seconds | Saturation percentage |
|---|---|---|---|
| A | 7636 | 1260 | 16.500786% |
| B | 7636 | 725 | 9.494500% |
| C | 7636 | 4366 | 57.176532% |
| D | 7636 | 2281 | 29.871661% |
Noise dominated data is calculated using 1-second bins in cleaned event files. If a bin has >2000 counts, and if more than 50% of those come from <1% of pixels, then it is considered to be noise-dominated and hence unusable.
| Quadrant | # 1 sec bins | Bins with >0 counts | Bins with >2000 counts | High rate bins dominated by noise | Noise dominated (total time) | Noise dominated (detector-on time) | Marked lightcurve |
|---|---|---|---|---|---|---|---|
| A | 7972 | 7637 | 1160 | 1160 | 14.55% | 15.19% | 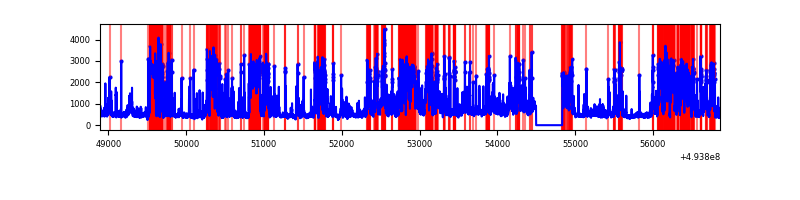 |
| B | 7972 | 7637 | 547 | 547 | 6.86% | 7.16% | 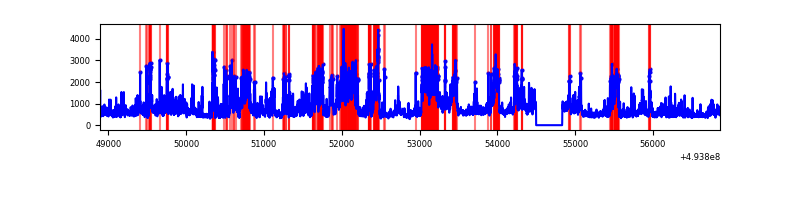 |
| C | 7971 | 7635 | 3875 | 3875 | 48.61% | 50.75% | 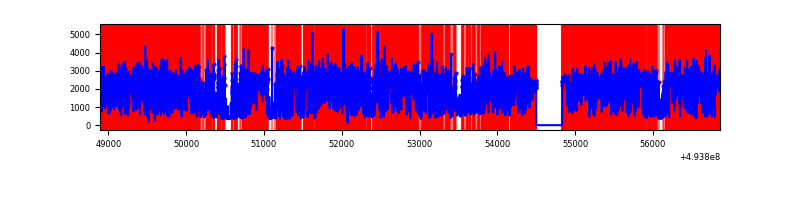 |
| D | 7971 | 7636 | 2108 | 2108 | 26.45% | 27.61% | 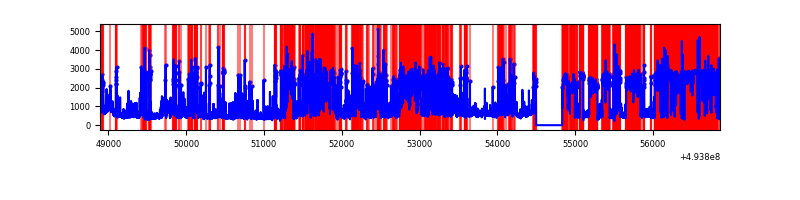 |
Top three noisy pixels from each quadrant. If the there are fewer than three noisy pixels in the level2.evt file, extra rows are filled as -1
| Pixel properties | Quadrant properties | ||||||
|---|---|---|---|---|---|---|---|
| Quadrant | DetID | PixID | Counts | Sigma | Mean | Median | Sigma |
| A | 3 | 78 | 3349859 | 17706.1 | 758 | 740 | 189.2 |
| A | 15 | 174 | 361894 | 1909.35 | 758 | 740 | 189.2 |
| A | 3 | 63 | 326330 | 1721.33 | 758 | 740 | 189.2 |
| B | 10 | 254 | 1700848 | 10153.26 | 784 | 758 | 167.4 |
| B | 10 | 28 | 1335435 | 7970.94 | 784 | 758 | 167.4 |
| B | 0 | 213 | 298860 | 1780.32 | 784 | 758 | 167.4 |
| C | 15 | 224 | 6922029 | 44178.31 | 557 | 552 | 156.7 |
| C | 12 | 254 | 1431177 | 9131.37 | 557 | 552 | 156.7 |
| C | 1 | 241 | 887250 | 5659.6 | 557 | 552 | 156.7 |
| D | 8 | 176 | 4801276 | 25860.91 | 636 | 608 | 185.6 |
| D | 12 | 2 | 985896 | 5307.69 | 636 | 608 | 185.6 |
| D | 3 | 12 | 320861 | 1725.18 | 636 | 608 | 185.6 |
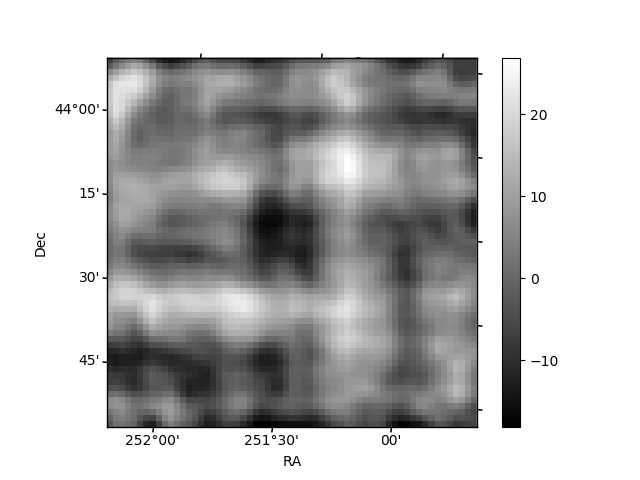
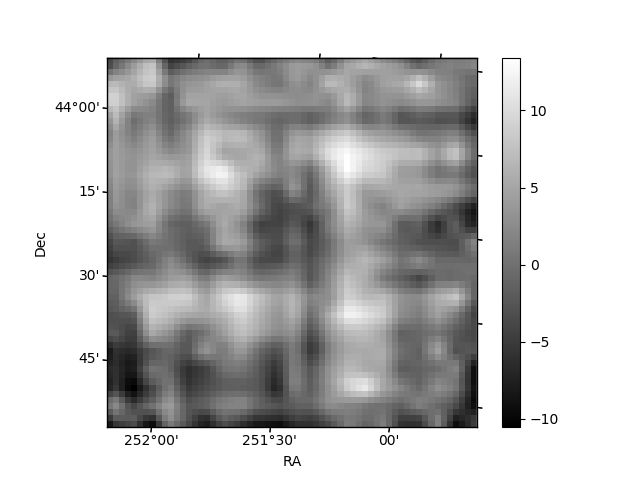
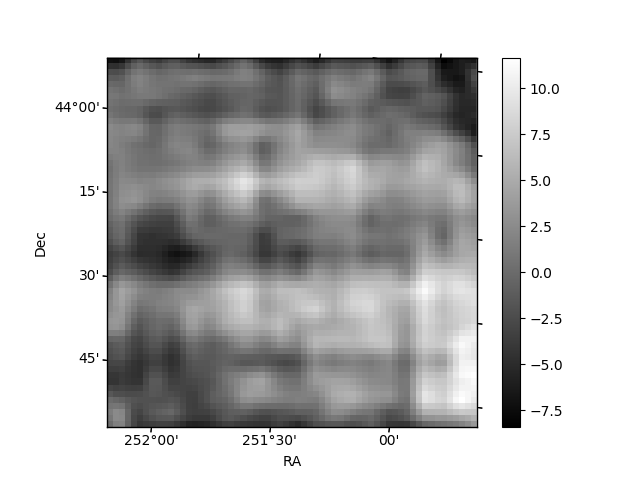
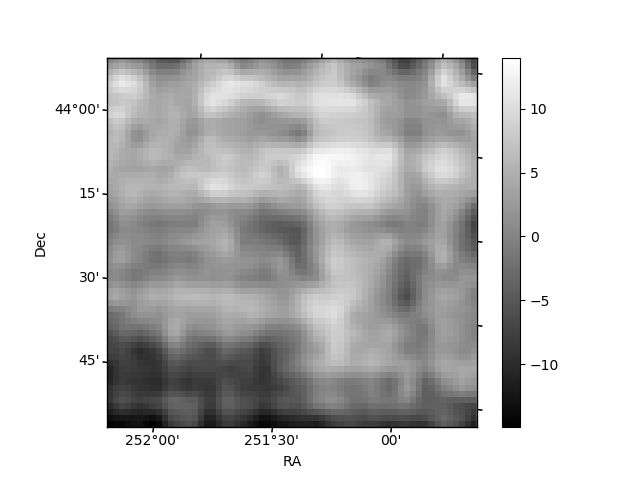
Histogram calculated using DETX and DETY for each event in the final _common_clean file
| Quadrant A | 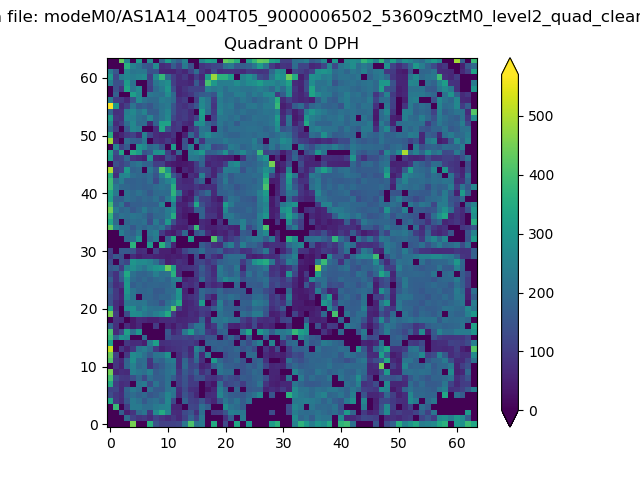 |
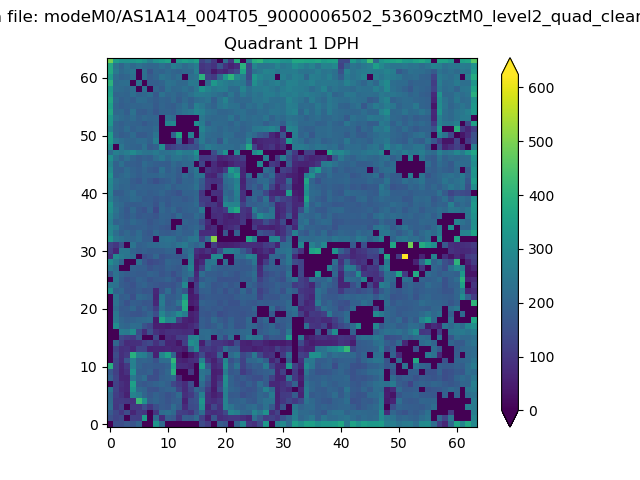 |
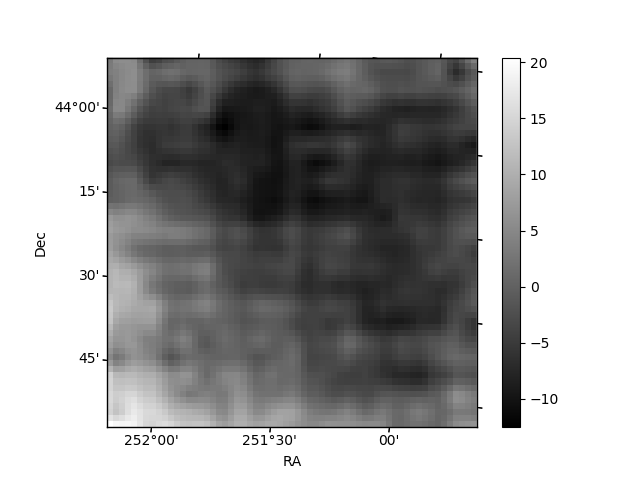
Quadrant B |
|---|---|---|---|
| Quadrant D | 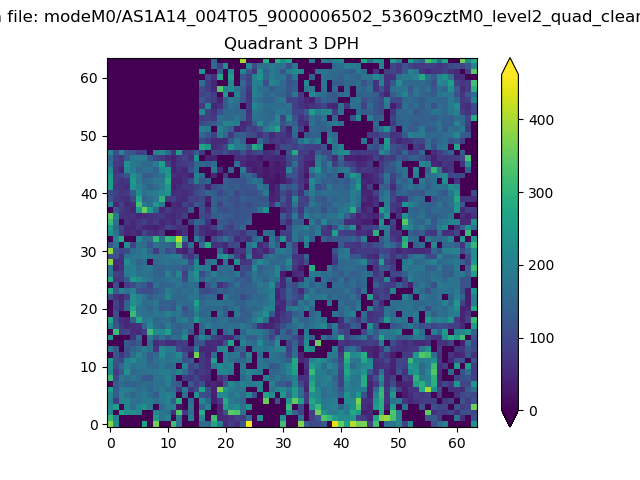 |
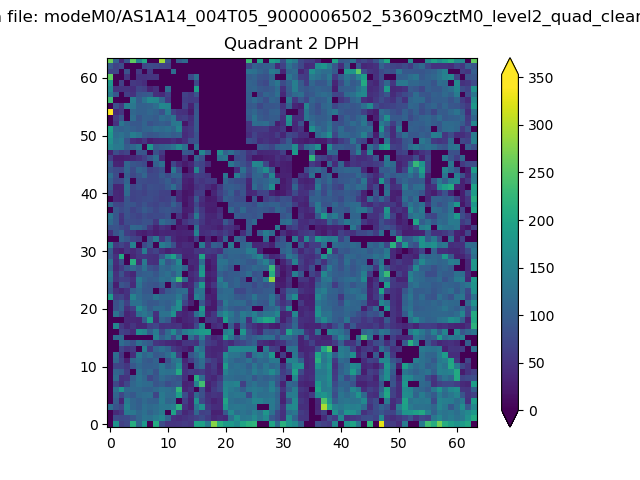 |
Quadrant C |
| Plot type | Count rate plots | Images |
|---|---|---|
| Comparison with Poisson distribution Blue bars denote a histogram of data divided into 1 sec bins. Red curve is a Poisson curve with rate = median count rate of data. |
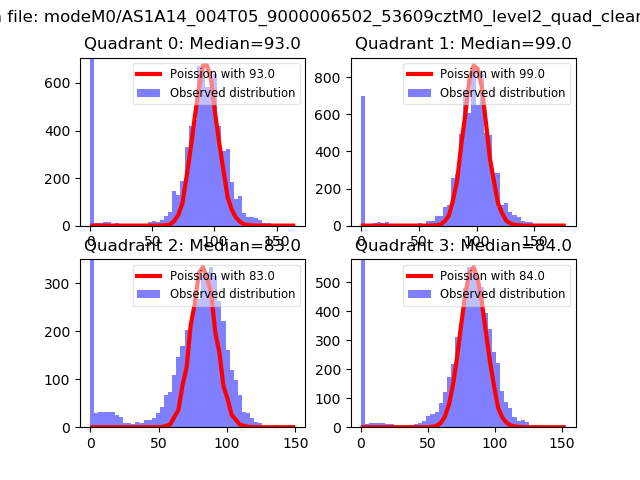 |
 |
| Quadrant-wise count rates Data is divided into 100 sec bins |
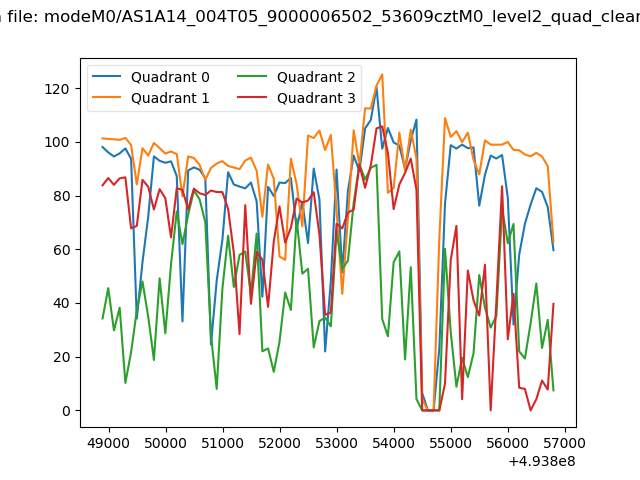 |
|
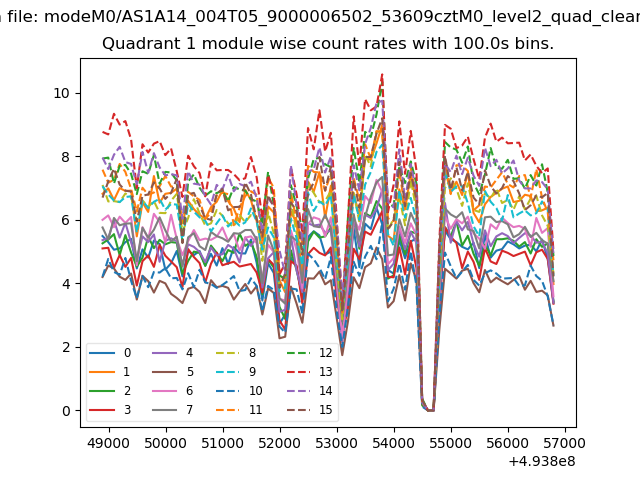
| Module-wise count rates for Quadrant A Data is divided into 100 sec bins |
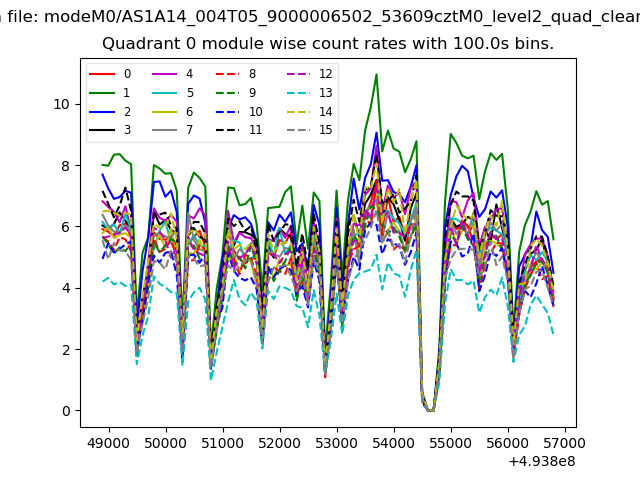 |
 |
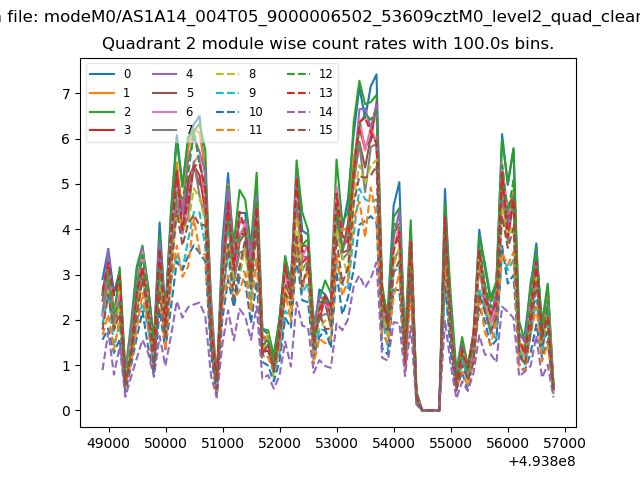
| Module-wise count rates for Quadrant B Data is divided into 100 sec bins |
 |
 |
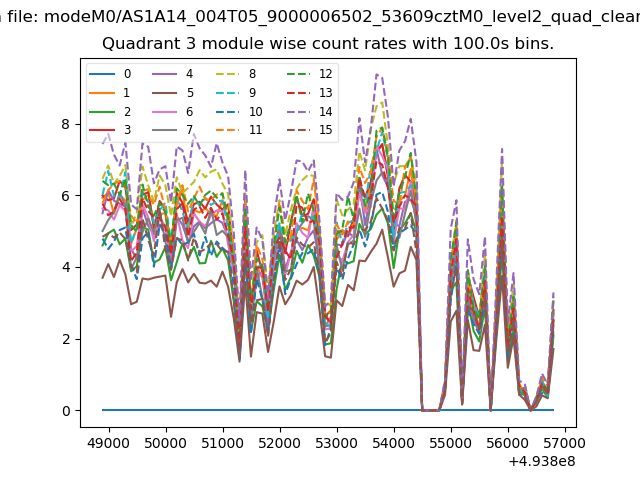
| Module-wise count rates for Quadrant C Data is divided into 100 sec bins |
 |
 |
| Module-wise count rates for Quadrant D Data is divided into 100 sec bins |
 |
 |
| Parameter | Plot |
|---|---|
| CZT HV Monitor | 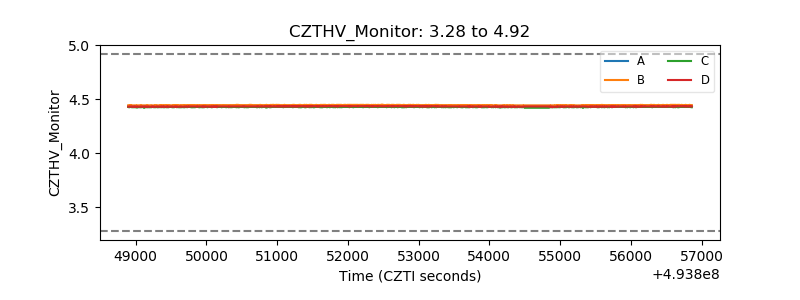 |
| D_VDD | 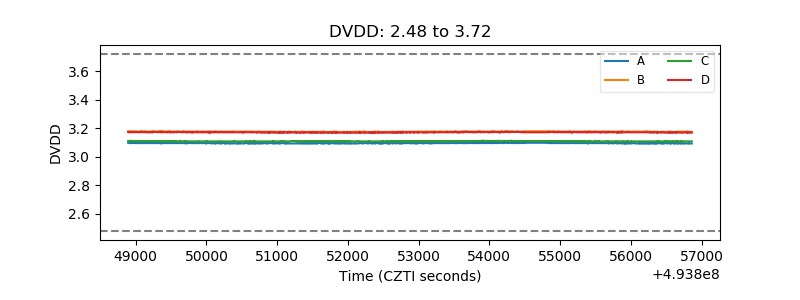 |
| Temperature 1 | 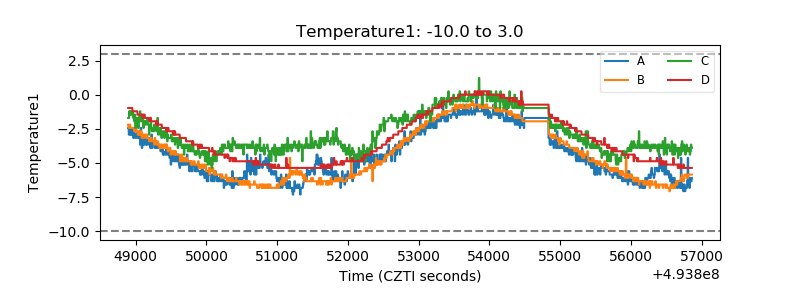 |
| Veto HV Monitor | 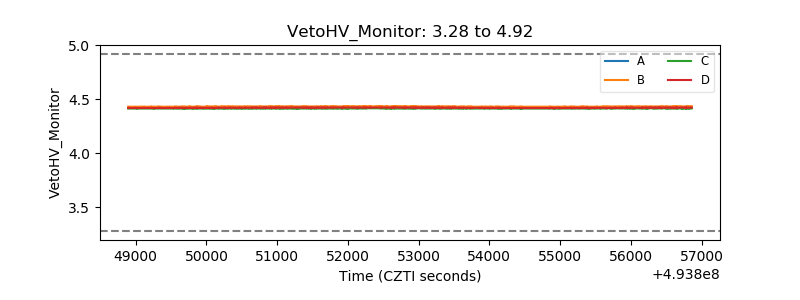 |
| Veto LLD | 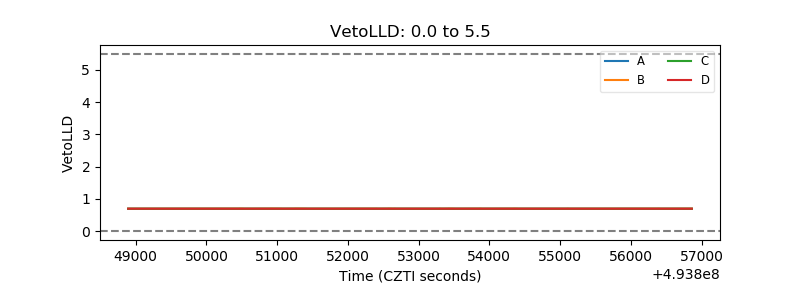 |
| Alpha Counter | 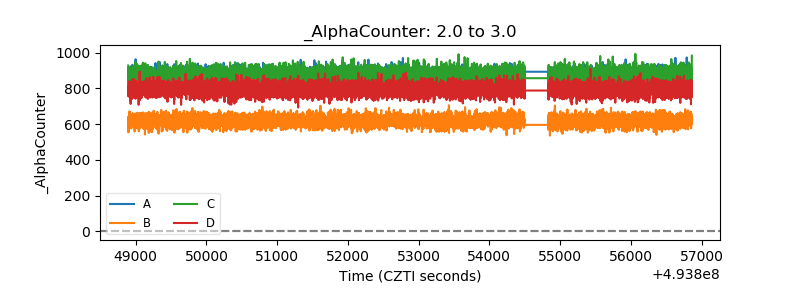 |
| _CPM_Rate | 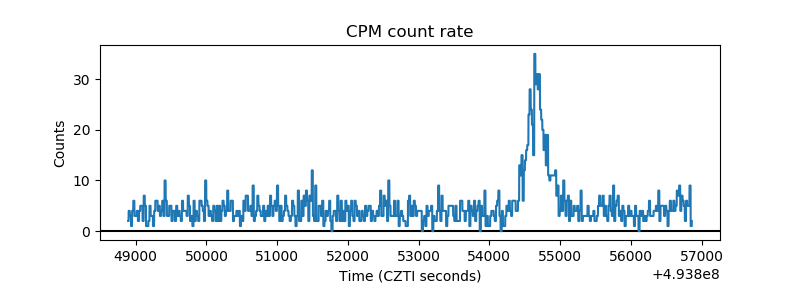 |
| CZT Counter | 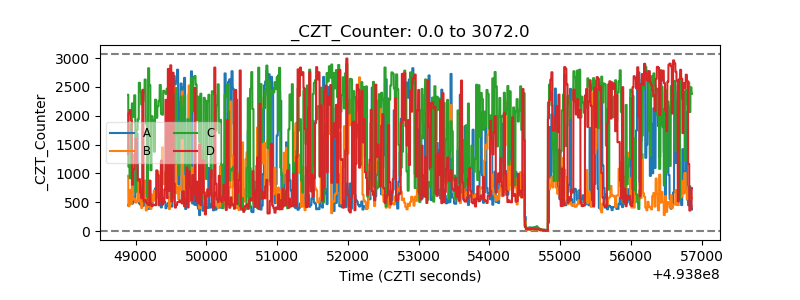 |
| +2.5 Volts monitor |  |
| +5 Volts monitor |  |
| _ROLL_ROT | 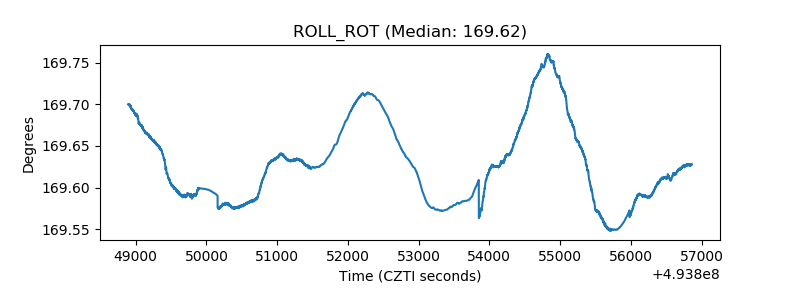 |
| _Roll_DEC | 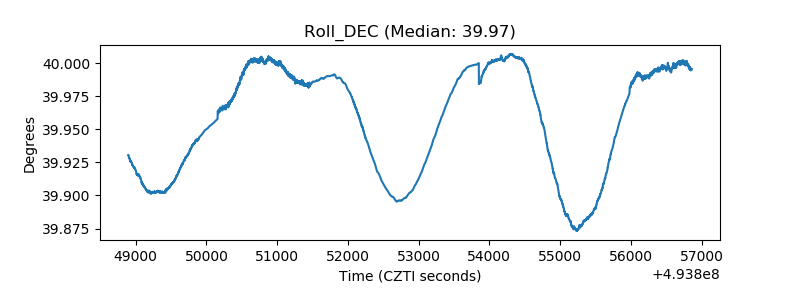 |
| _Roll_RA | 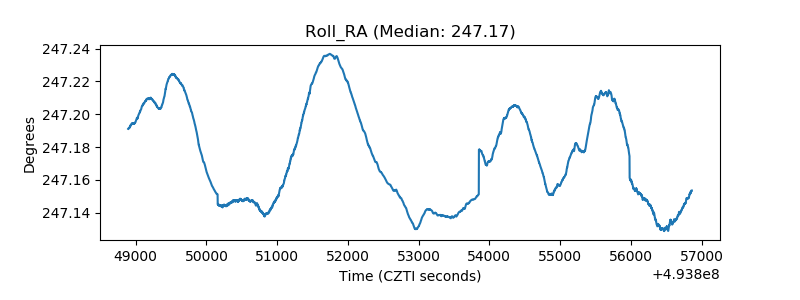 |
| Veto Counter | 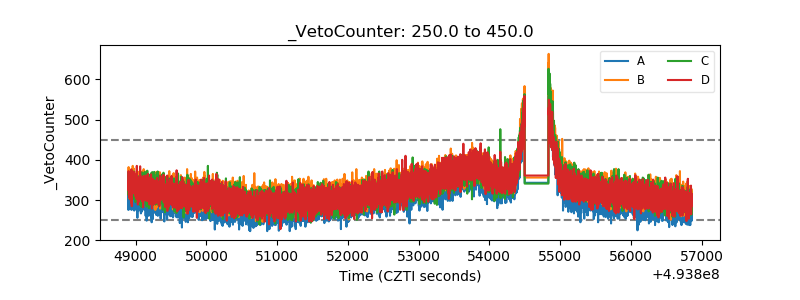 |