| Param | Original file | Final file |
|---|---|---|
| Filename | modeM0/AS1A14_004T05_9000006502_53610cztM0_level2.fits | modeM0/AS1A14_004T05_9000006502_53610cztM0_level2_quad_clean.evt |
| Size (bytes) | 1,508,253,120 | 121,809,600 |
| Size | 1.4 GB | 116.2 MB |
| Events in quadrant A | 9,000,898 | 947,782 |
| Events in quadrant B | 6,295,723 | 1,092,115 |
| Events in quadrant C | 25,199,820 | 221,295 |
| Events in quadrant D | 14,483,057 | 663,121 |
| Mode M9 | |||
|---|---|---|---|
| Quadrant | BADHDUFLAG | Total packets | Discarded packets |
| A | 0 | 14 | 0 |
| B | 0 | 14 | 0 |
| C | 0 | 14 | 0 |
| D | 0 | 14 | 0 |
| Mode SS | |||
|---|---|---|---|
| Quadrant | BADHDUFLAG | Total packets | Discarded packets |
| A | 0 | 224 | 0 |
| B | 0 | 224 | 0 |
| C | 0 | 224 | 0 |
| D | 0 | 224 | 0 |
| Mode M0 | |||
|---|---|---|---|
| Quadrant | BADHDUFLAG | Total packets | Discarded packets |
| A | 0 | 34327 | 2 |
| B | 0 | 26288 | 3 |
| C | 0 | 82231 | 2 |
| D | 0 | 50808 | 2 |
| Quadrant | Total seconds | Saturated seconds | Saturation percentage |
|---|---|---|---|
| A | 11026 | 933 | 8.461818% |
| B | 11026 | 133 | 1.206240% |
| C | 11026 | 8956 | 81.226193% |
| D | 11026 | 3339 | 30.282968% |
Noise dominated data is calculated using 1-second bins in cleaned event files. If a bin has >2000 counts, and if more than 50% of those come from <1% of pixels, then it is considered to be noise-dominated and hence unusable.
| Quadrant | # 1 sec bins | Bins with >0 counts | Bins with >2000 counts | High rate bins dominated by noise | Noise dominated (total time) | Noise dominated (detector-on time) | Marked lightcurve |
|---|---|---|---|---|---|---|---|
| A | 12400 | 11022 | 795 | 795 | 6.41% | 7.21% | 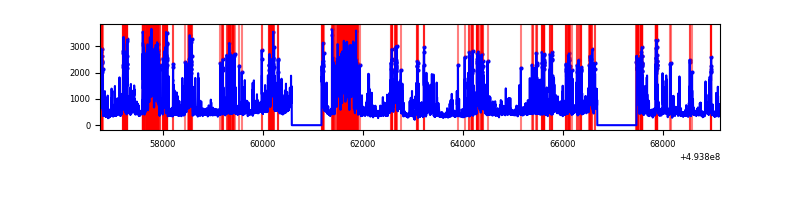 |
| B | 12400 | 11022 | 65 | 65 | 0.52% | 0.59% | 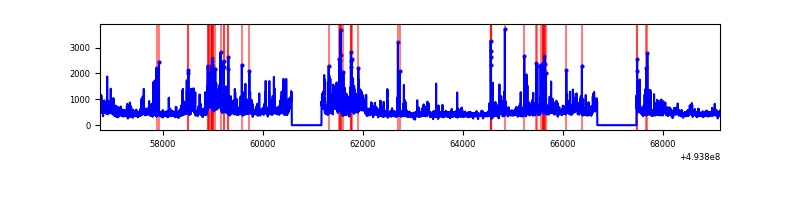 |
| C | 12399 | 11019 | 8249 | 8249 | 66.53% | 74.86% | 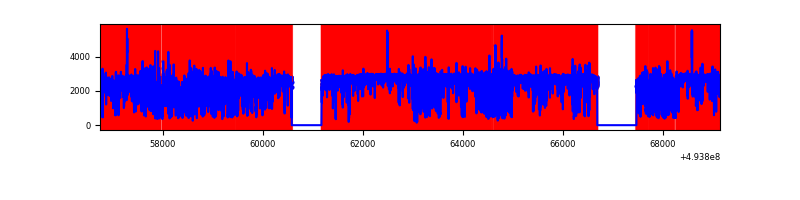 |
| D | 12400 | 11019 | 3027 | 3027 | 24.41% | 27.47% | 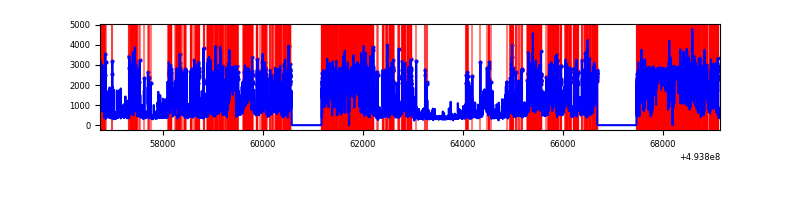 |
Top three noisy pixels from each quadrant. If the there are fewer than three noisy pixels in the level2.evt file, extra rows are filled as -1
| Pixel properties | Quadrant properties | ||||||
|---|---|---|---|---|---|---|---|
| Quadrant | DetID | PixID | Counts | Sigma | Mean | Median | Sigma |
| A | 3 | 78 | 2397430 | 8415.4 | 1150 | 1121 | 284.8 |
| A | 15 | 174 | 821136 | 2879.74 | 1150 | 1121 | 284.8 |
| A | 3 | 63 | 333796 | 1168.29 | 1150 | 1121 | 284.8 |
| B | 10 | 28 | 641226 | 2564.04 | 1167 | 1124 | 249.6 |
| B | 0 | 213 | 265602 | 1059.41 | 1167 | 1124 | 249.6 |
| B | 10 | 247 | 220682 | 879.48 | 1167 | 1124 | 249.6 |
| C | 1 | 241 | 12105288 | 78983.75 | 550 | 546 | 153.3 |
| C | 15 | 224 | 6161231 | 40198.62 | 550 | 546 | 153.3 |
| C | 12 | 254 | 2706424 | 17655.92 | 550 | 546 | 153.3 |
| D | 8 | 176 | 7697205 | 28671.53 | 936 | 896 | 268.4 |
| D | 3 | 12 | 1170483 | 4357.13 | 936 | 896 | 268.4 |
| D | 12 | 34 | 607695 | 2260.55 | 936 | 896 | 268.4 |
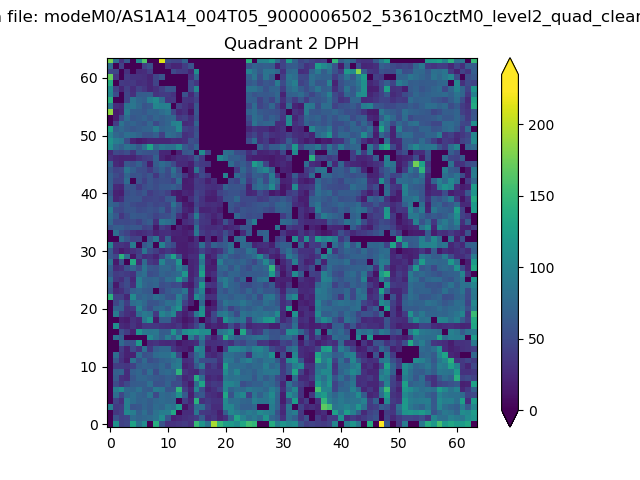
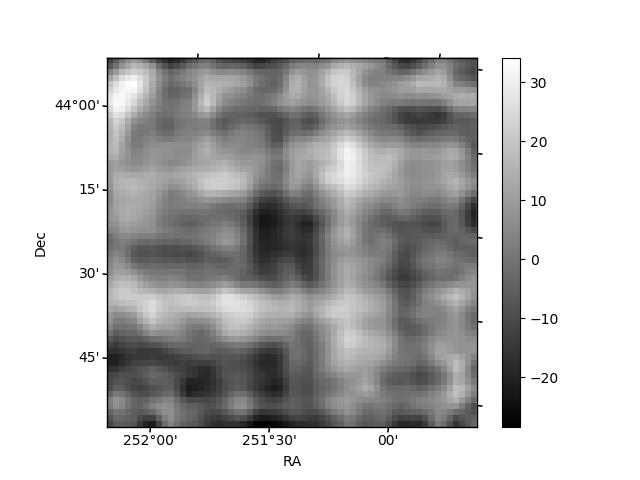
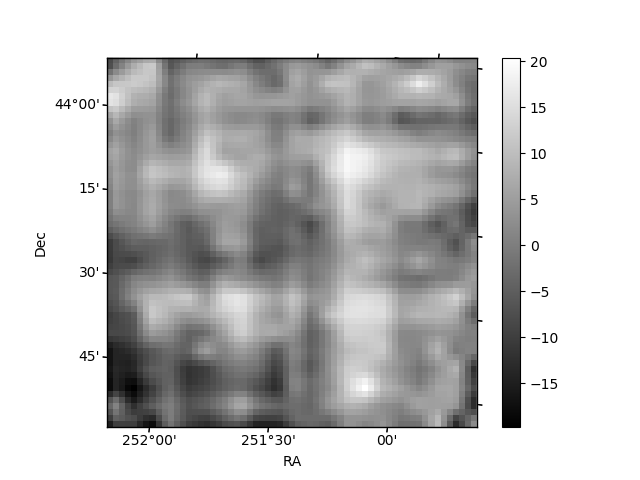
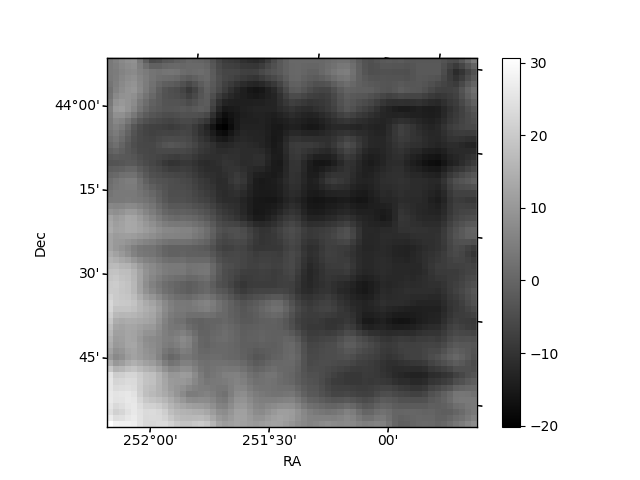
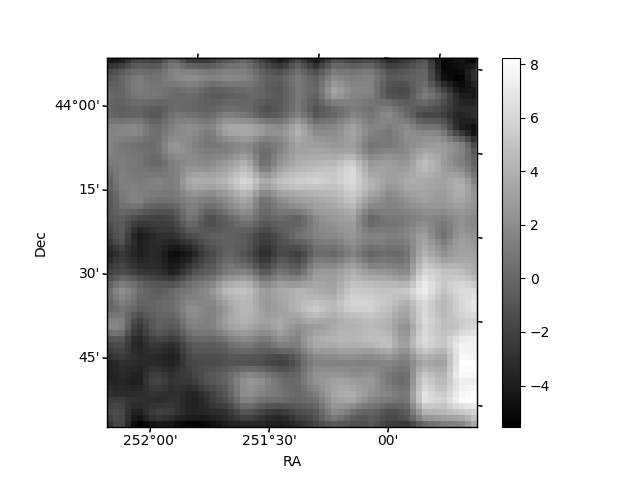
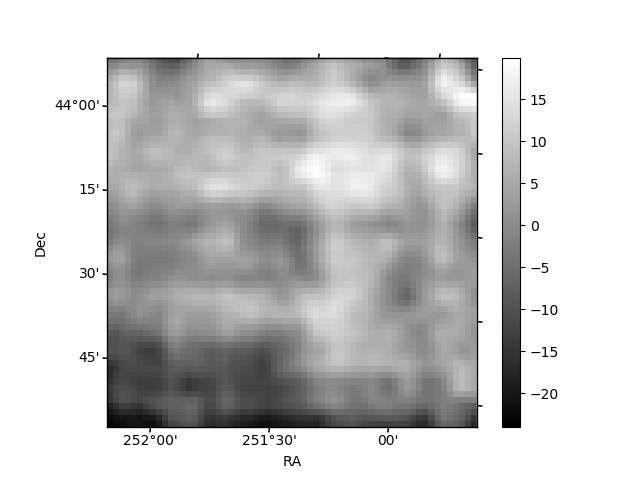
Histogram calculated using DETX and DETY for each event in the final _common_clean file
| Quadrant A | 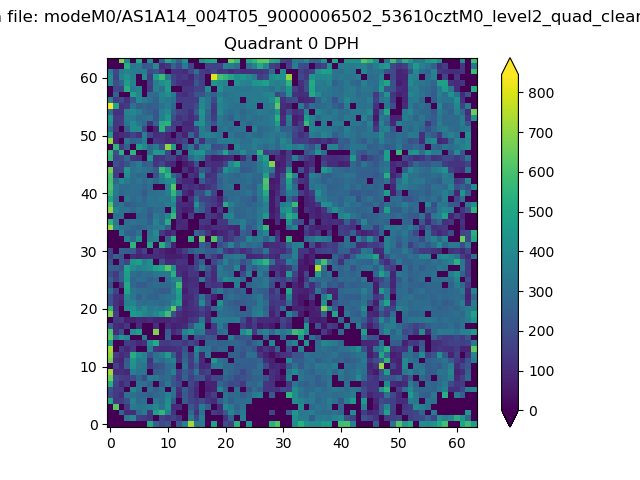 |
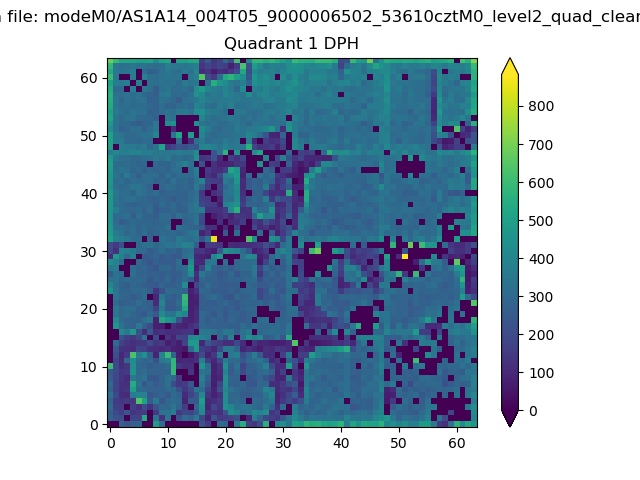 |
Quadrant B |
|---|---|---|---|
| Quadrant D | 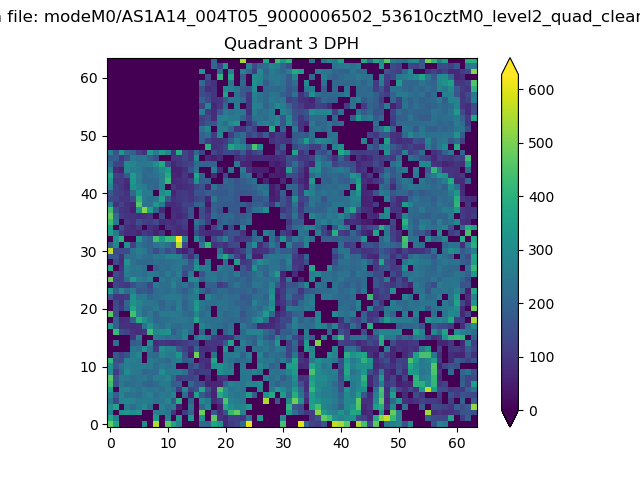 |
 |
Quadrant C |
| Plot type | Count rate plots | Images |
|---|---|---|
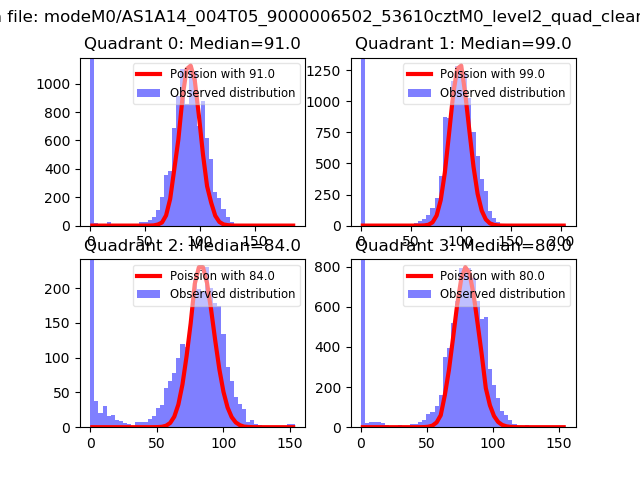
| Comparison with Poisson distribution Blue bars denote a histogram of data divided into 1 sec bins. Red curve is a Poisson curve with rate = median count rate of data. |
 |
 |
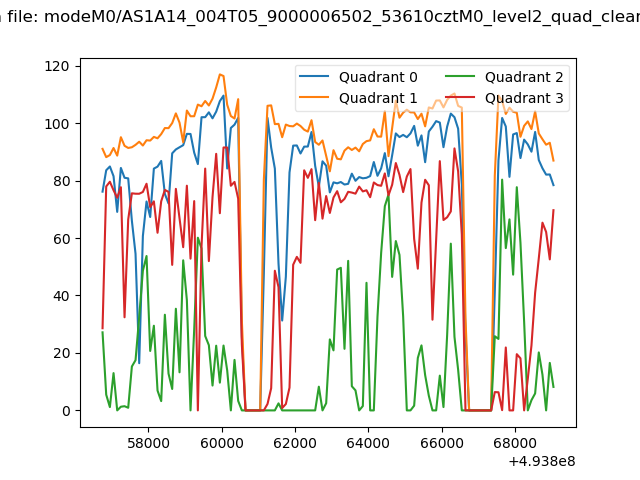
| Quadrant-wise count rates Data is divided into 100 sec bins |
 |
|
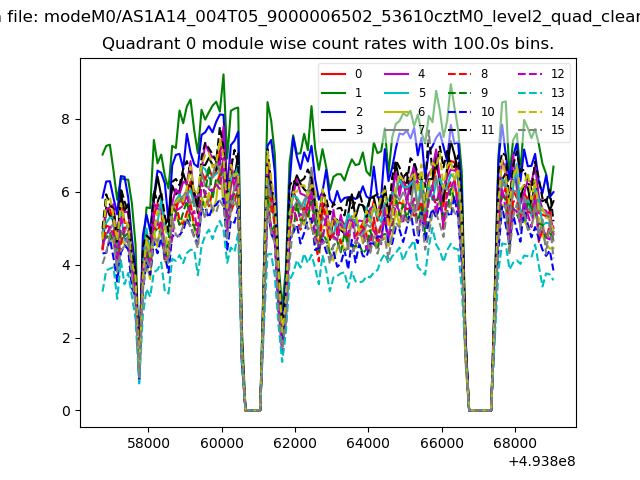
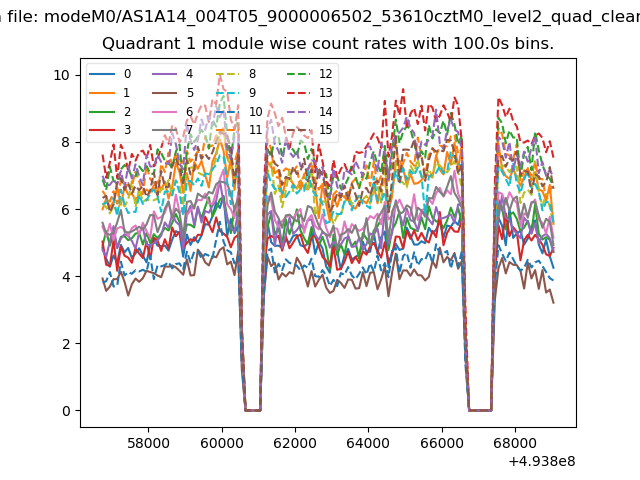
| Module-wise count rates for Quadrant A Data is divided into 100 sec bins |
 |
 |
| Module-wise count rates for Quadrant B Data is divided into 100 sec bins |
 |
 |
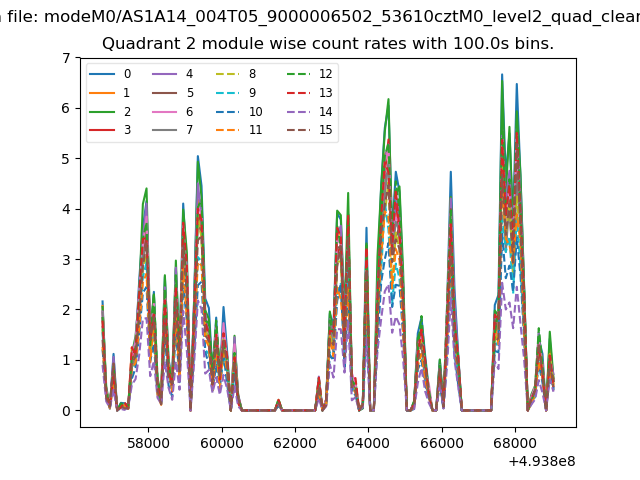
| Module-wise count rates for Quadrant C Data is divided into 100 sec bins |
 |
 |
| Module-wise count rates for Quadrant D Data is divided into 100 sec bins |
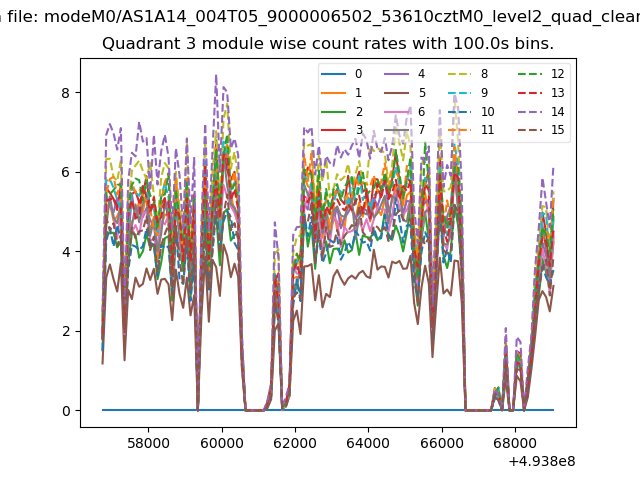 |
 |
| Parameter | Plot |
|---|---|
| CZT HV Monitor | 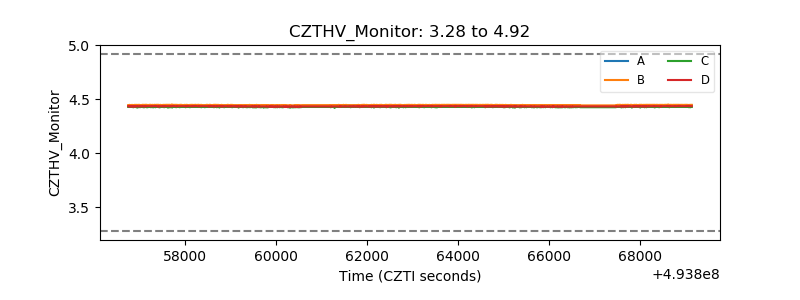 |
| D_VDD | 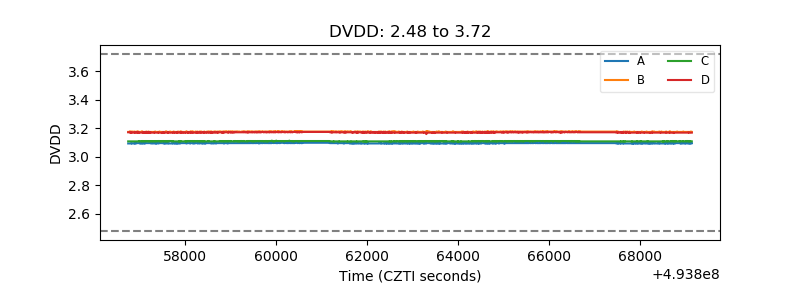 |
| Temperature 1 | 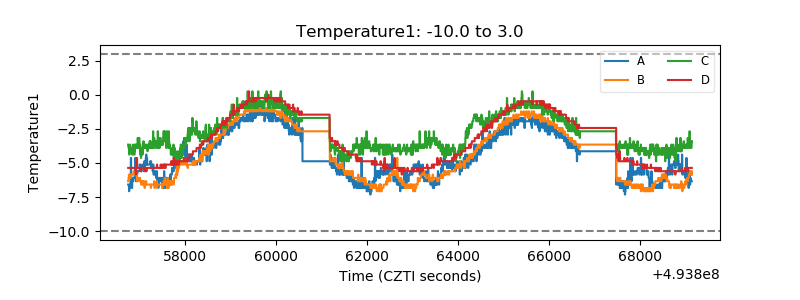 |
| Veto HV Monitor |  |
| Veto LLD | 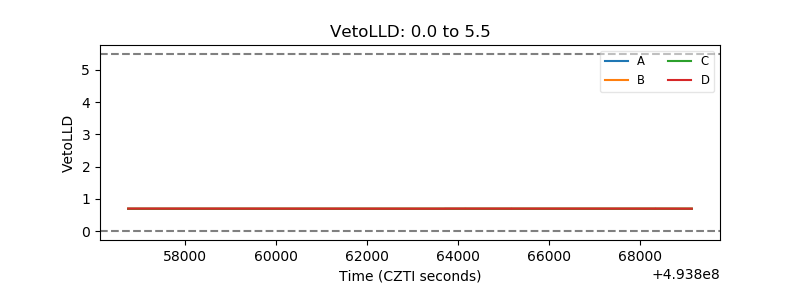 |
| Alpha Counter | 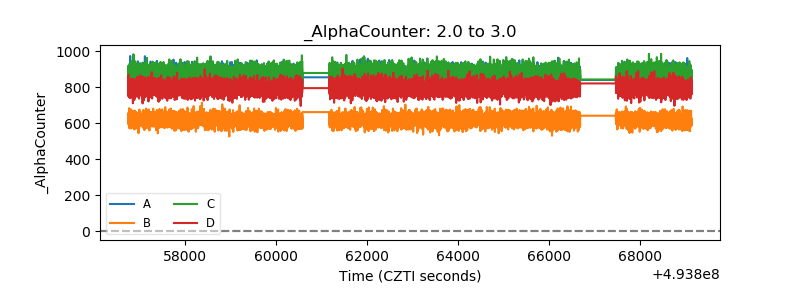 |
| _CPM_Rate | 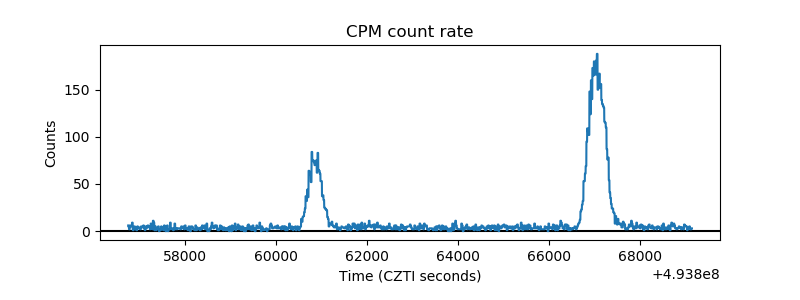 |
| CZT Counter | 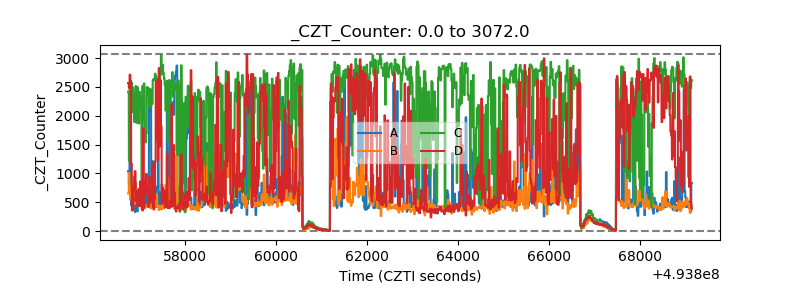 |
| +2.5 Volts monitor |  |
| +5 Volts monitor |  |
| _ROLL_ROT | 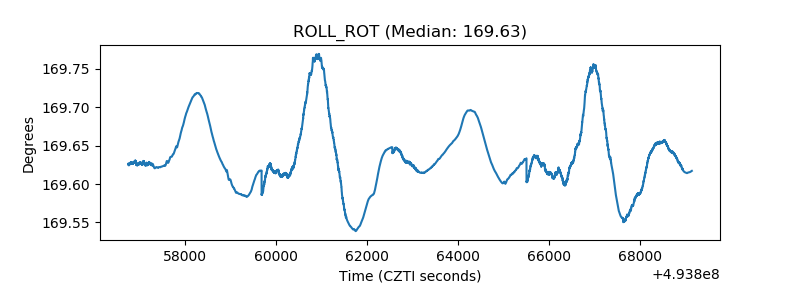 |
| _Roll_DEC | 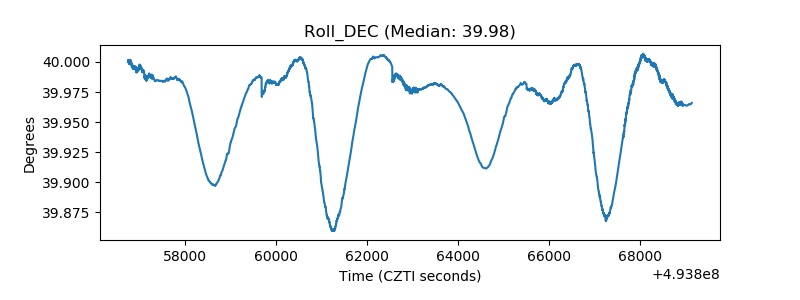 |
| _Roll_RA | 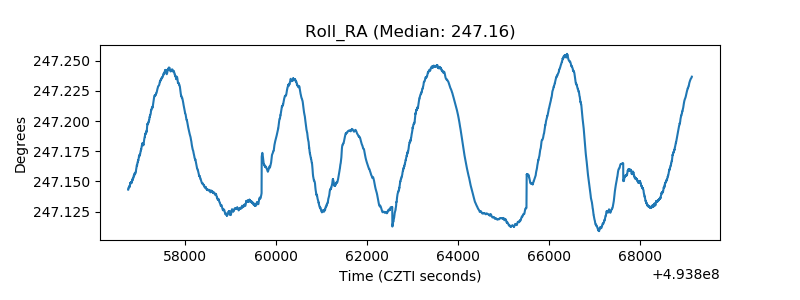 |
| Veto Counter | 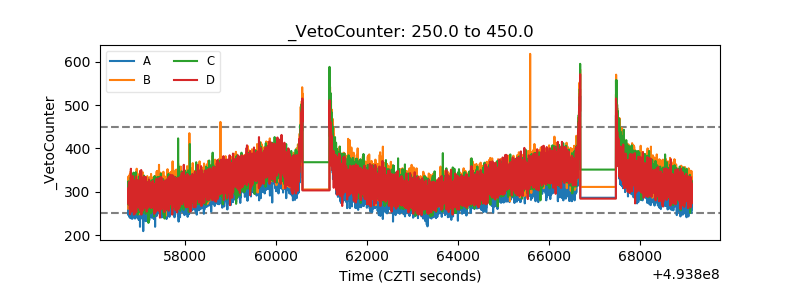 |