| Param | Original file | Final file |
|---|---|---|
| Filename | modeM0/AS1A14_004T05_9000006502_53611cztM0_level2.fits | modeM0/AS1A14_004T05_9000006502_53611cztM0_level2_quad_clean.evt |
| Size (bytes) | 888,102,720 | 64,146,240 |
| Size | 847.0 MB | 61.2 MB |
| Events in quadrant A | 4,942,653 | 535,206 |
| Events in quadrant B | 3,497,032 | 608,005 |
| Events in quadrant C | 14,590,403 | 34,763 |
| Events in quadrant D | 9,371,351 | 337,326 |
| Mode M9 | |||
|---|---|---|---|
| Quadrant | BADHDUFLAG | Total packets | Discarded packets |
| A | 0 | 9 | 0 |
| B | 0 | 9 | 0 |
| C | 0 | 9 | 0 |
| D | 0 | 9 | 0 |
| Mode SS | |||
|---|---|---|---|
| Quadrant | BADHDUFLAG | Total packets | Discarded packets |
| A | 0 | 126 | 0 |
| B | 0 | 126 | 0 |
| C | 0 | 126 | 0 |
| D | 0 | 126 | 0 |
| Mode M0 | |||
|---|---|---|---|
| Quadrant | BADHDUFLAG | Total packets | Discarded packets |
| A | 0 | 18844 | 1 |
| B | 0 | 14647 | 3 |
| C | 0 | 47423 | 1 |
| D | 0 | 32057 | 1 |
| Quadrant | Total seconds | Saturated seconds | Saturation percentage |
|---|---|---|---|
| A | 6105 | 588 | 9.631450% |
| B | 6105 | 163 | 2.669943% |
| C | 6105 | 5808 | 95.135135% |
| D | 6105 | 2408 | 39.443079% |
Noise dominated data is calculated using 1-second bins in cleaned event files. If a bin has >2000 counts, and if more than 50% of those come from <1% of pixels, then it is considered to be noise-dominated and hence unusable.
| Quadrant | # 1 sec bins | Bins with >0 counts | Bins with >2000 counts | High rate bins dominated by noise | Noise dominated (total time) | Noise dominated (detector-on time) | Marked lightcurve |
|---|---|---|---|---|---|---|---|
| A | 7018 | 6098 | 496 | 496 | 7.07% | 8.13% | 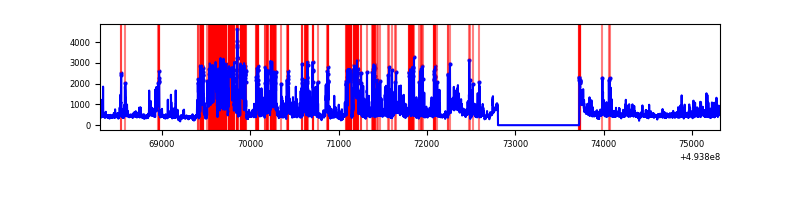 |
| B | 7018 | 6098 | 82 | 82 | 1.17% | 1.34% | 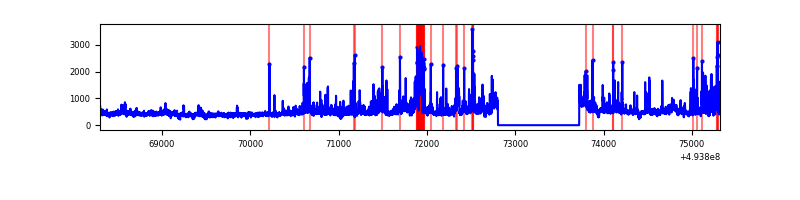 |
| C | 7017 | 6079 | 4961 | 4961 | 70.70% | 81.61% | 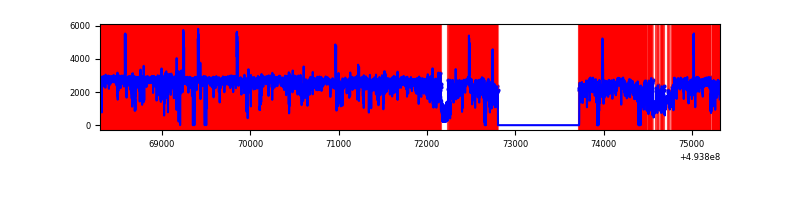 |
| D | 7018 | 6097 | 2313 | 2313 | 32.96% | 37.94% | 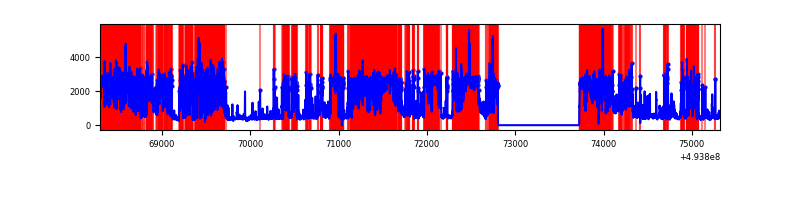 |
Top three noisy pixels from each quadrant. If the there are fewer than three noisy pixels in the level2.evt file, extra rows are filled as -1
| Pixel properties | Quadrant properties | ||||||
|---|---|---|---|---|---|---|---|
| Quadrant | DetID | PixID | Counts | Sigma | Mean | Median | Sigma |
| A | 3 | 78 | 1345452 | 8556.42 | 637 | 621 | 157.2 |
| A | 15 | 174 | 308535 | 1959.09 | 637 | 621 | 157.2 |
| A | 8 | 249 | 247035 | 1567.8 | 637 | 621 | 157.2 |
| B | 5 | 172 | 190259 | 1354.17 | 647 | 622 | 140.0 |
| B | 0 | 171 | 182975 | 1302.16 | 647 | 622 | 140.0 |
| B | 2 | 249 | 154428 | 1098.31 | 647 | 622 | 140.0 |
| C | 1 | 241 | 7677891 | 125784.77 | 217 | 217 | 61.0 |
| C | 1 | 3 | 4220471 | 69141.21 | 217 | 217 | 61.0 |
| C | 15 | 224 | 1257217 | 20593.67 | 217 | 217 | 61.0 |
| D | 8 | 176 | 6302988 | 43206.46 | 503 | 479 | 145.9 |
| D | 13 | 153 | 503395 | 3447.71 | 503 | 479 | 145.9 |
| D | 3 | 12 | 147157 | 1005.54 | 503 | 479 | 145.9 |
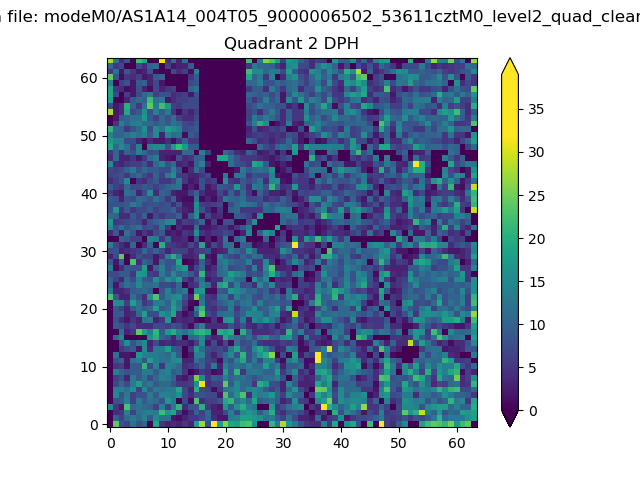
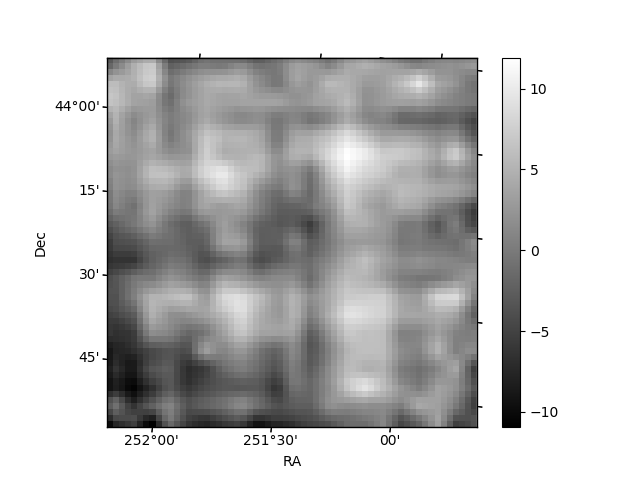
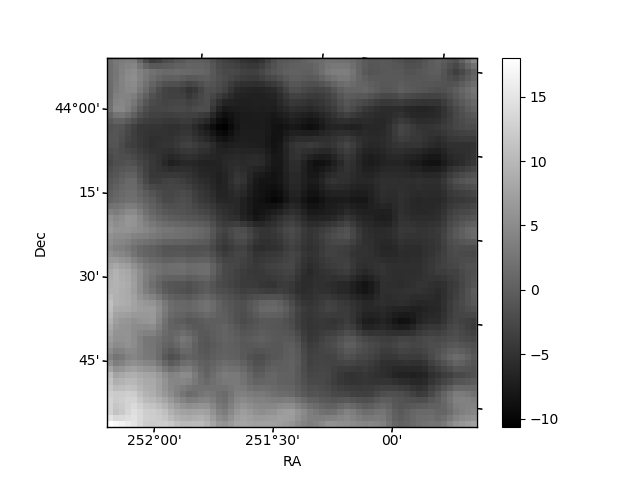
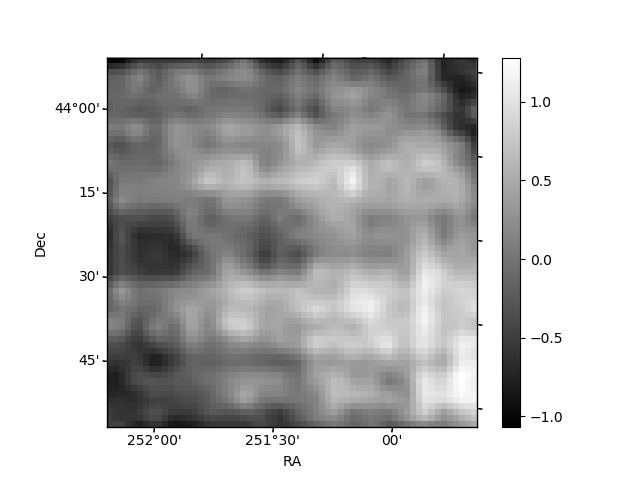
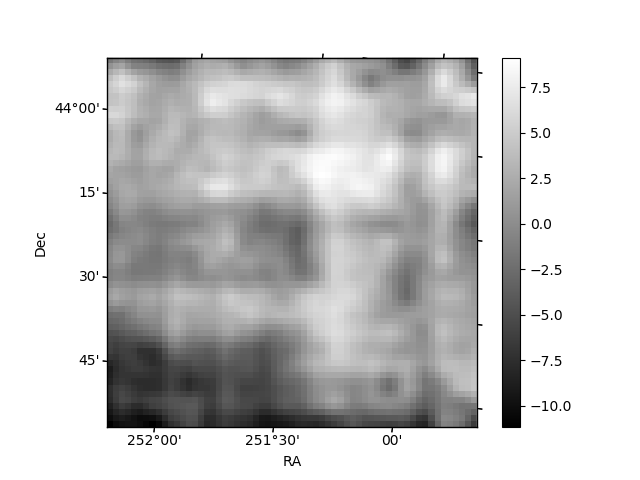
Histogram calculated using DETX and DETY for each event in the final _common_clean file
| Quadrant A | 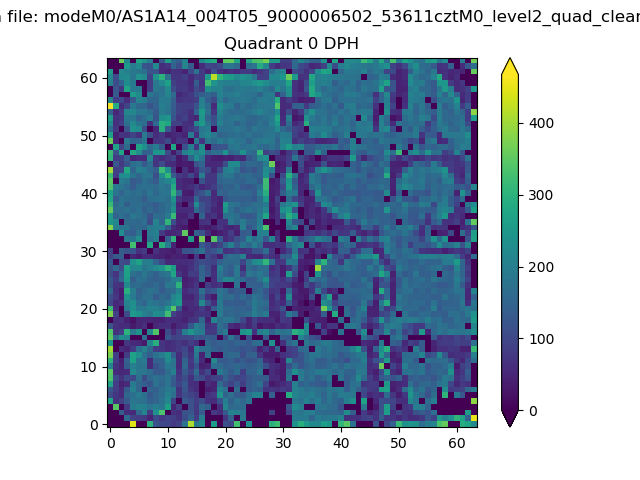 |
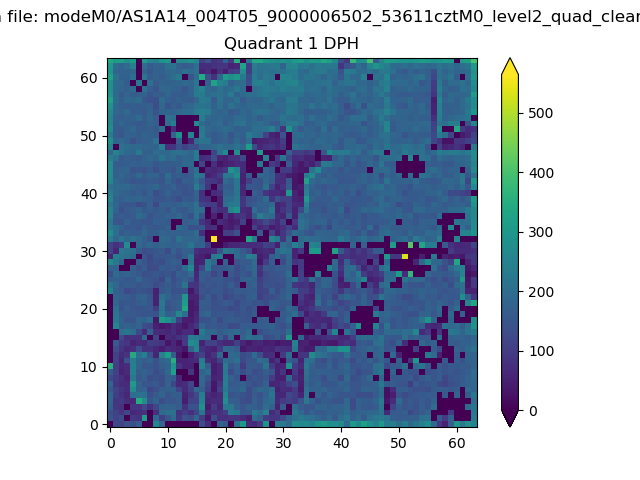 |
Quadrant B |
|---|---|---|---|
| Quadrant D | 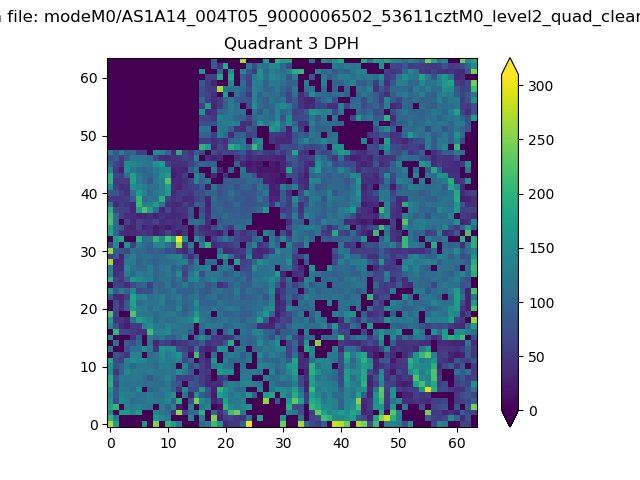 |
 |
Quadrant C |
| Plot type | Count rate plots | Images |
|---|---|---|
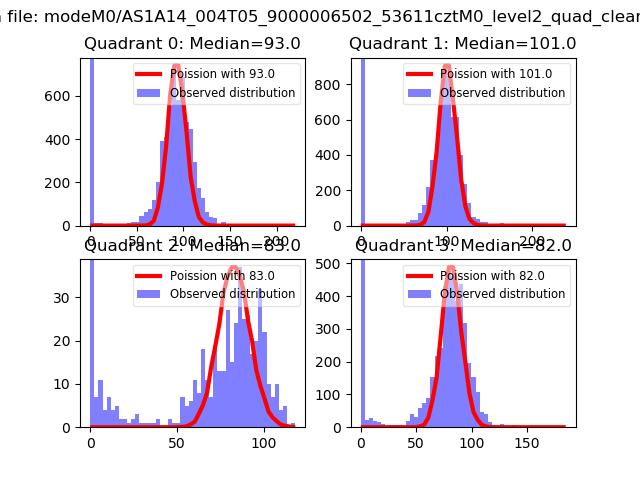
| Comparison with Poisson distribution Blue bars denote a histogram of data divided into 1 sec bins. Red curve is a Poisson curve with rate = median count rate of data. |
 |
 |
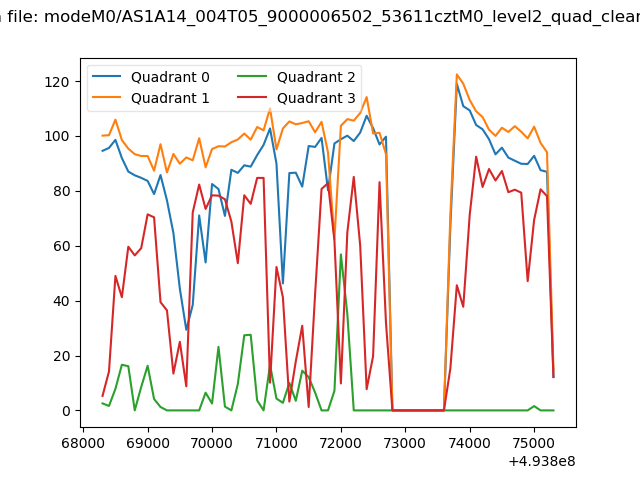
| Quadrant-wise count rates Data is divided into 100 sec bins |
 |
|
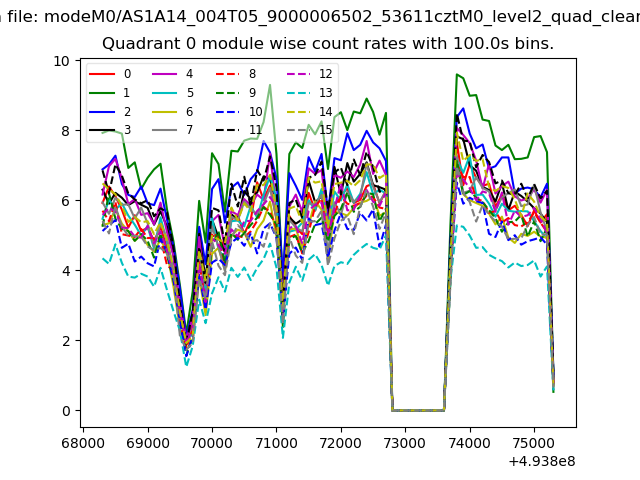
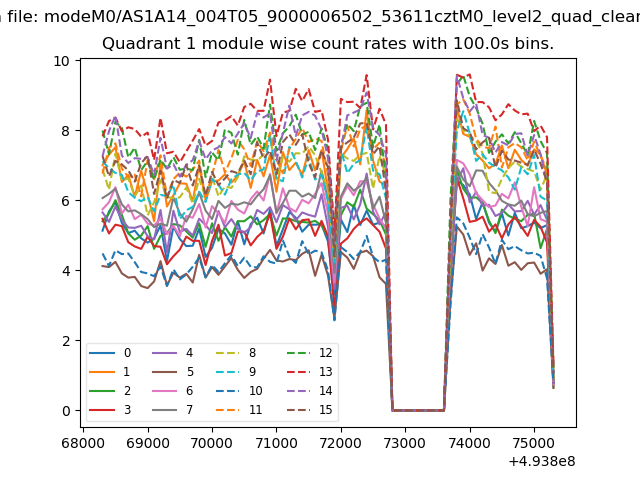
| Module-wise count rates for Quadrant A Data is divided into 100 sec bins |
 |
 |
| Module-wise count rates for Quadrant B Data is divided into 100 sec bins |
 |
 |
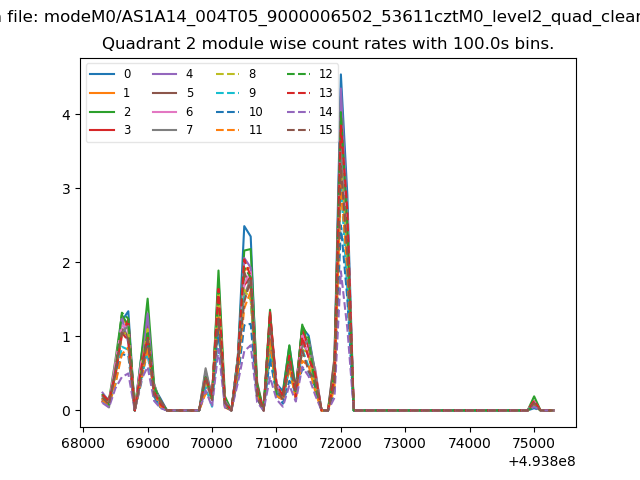
| Module-wise count rates for Quadrant C Data is divided into 100 sec bins |
 |
 |
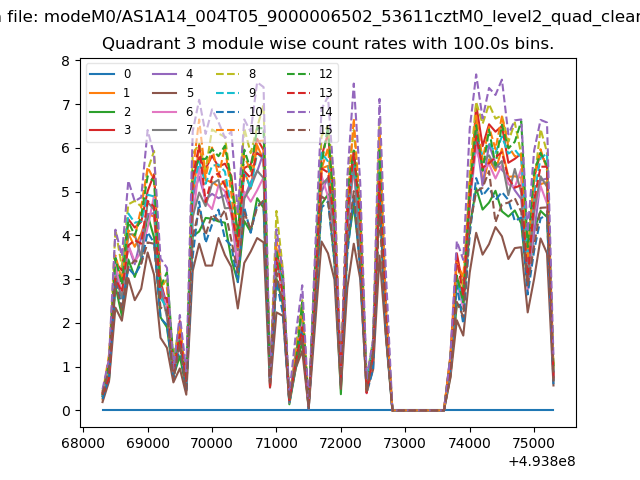
| Module-wise count rates for Quadrant D Data is divided into 100 sec bins |
 |
 |
| Parameter | Plot |
|---|---|
| CZT HV Monitor | 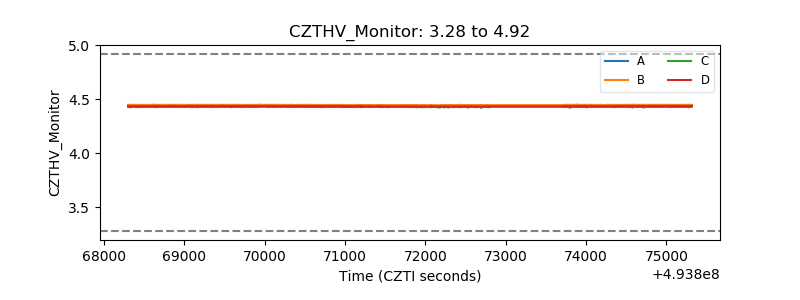 |
| D_VDD | 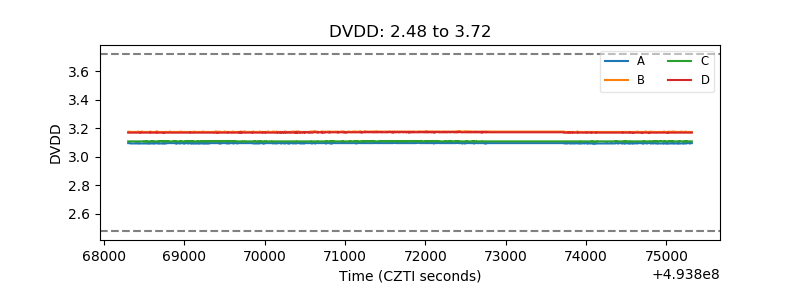 |
| Temperature 1 | 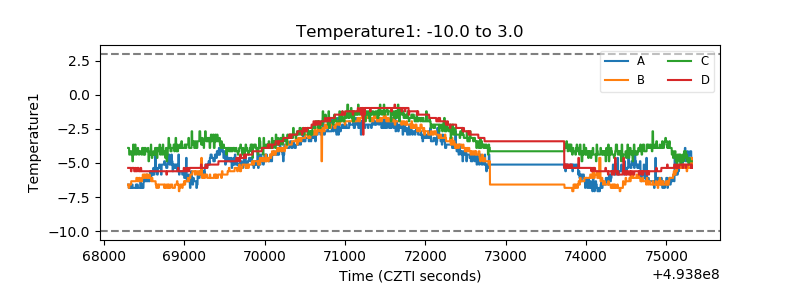 |
| Veto HV Monitor | 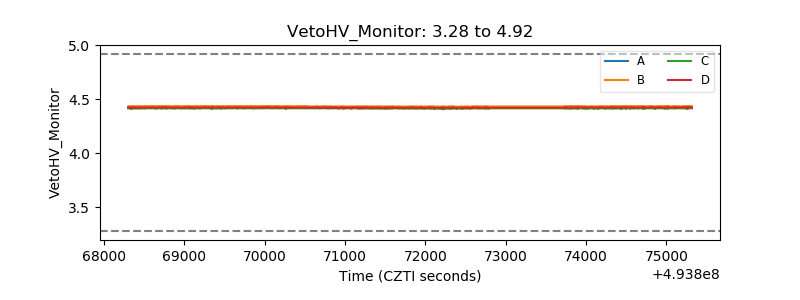 |
| Veto LLD | 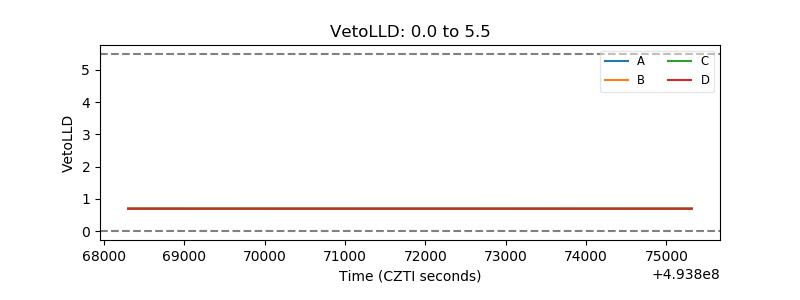 |
| Alpha Counter | 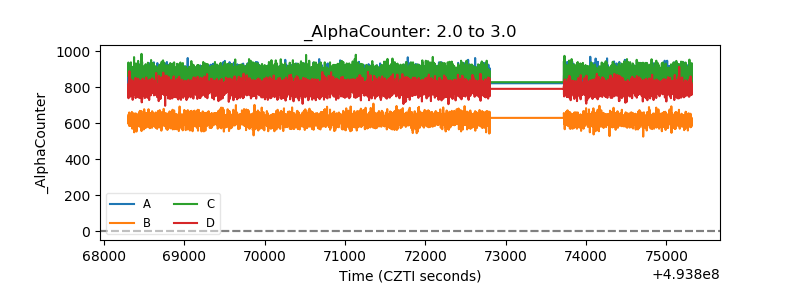 |
| _CPM_Rate | 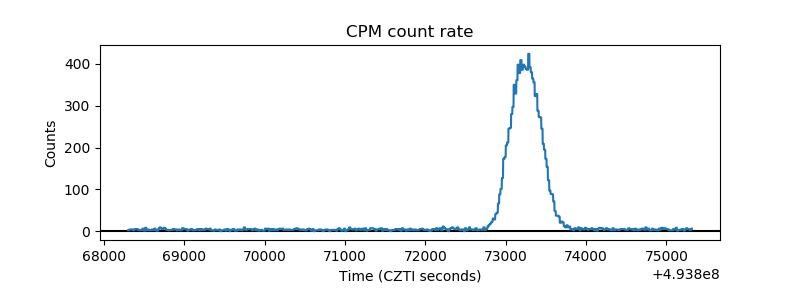 |
| CZT Counter | 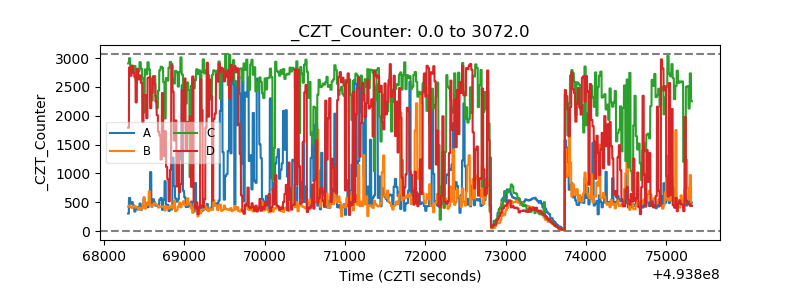 |
| +2.5 Volts monitor |  |
| +5 Volts monitor |  |
| _ROLL_ROT | 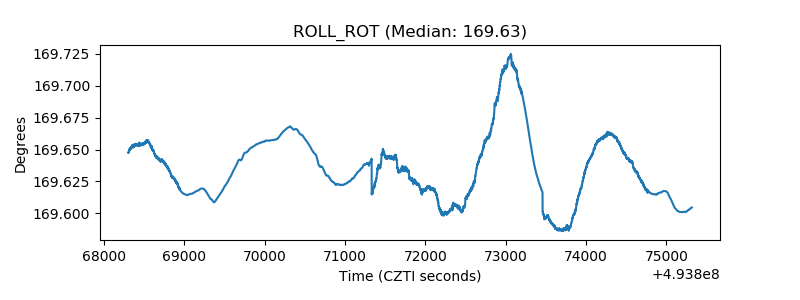 |
| _Roll_DEC | 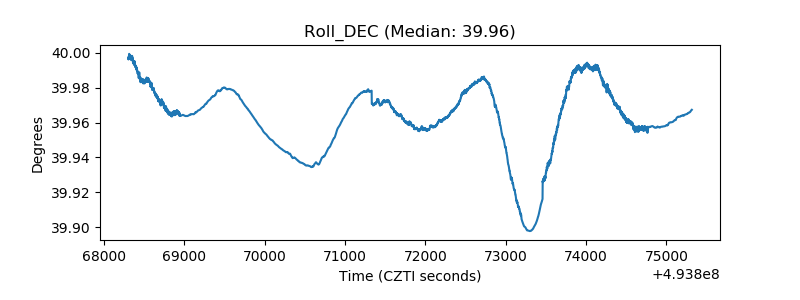 |
| _Roll_RA | 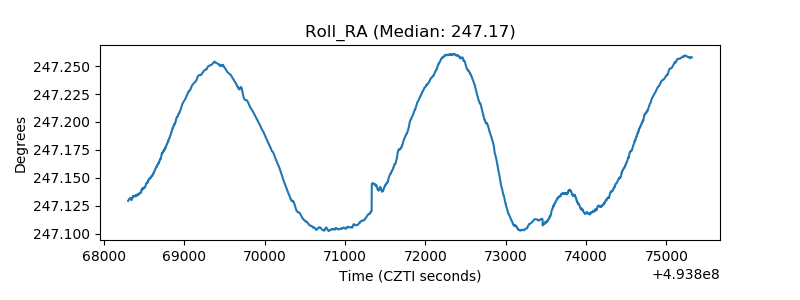 |
| Veto Counter | 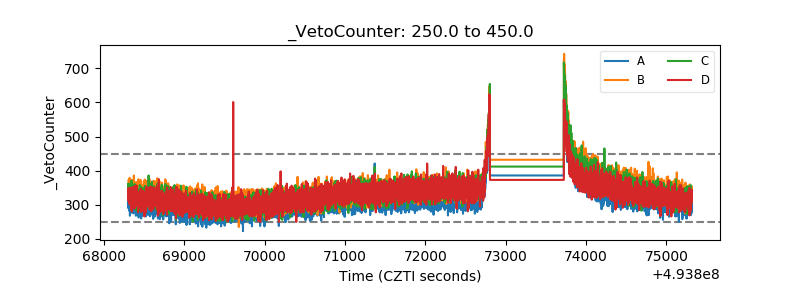 |