| Param | Original file | Final file |
|---|---|---|
| Filename | modeM0/AS1A14_004T05_9000006502_53613cztM0_level2.fits | modeM0/AS1A14_004T05_9000006502_53613cztM0_level2_quad_clean.evt |
| Size (bytes) | 920,741,760 | 74,306,880 |
| Size | 878.1 MB | 70.9 MB |
| Events in quadrant A | 7,839,462 | 473,183 |
| Events in quadrant B | 4,747,268 | 669,047 |
| Events in quadrant C | 14,232,316 | 131,183 |
| Events in quadrant D | 6,755,111 | 517,767 |
| Mode M9 | |||
|---|---|---|---|
| Quadrant | BADHDUFLAG | Total packets | Discarded packets |
| A | 0 | 10 | 0 |
| B | 0 | 10 | 0 |
| C | 0 | 10 | 0 |
| D | 0 | 10 | 0 |
| Mode SS | |||
|---|---|---|---|
| Quadrant | BADHDUFLAG | Total packets | Discarded packets |
| A | 0 | 134 | 0 |
| B | 0 | 134 | 0 |
| C | 0 | 134 | 0 |
| D | 0 | 134 | 0 |
| Mode M0 | |||
|---|---|---|---|
| Quadrant | BADHDUFLAG | Total packets | Discarded packets |
| A | 0 | 27679 | 1 |
| B | 0 | 18500 | 1 |
| C | 0 | 46748 | 1 |
| D | 0 | 24574 | 1 |
| Quadrant | Total seconds | Saturated seconds | Saturation percentage |
|---|---|---|---|
| A | 6573 | 1831 | 27.856382% |
| B | 6572 | 295 | 4.488740% |
| C | 6572 | 5352 | 81.436397% |
| D | 6572 | 900 | 13.694461% |
Noise dominated data is calculated using 1-second bins in cleaned event files. If a bin has >2000 counts, and if more than 50% of those come from <1% of pixels, then it is considered to be noise-dominated and hence unusable.
| Quadrant | # 1 sec bins | Bins with >0 counts | Bins with >2000 counts | High rate bins dominated by noise | Noise dominated (total time) | Noise dominated (detector-on time) | Marked lightcurve |
|---|---|---|---|---|---|---|---|
| A | 7613 | 6571 | 1708 | 1708 | 22.44% | 25.99% | 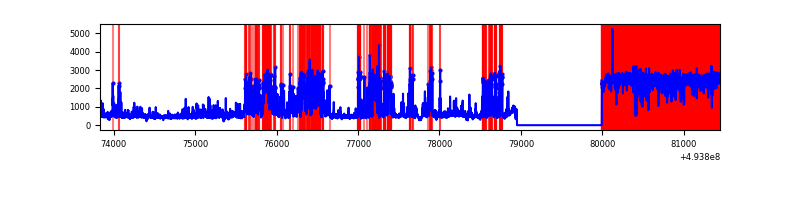 |
| B | 7613 | 6571 | 185 | 185 | 2.43% | 2.82% | 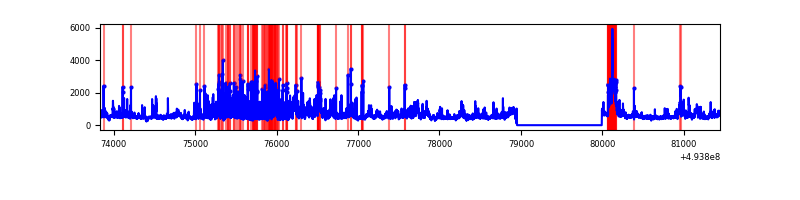 |
| C | 7613 | 6540 | 4503 | 4503 | 59.15% | 68.85% | 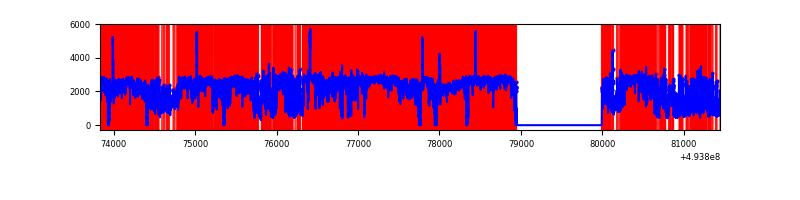 |
| D | 7613 | 6571 | 909 | 909 | 11.94% | 13.83% | 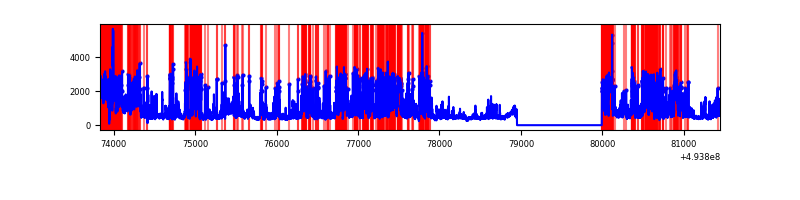 |
Top three noisy pixels from each quadrant. If the there are fewer than three noisy pixels in the level2.evt file, extra rows are filled as -1
| Pixel properties | Quadrant properties | ||||||
|---|---|---|---|---|---|---|---|
| Quadrant | DetID | PixID | Counts | Sigma | Mean | Median | Sigma |
| A | 4 | 95 | 2476020 | 15852.0 | 630 | 616 | 156.2 |
| A | 3 | 78 | 1484798 | 9504.41 | 630 | 616 | 156.2 |
| A | 15 | 174 | 674717 | 4316.81 | 630 | 616 | 156.2 |
| B | 2 | 249 | 800995 | 5288.99 | 709 | 682 | 151.3 |
| B | 10 | 254 | 490089 | 3234.32 | 709 | 682 | 151.3 |
| B | 5 | 172 | 326852 | 2155.55 | 709 | 682 | 151.3 |
| C | 1 | 3 | 7314537 | 101110.97 | 261 | 260 | 72.3 |
| C | 1 | 241 | 4101085 | 56688.91 | 261 | 260 | 72.3 |
| C | 15 | 224 | 921794 | 12739.08 | 261 | 260 | 72.3 |
| D | 8 | 176 | 2988131 | 15414.67 | 668 | 637 | 193.8 |
| D | 13 | 153 | 358041 | 1844.11 | 668 | 637 | 193.8 |
| D | 2 | 120 | 211445 | 1087.71 | 668 | 637 | 193.8 |
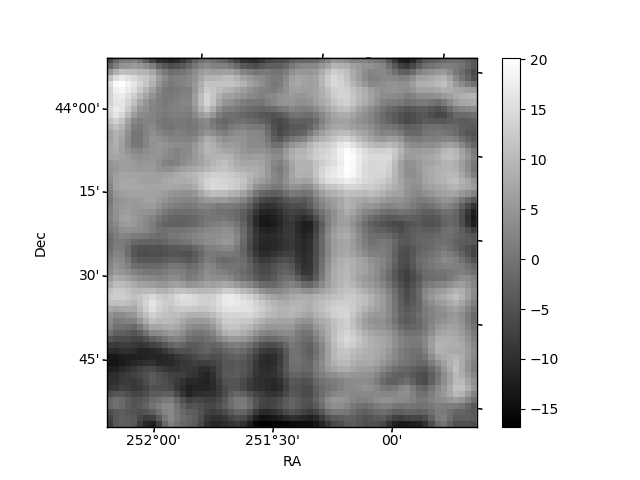
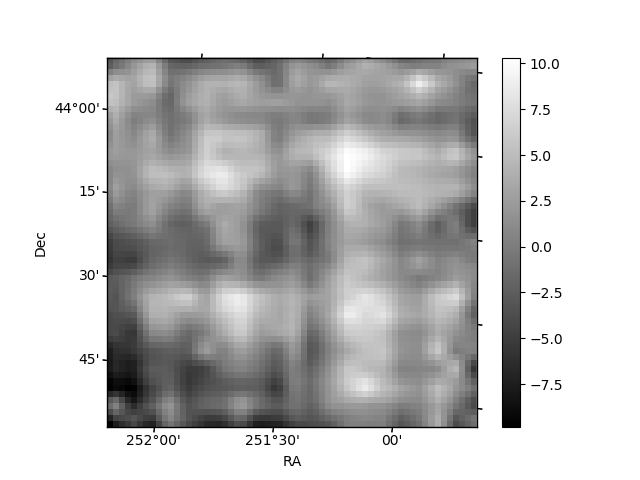
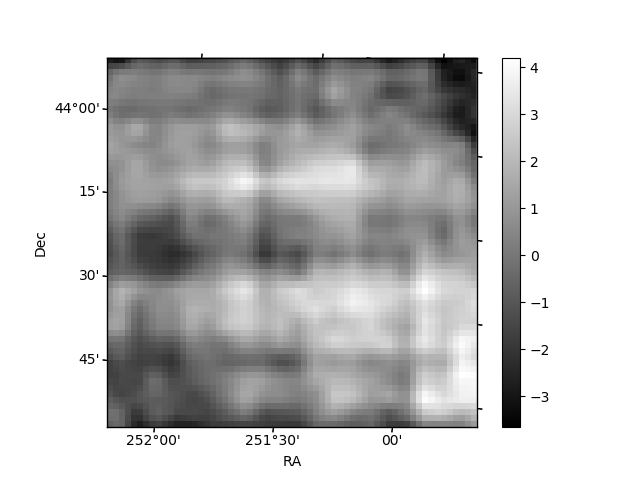
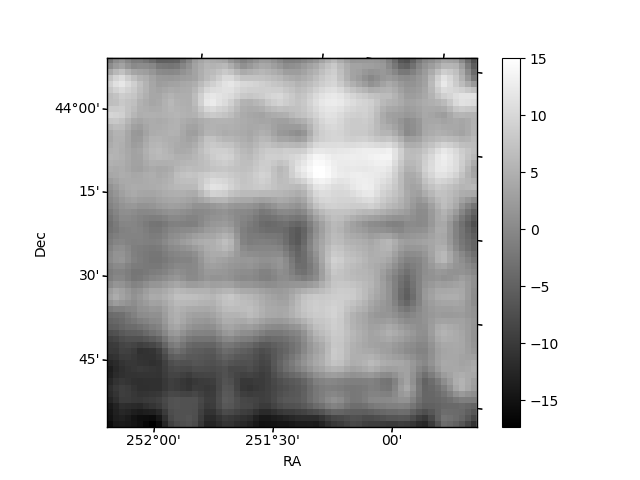
Histogram calculated using DETX and DETY for each event in the final _common_clean file
| Quadrant A | 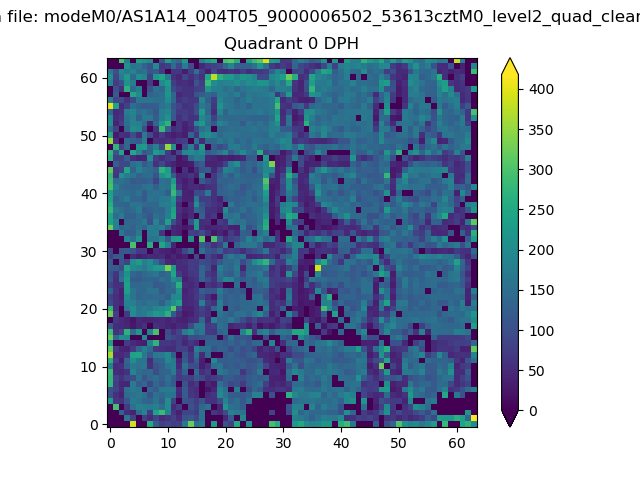 |
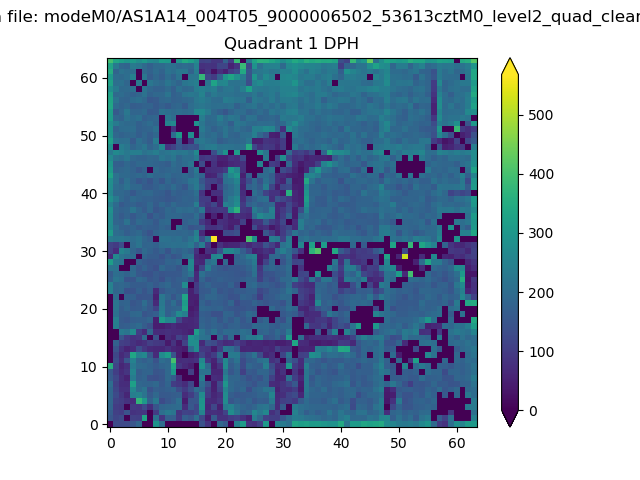 |
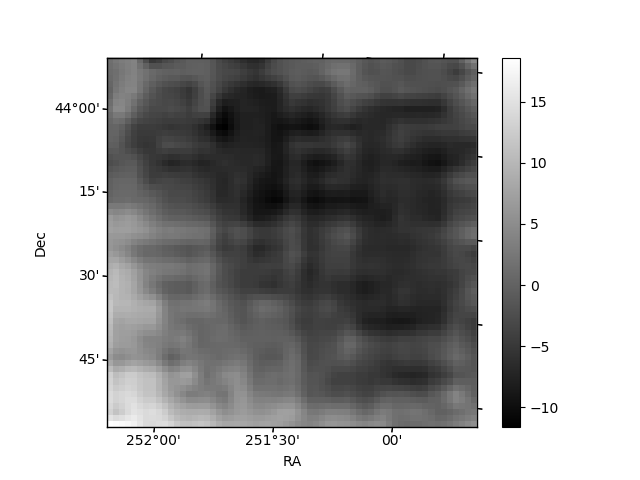
Quadrant B |
|---|---|---|---|
| Quadrant D | 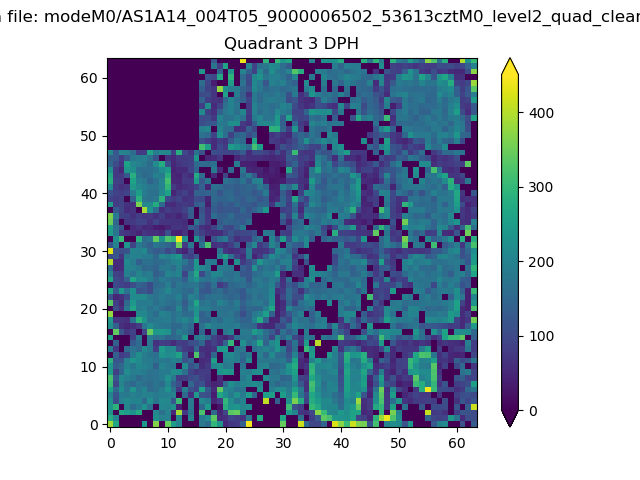 |
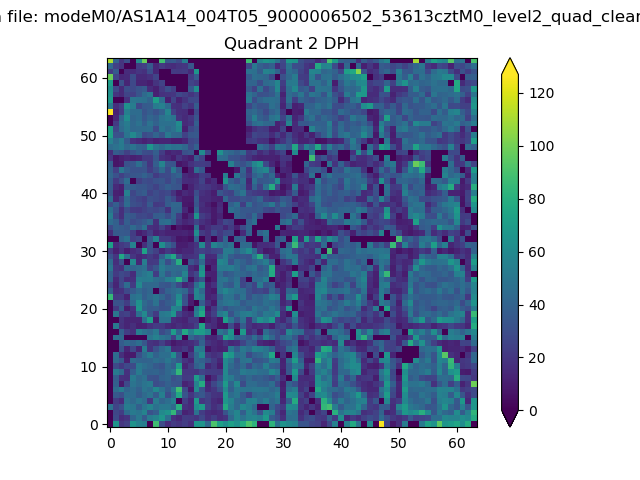 |
Quadrant C |
| Plot type | Count rate plots | Images |
|---|---|---|
| Comparison with Poisson distribution Blue bars denote a histogram of data divided into 1 sec bins. Red curve is a Poisson curve with rate = median count rate of data. |
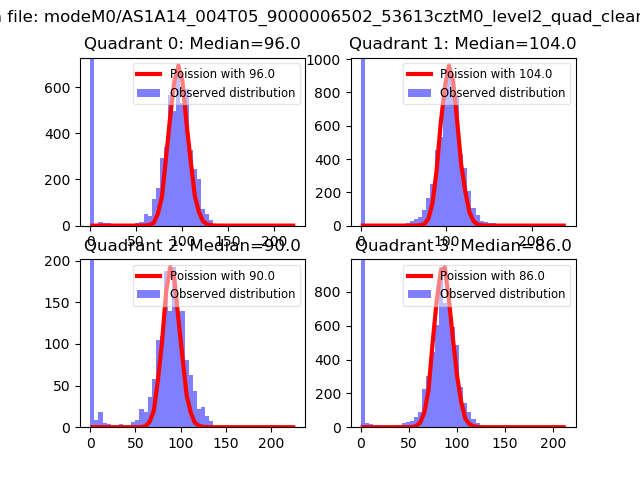 |
 |
| Quadrant-wise count rates Data is divided into 100 sec bins |
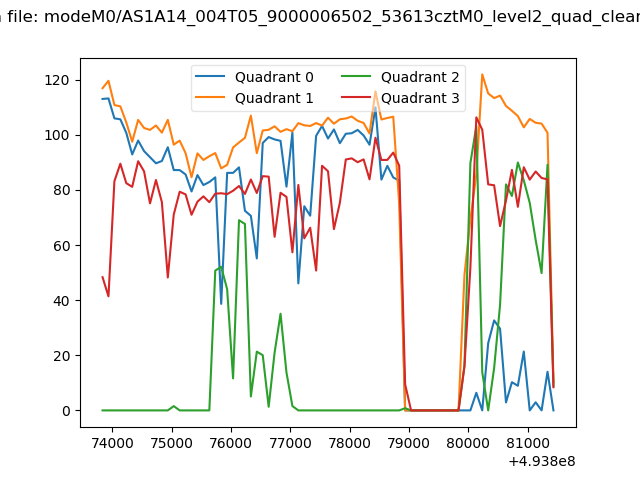 |
|
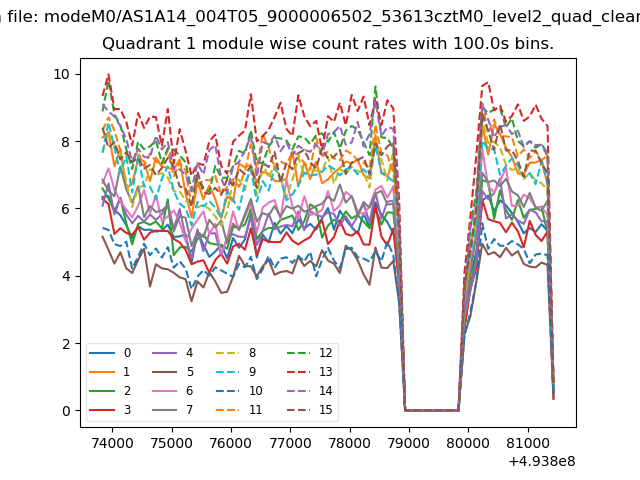
| Module-wise count rates for Quadrant A Data is divided into 100 sec bins |
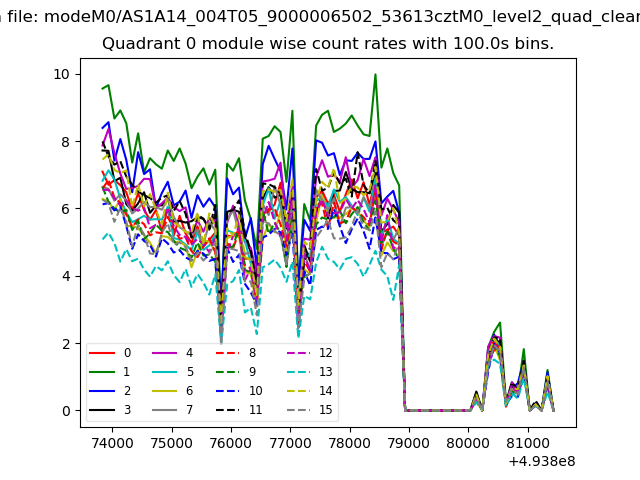 |
 |
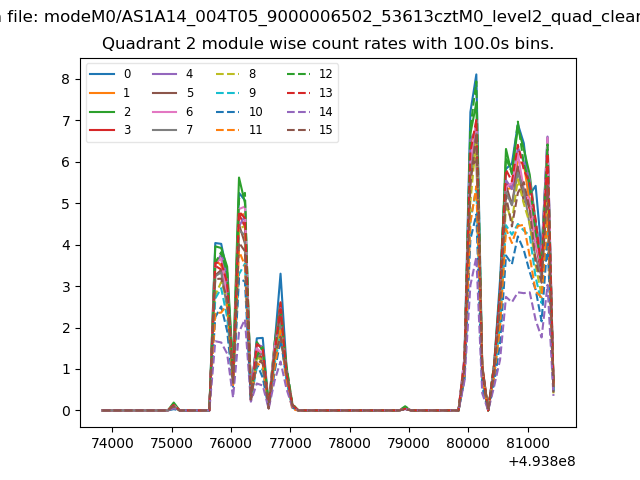
| Module-wise count rates for Quadrant B Data is divided into 100 sec bins |
 |
 |
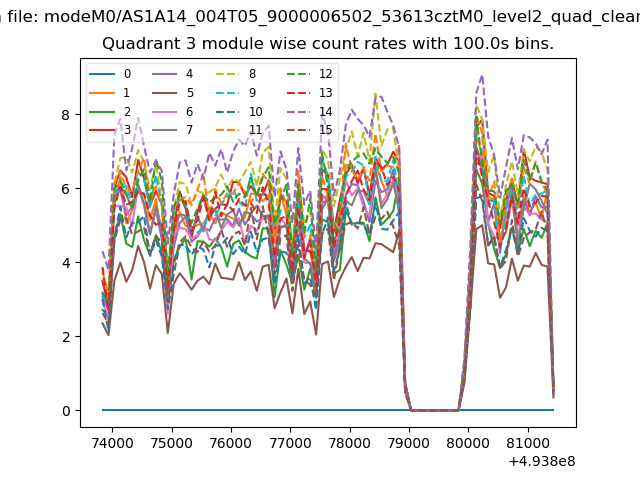
| Module-wise count rates for Quadrant C Data is divided into 100 sec bins |
 |
 |
| Module-wise count rates for Quadrant D Data is divided into 100 sec bins |
 |
 |
| Parameter | Plot |
|---|---|
| CZT HV Monitor | 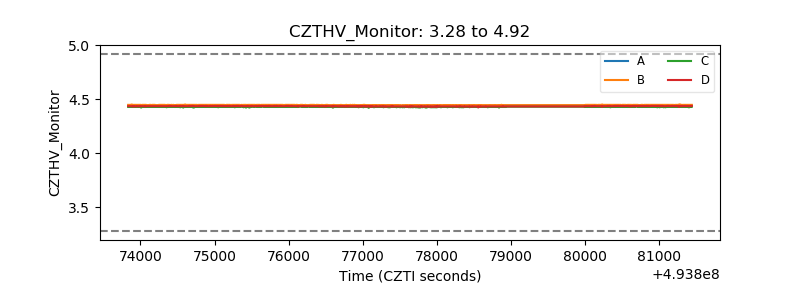 |
| D_VDD | 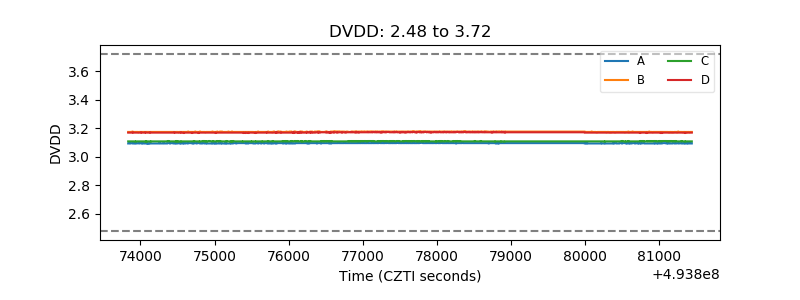 |
| Temperature 1 | 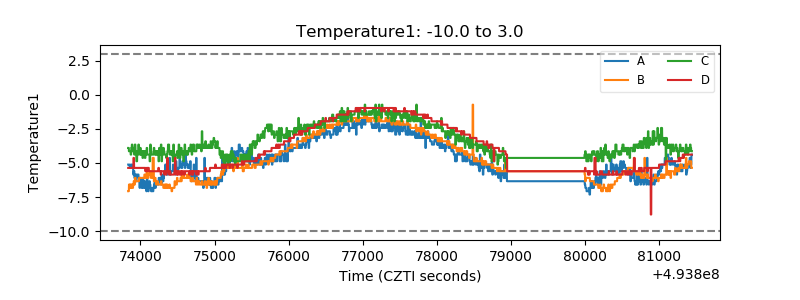 |
| Veto HV Monitor | 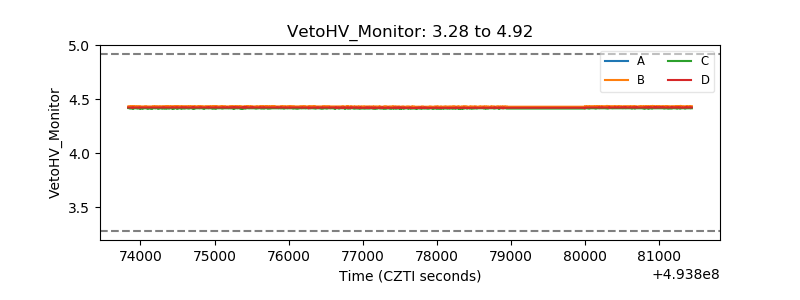 |
| Veto LLD | 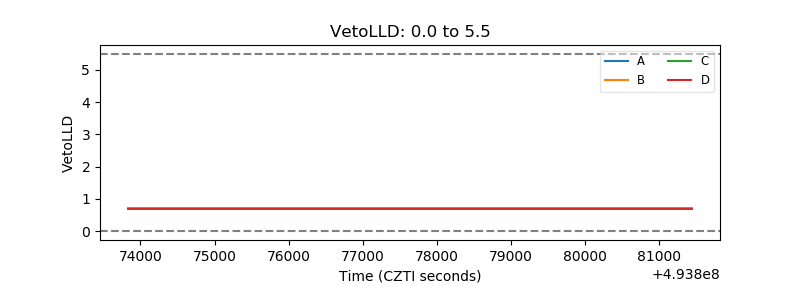 |
| Alpha Counter | 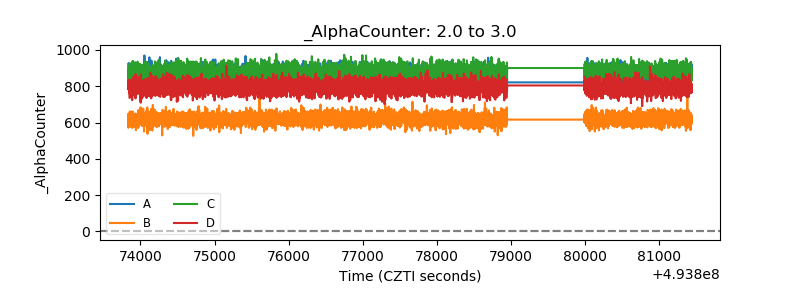 |
| _CPM_Rate | 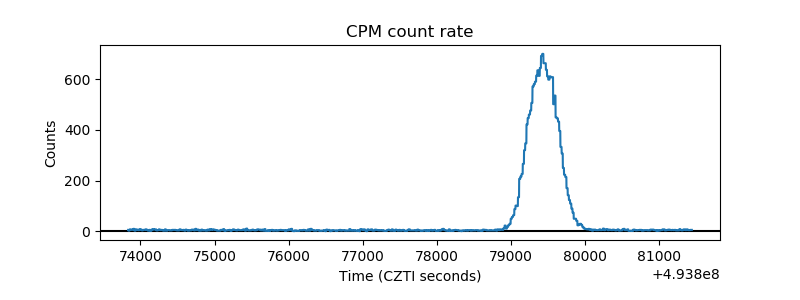 |
| CZT Counter | 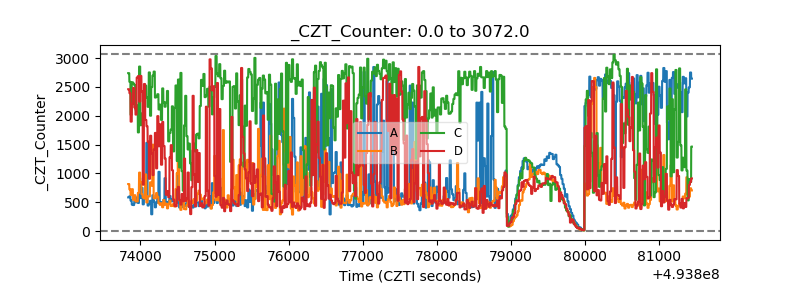 |
| +2.5 Volts monitor |  |
| +5 Volts monitor |  |
| _ROLL_ROT | 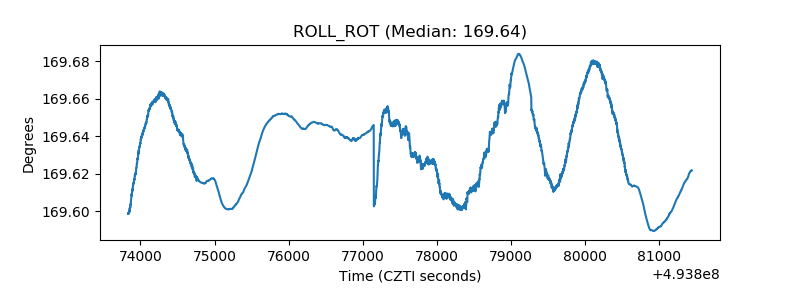 |
| _Roll_DEC | 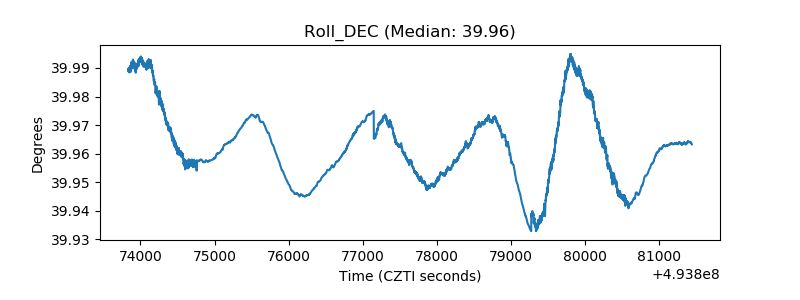 |
| _Roll_RA | 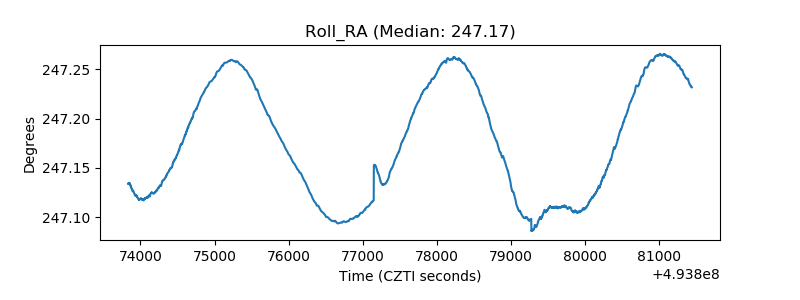 |
| Veto Counter | 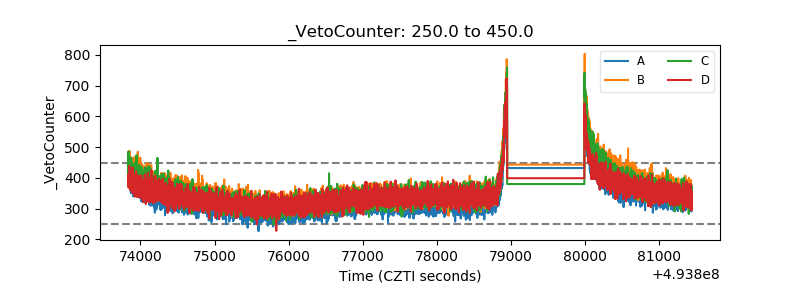 |