| Param | Original file | Final file |
|---|---|---|
| Filename | modeM0/AS1A14_004T05_9000006502_53614cztM0_level2.fits | modeM0/AS1A14_004T05_9000006502_53614cztM0_level2_quad_clean.evt |
| Size (bytes) | 1,022,440,320 | 71,536,320 |
| Size | 975.1 MB | 68.2 MB |
| Events in quadrant A | 13,404,173 | 195,704 |
| Events in quadrant B | 4,488,917 | 693,517 |
| Events in quadrant C | 13,339,035 | 272,054 |
| Events in quadrant D | 6,114,727 | 552,131 |
| Mode M9 | |||
|---|---|---|---|
| Quadrant | BADHDUFLAG | Total packets | Discarded packets |
| A | 0 | 16 | 0 |
| B | 0 | 16 | 0 |
| C | 0 | 17 | 0 |
| D | 0 | 17 | 0 |
| Mode SS | |||
|---|---|---|---|
| Quadrant | BADHDUFLAG | Total packets | Discarded packets |
| A | 0 | 132 | 0 |
| B | 0 | 132 | 0 |
| C | 0 | 132 | 0 |
| D | 0 | 132 | 0 |
| Mode M0 | |||
|---|---|---|---|
| Quadrant | BADHDUFLAG | Total packets | Discarded packets |
| A | 0 | 44265 | 2 |
| B | 0 | 17702 | 2 |
| C | 0 | 43905 | 6 |
| D | 0 | 22571 | 2 |
| Quadrant | Total seconds | Saturated seconds | Saturation percentage |
|---|---|---|---|
| A | 6484 | 4709 | 72.624923% |
| B | 6484 | 245 | 3.778532% |
| C | 6483 | 4005 | 61.776955% |
| D | 6483 | 647 | 9.979948% |
Noise dominated data is calculated using 1-second bins in cleaned event files. If a bin has >2000 counts, and if more than 50% of those come from <1% of pixels, then it is considered to be noise-dominated and hence unusable.
| Quadrant | # 1 sec bins | Bins with >0 counts | Bins with >2000 counts | High rate bins dominated by noise | Noise dominated (total time) | Noise dominated (detector-on time) | Marked lightcurve |
|---|---|---|---|---|---|---|---|
| A | 7625 | 6479 | 4430 | 4430 | 58.10% | 68.37% | 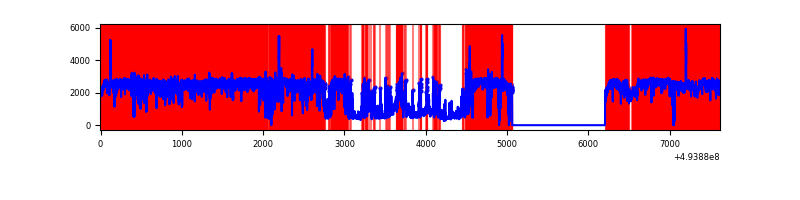 |
| B | 7626 | 6484 | 135 | 135 | 1.77% | 2.08% | 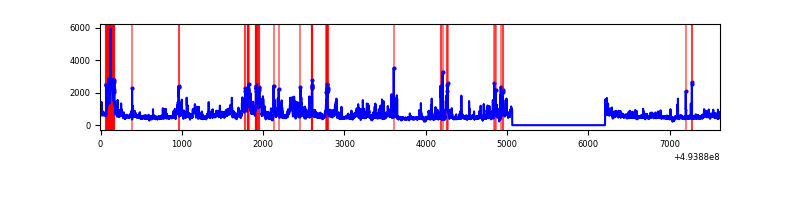 |
| C | 7624 | 6481 | 3793 | 3793 | 49.75% | 58.52% |  |
| D | 7625 | 6484 | 637 | 637 | 8.35% | 9.82% | 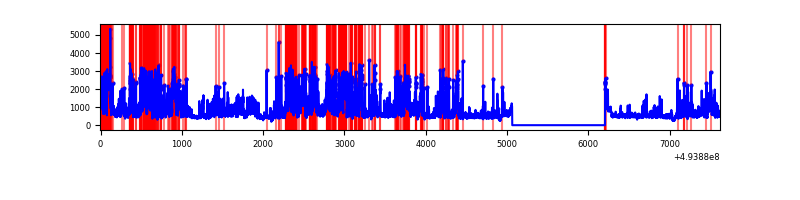 |
Top three noisy pixels from each quadrant. If the there are fewer than three noisy pixels in the level2.evt file, extra rows are filled as -1
| Pixel properties | Quadrant properties | ||||||
|---|---|---|---|---|---|---|---|
| Quadrant | DetID | PixID | Counts | Sigma | Mean | Median | Sigma |
| A | 4 | 95 | 6624216 | 63837.34 | 411 | 401 | 103.8 |
| A | 3 | 78 | 3995817 | 38506.02 | 411 | 401 | 103.8 |
| A | 15 | 174 | 428973 | 4130.38 | 411 | 401 | 103.8 |
| B | 10 | 254 | 952660 | 6192.2 | 723 | 698 | 153.7 |
| B | 5 | 172 | 370817 | 2407.5 | 723 | 698 | 153.7 |
| B | 0 | 213 | 88516 | 571.23 | 723 | 698 | 153.7 |
| C | 1 | 241 | 8160593 | 65399.11 | 457 | 453 | 124.8 |
| C | 15 | 224 | 1317719 | 10557.18 | 457 | 453 | 124.8 |
| C | 7 | 80 | 687391 | 5505.44 | 457 | 453 | 124.8 |
| D | 8 | 176 | 2535059 | 13078.21 | 685 | 654 | 193.8 |
| D | 10 | 172 | 203413 | 1046.29 | 685 | 654 | 193.8 |
| D | 13 | 153 | 132671 | 681.24 | 685 | 654 | 193.8 |
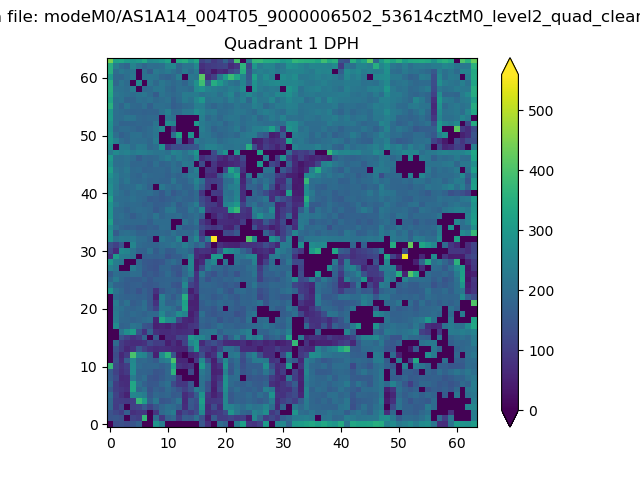
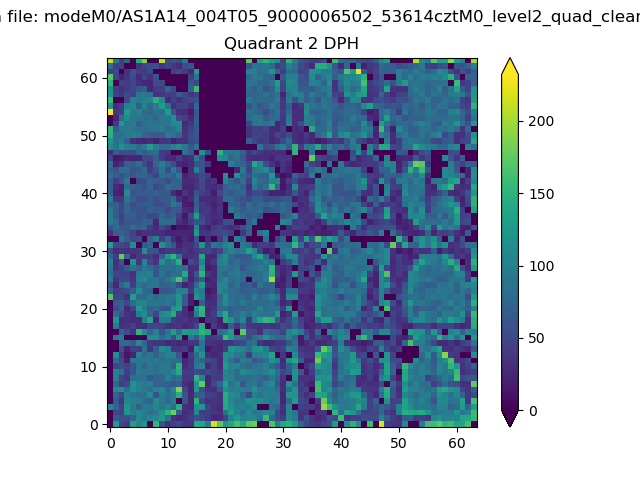
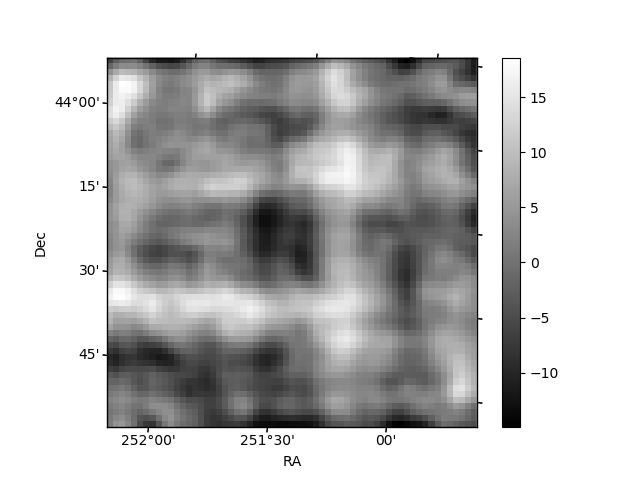
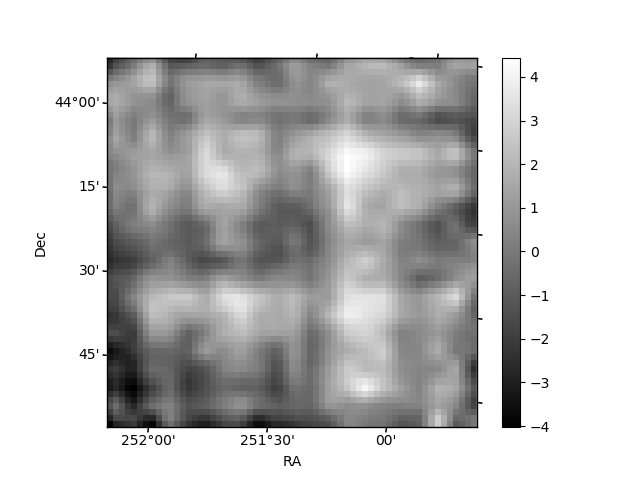
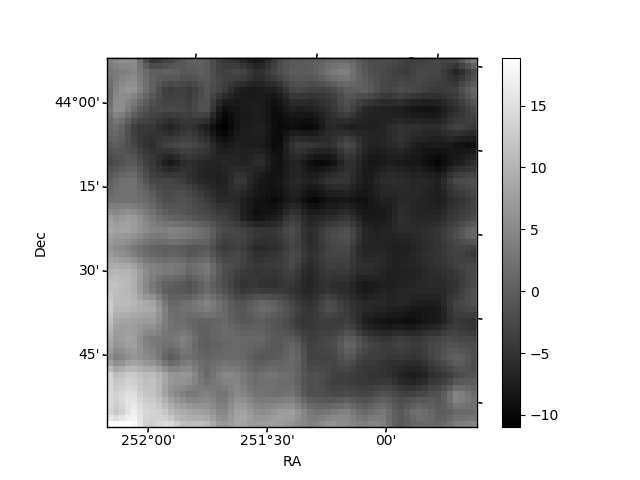
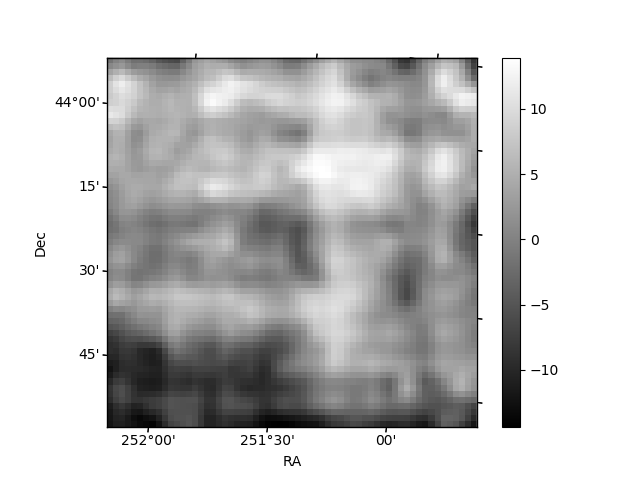
Histogram calculated using DETX and DETY for each event in the final _common_clean file
| Quadrant A | 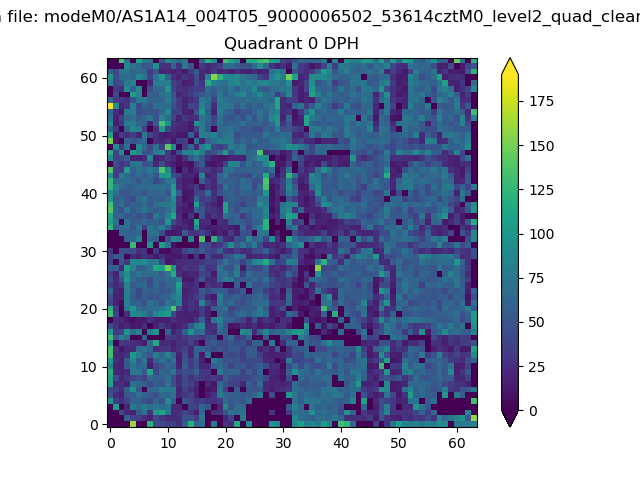 |
 |
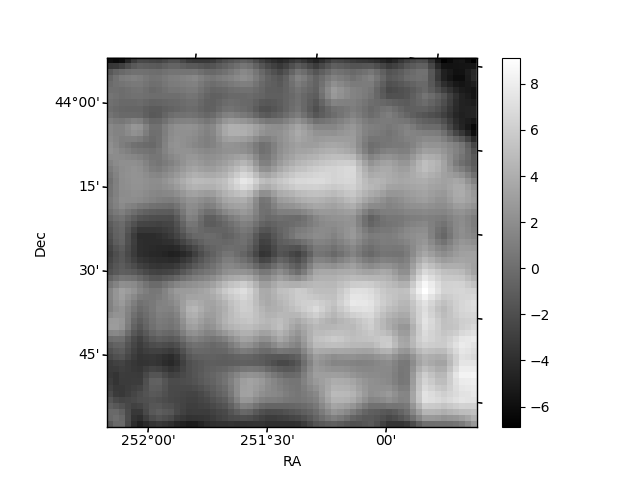
Quadrant B |
|---|---|---|---|
| Quadrant D | 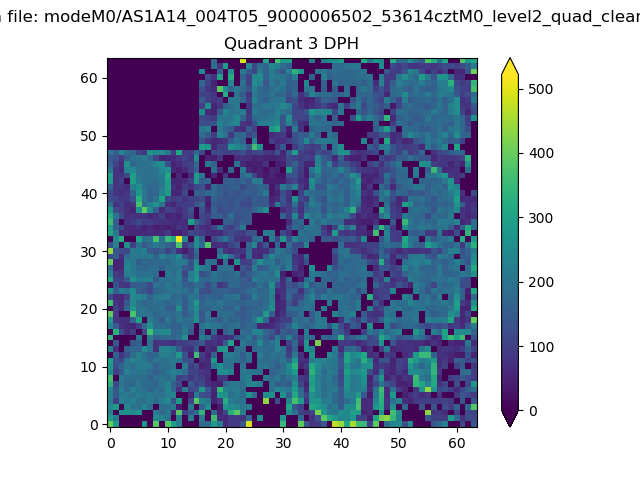 |
 |
Quadrant C |
| Plot type | Count rate plots | Images |
|---|---|---|
| Comparison with Poisson distribution Blue bars denote a histogram of data divided into 1 sec bins. Red curve is a Poisson curve with rate = median count rate of data. |
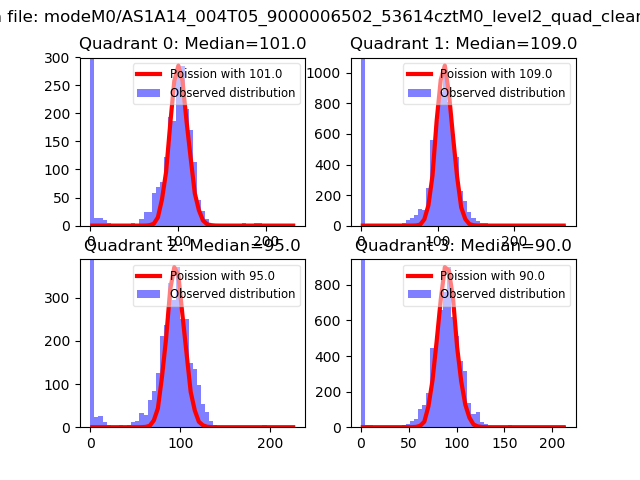 |
 |
| Quadrant-wise count rates Data is divided into 100 sec bins |
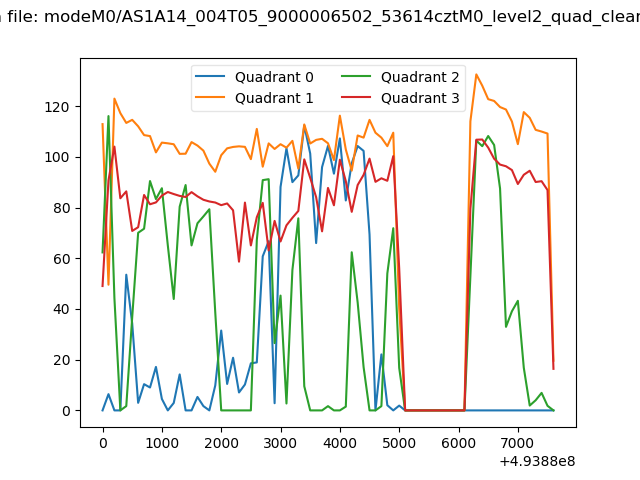 |
|
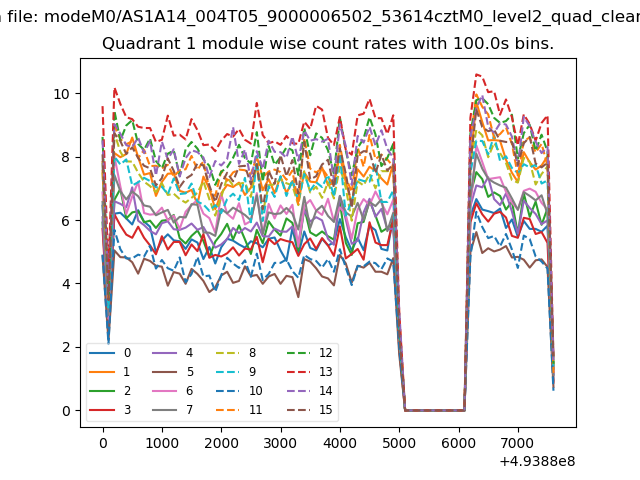
| Module-wise count rates for Quadrant A Data is divided into 100 sec bins |
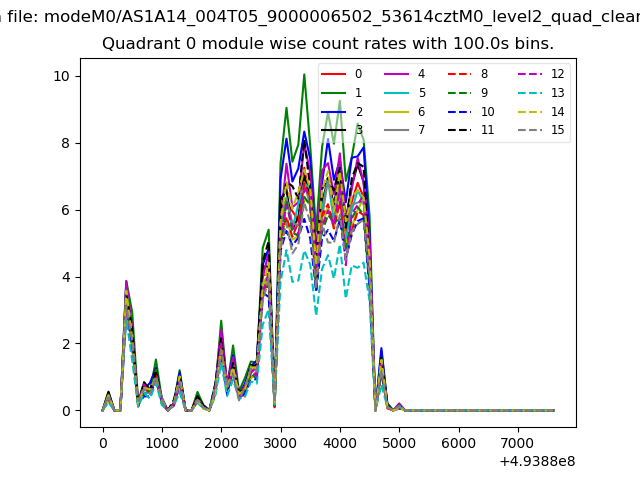 |
 |
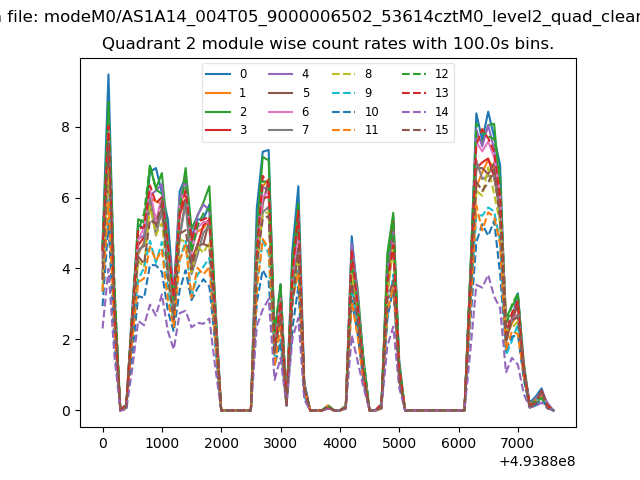
| Module-wise count rates for Quadrant B Data is divided into 100 sec bins |
 |
 |
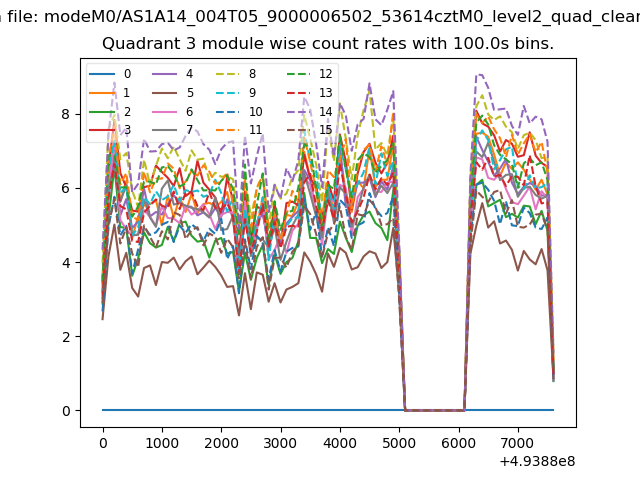
| Module-wise count rates for Quadrant C Data is divided into 100 sec bins |
 |
 |
| Module-wise count rates for Quadrant D Data is divided into 100 sec bins |
 |
 |
| Parameter | Plot |
|---|---|
| CZT HV Monitor | 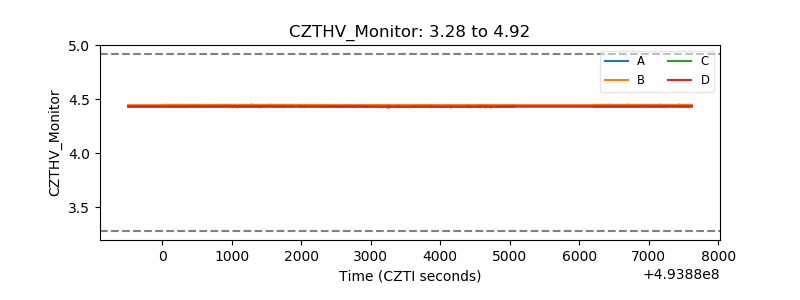 |
| D_VDD | 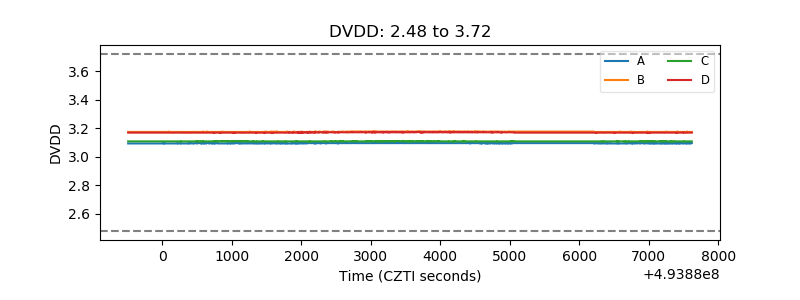 |
| Temperature 1 | 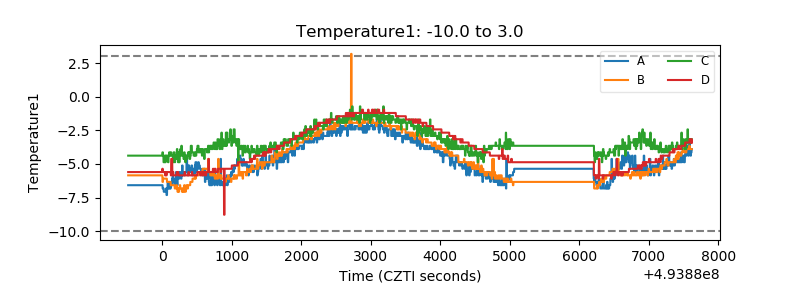 |
| Veto HV Monitor | 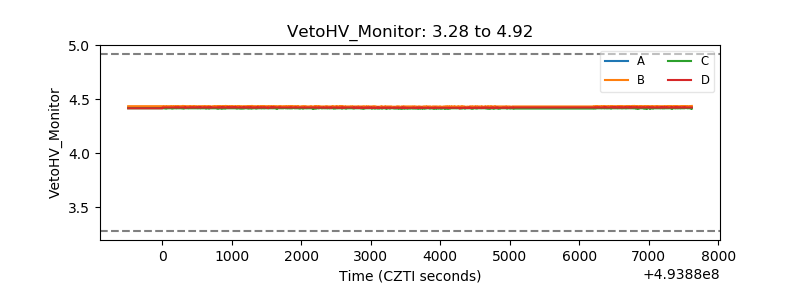 |
| Veto LLD | 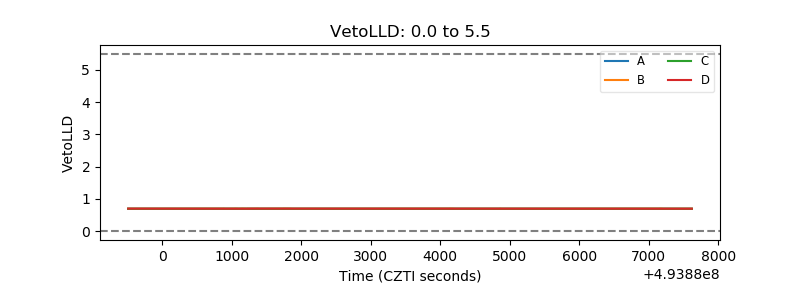 |
| Alpha Counter | 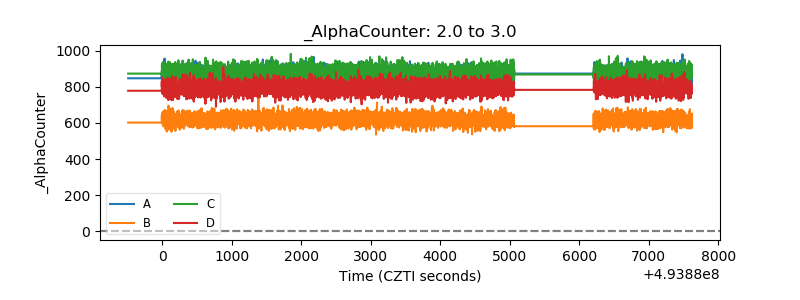 |
| _CPM_Rate | 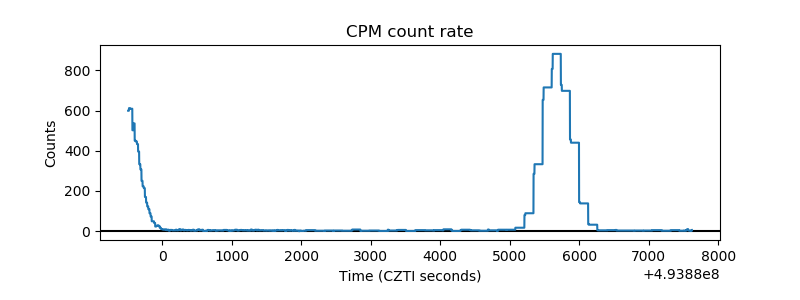 |
| CZT Counter | 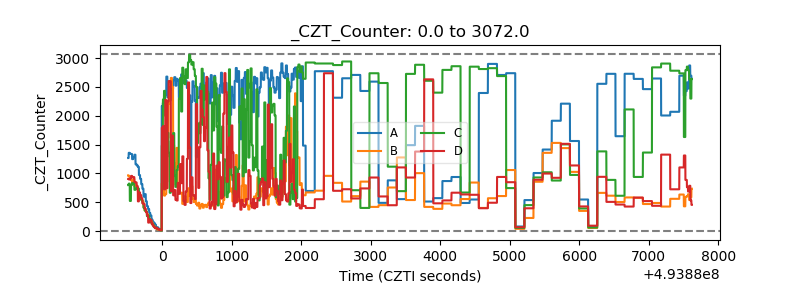 |
| +2.5 Volts monitor |  |
| +5 Volts monitor |  |
| _ROLL_ROT | 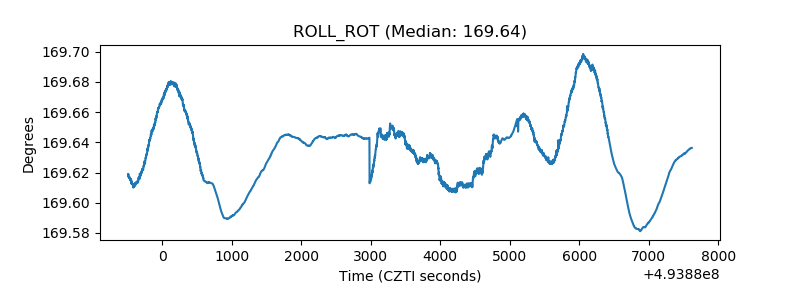 |
| _Roll_DEC | 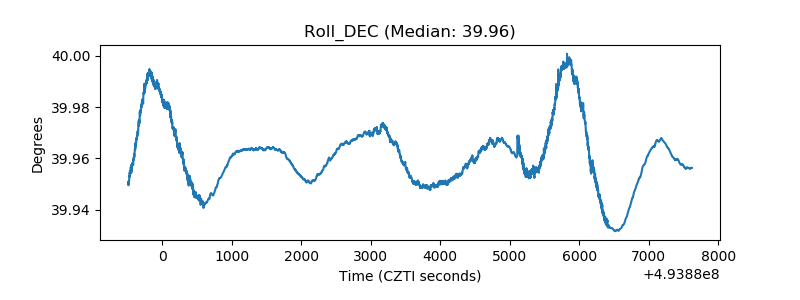 |
| _Roll_RA | 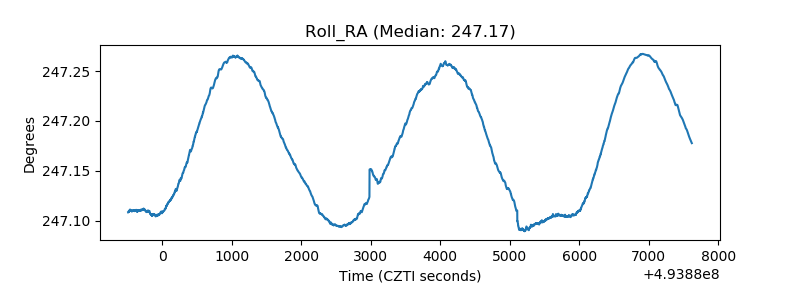 |
| Veto Counter | 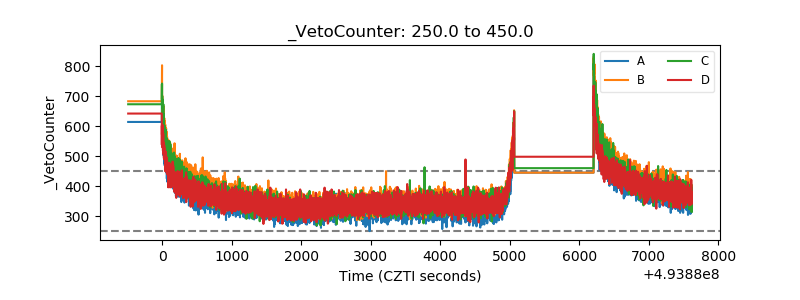 |