| Param | Original file | Final file |
|---|---|---|
| Filename | modeM0/AS1A14_004T05_9000006502_53615cztM0_level2.fits | modeM0/AS1A14_004T05_9000006502_53615cztM0_level2_quad_clean.evt |
| Size (bytes) | 1,002,384,000 | 71,510,400 |
| Size | 955.9 MB | 68.2 MB |
| Events in quadrant A | 14,195,716 | 141,493 |
| Events in quadrant B | 5,836,331 | 641,954 |
| Events in quadrant C | 11,745,598 | 348,519 |
| Events in quadrant D | 4,830,222 | 584,239 |
| Mode M9 | |||
|---|---|---|---|
| Quadrant | BADHDUFLAG | Total packets | Discarded packets |
| A | 0 | 15 | 0 |
| B | 0 | 16 | 0 |
| C | 0 | 16 | 0 |
| D | 0 | 16 | 0 |
| Mode SS | |||
|---|---|---|---|
| Quadrant | BADHDUFLAG | Total packets | Discarded packets |
| A | 0 | 130 | 0 |
| B | 0 | 130 | 0 |
| C | 0 | 130 | 0 |
| D | 0 | 130 | 0 |
| Mode M0 | |||
|---|---|---|---|
| Quadrant | BADHDUFLAG | Total packets | Discarded packets |
| A | 0 | 46581 | 2 |
| B | 0 | 21661 | 7 |
| C | 0 | 39205 | 2 |
| D | 0 | 18686 | 2 |
| Quadrant | Total seconds | Saturated seconds | Saturation percentage |
|---|---|---|---|
| A | 6436 | 5246 | 81.510255% |
| B | 6435 | 943 | 14.654235% |
| C | 6435 | 3272 | 50.846931% |
| D | 6435 | 297 | 4.615385% |
Noise dominated data is calculated using 1-second bins in cleaned event files. If a bin has >2000 counts, and if more than 50% of those come from <1% of pixels, then it is considered to be noise-dominated and hence unusable.
| Quadrant | # 1 sec bins | Bins with >0 counts | Bins with >2000 counts | High rate bins dominated by noise | Noise dominated (total time) | Noise dominated (detector-on time) | Marked lightcurve |
|---|---|---|---|---|---|---|---|
| A | 7605 | 6422 | 4783 | 4783 | 62.89% | 74.48% | 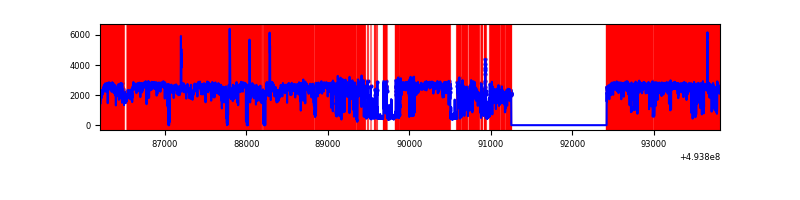 |
| B | 7604 | 6434 | 644 | 644 | 8.47% | 10.01% | 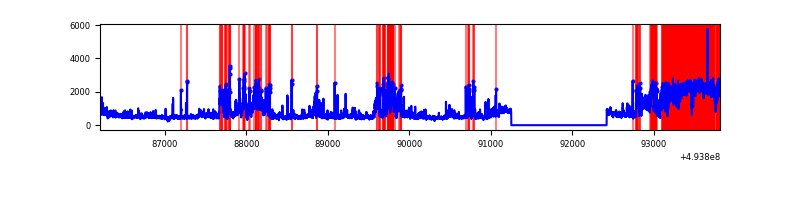 |
| C | 7605 | 6435 | 3160 | 3160 | 41.55% | 49.11% | 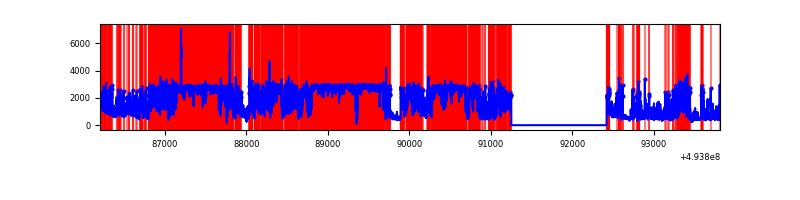 |
| D | 7605 | 6435 | 189 | 189 | 2.49% | 2.94% | 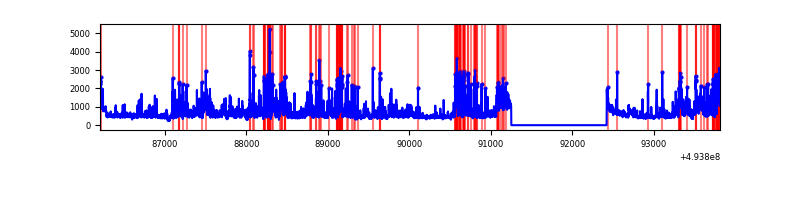 |
Top three noisy pixels from each quadrant. If the there are fewer than three noisy pixels in the level2.evt file, extra rows are filled as -1
| Pixel properties | Quadrant properties | ||||||
|---|---|---|---|---|---|---|---|
| Quadrant | DetID | PixID | Counts | Sigma | Mean | Median | Sigma |
| A | 3 | 78 | 6921781 | 80059.96 | 343 | 334 | 86.5 |
| A | 4 | 95 | 5444668 | 62974.28 | 343 | 334 | 86.5 |
| A | 3 | 63 | 225547 | 2605.03 | 343 | 334 | 86.5 |
| B | 10 | 254 | 2006405 | 13141.91 | 715 | 691 | 152.6 |
| B | 5 | 172 | 283606 | 1853.73 | 715 | 691 | 152.6 |
| B | 15 | 20 | 213916 | 1397.1 | 715 | 691 | 152.6 |
| C | 1 | 241 | 7675894 | 53854.98 | 522 | 518 | 142.5 |
| C | 15 | 224 | 1016852 | 7131.2 | 522 | 518 | 142.5 |
| C | 15 | 178 | 500647 | 3509.2 | 522 | 518 | 142.5 |
| D | 8 | 176 | 1069656 | 5205.75 | 717 | 685 | 205.3 |
| D | 2 | 153 | 163171 | 791.29 | 717 | 685 | 205.3 |
| D | 10 | 172 | 134133 | 649.87 | 717 | 685 | 205.3 |
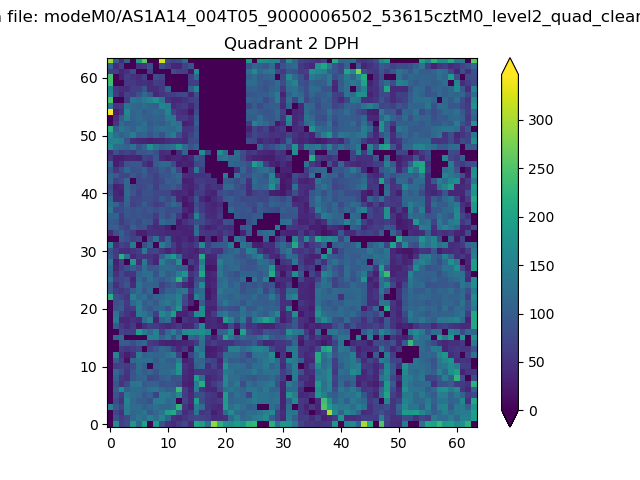
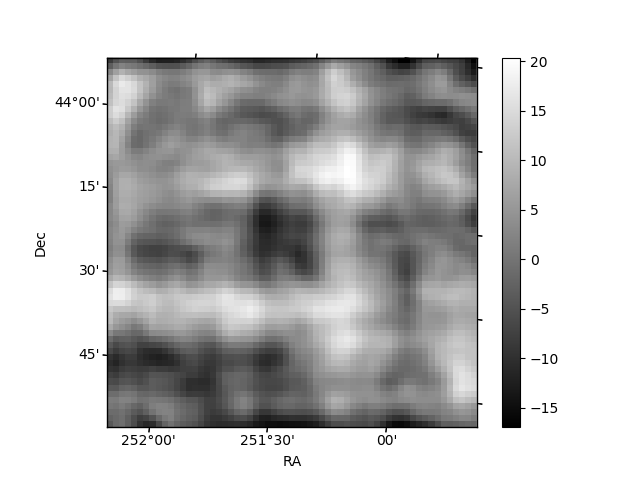
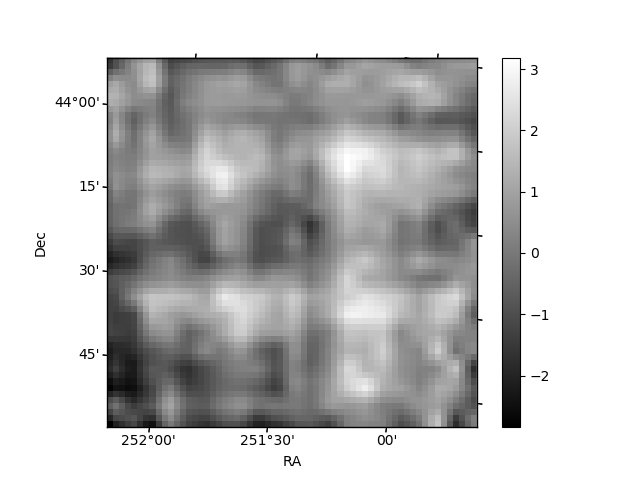
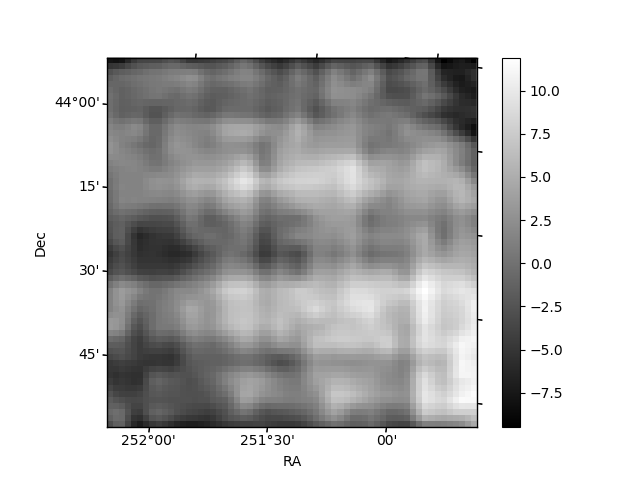
Histogram calculated using DETX and DETY for each event in the final _common_clean file
| Quadrant A | 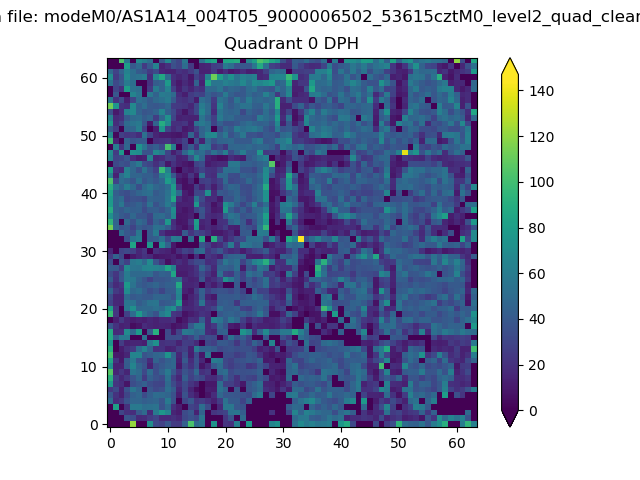 |
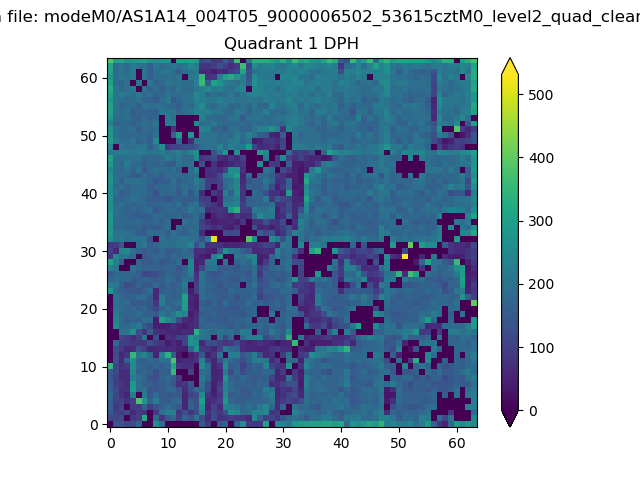 |
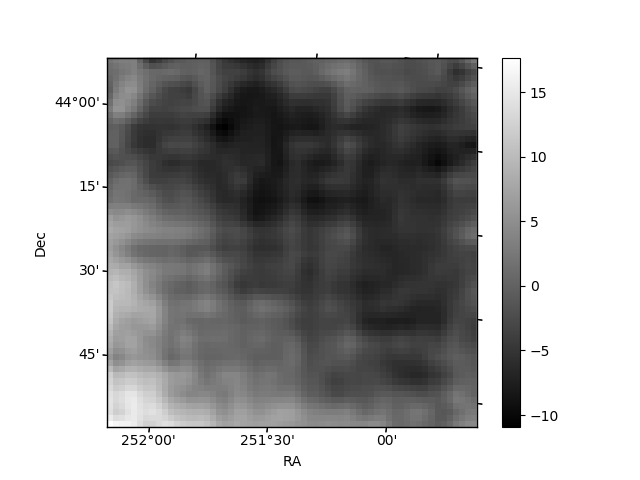
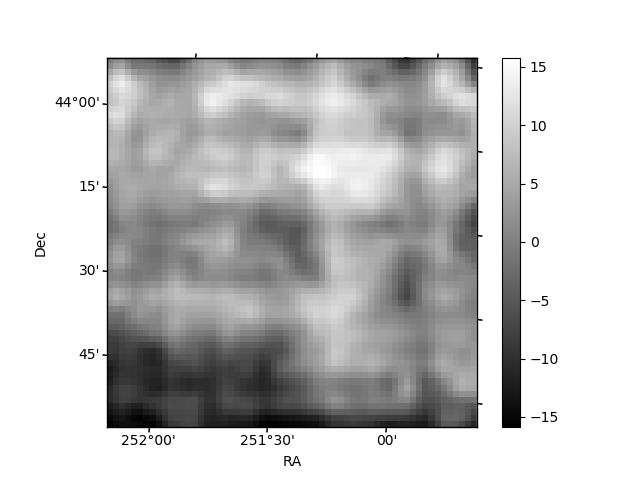
Quadrant B |
|---|---|---|---|
| Quadrant D | 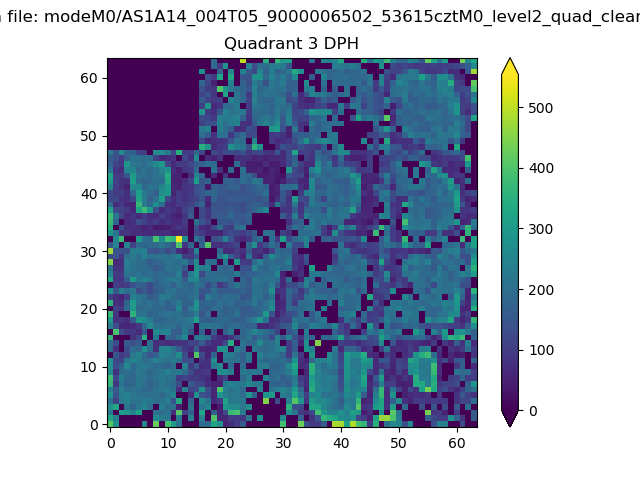 |
 |
Quadrant C |
| Plot type | Count rate plots | Images |
|---|---|---|
| Comparison with Poisson distribution Blue bars denote a histogram of data divided into 1 sec bins. Red curve is a Poisson curve with rate = median count rate of data. |
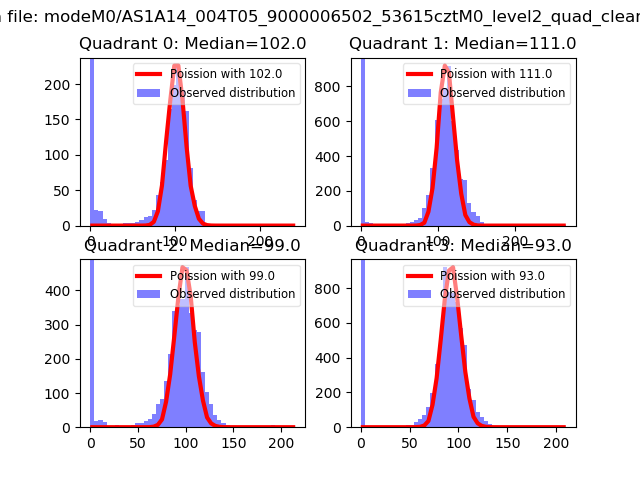 |
 |
| Quadrant-wise count rates Data is divided into 100 sec bins |
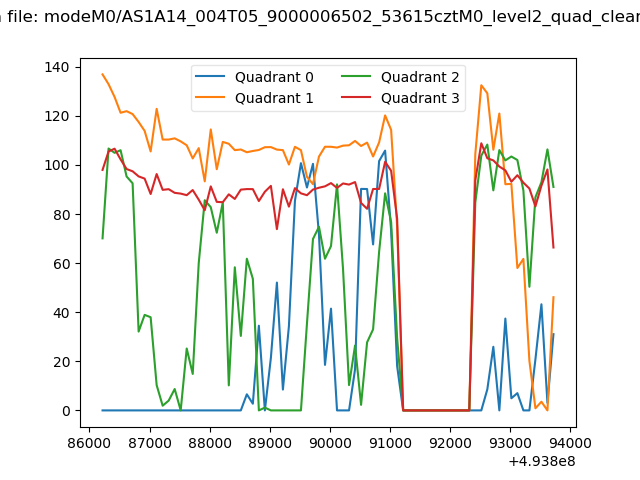 |
|
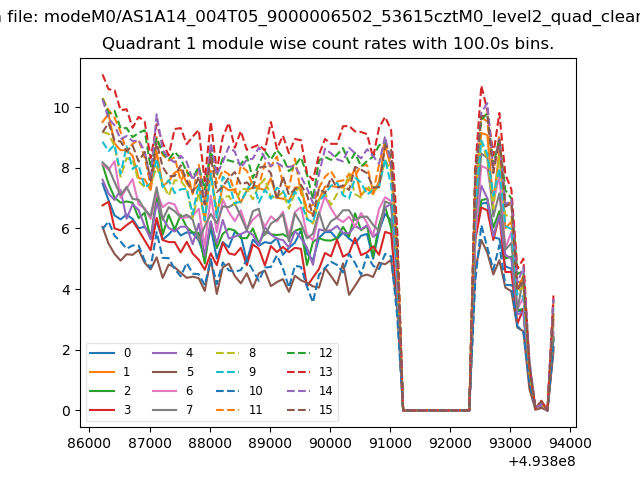
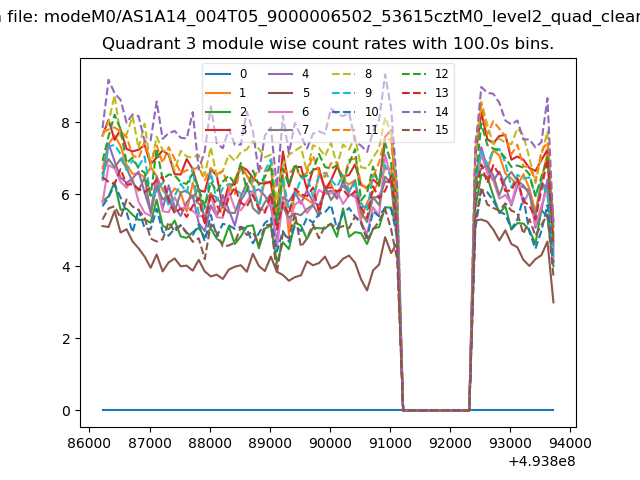
| Module-wise count rates for Quadrant A Data is divided into 100 sec bins |
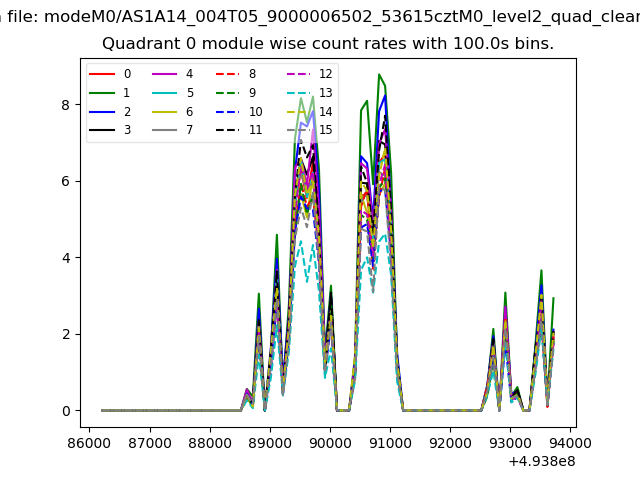 |
 |
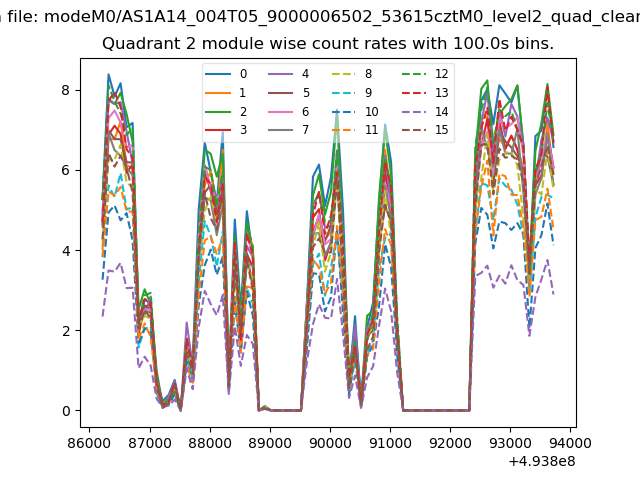
| Module-wise count rates for Quadrant B Data is divided into 100 sec bins |
 |
 |
| Module-wise count rates for Quadrant C Data is divided into 100 sec bins |
 |
 |
| Module-wise count rates for Quadrant D Data is divided into 100 sec bins |
 |
 |
| Parameter | Plot |
|---|---|
| CZT HV Monitor | 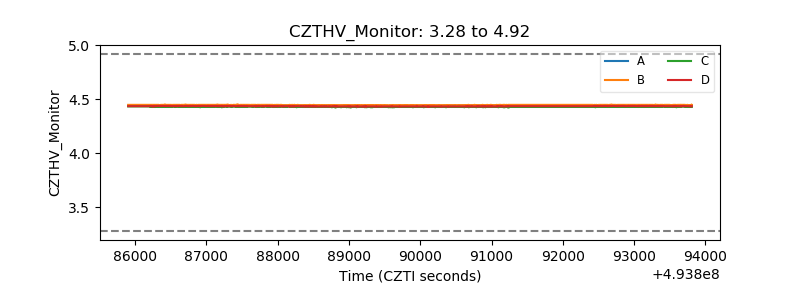 |
| D_VDD | 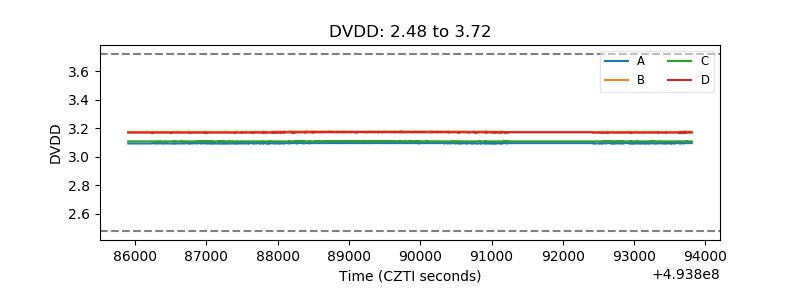 |
| Temperature 1 | 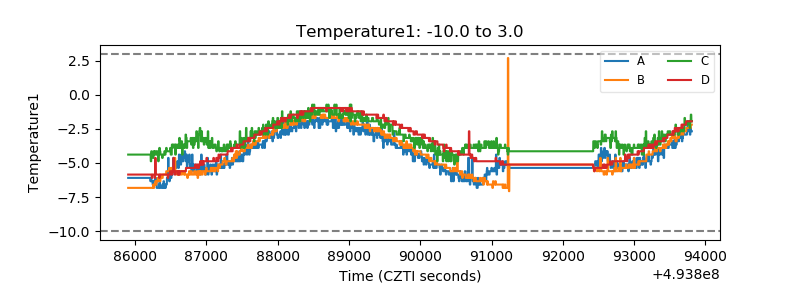 |
| Veto HV Monitor | 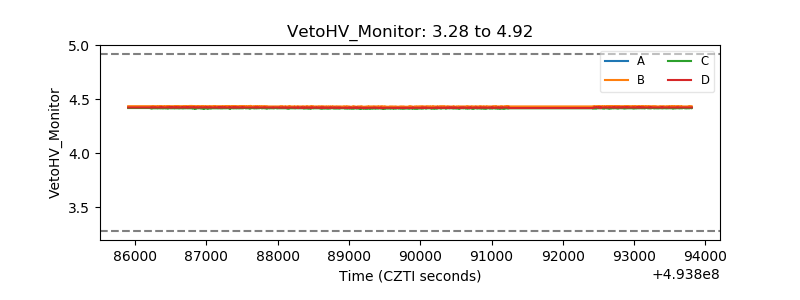 |
| Veto LLD | 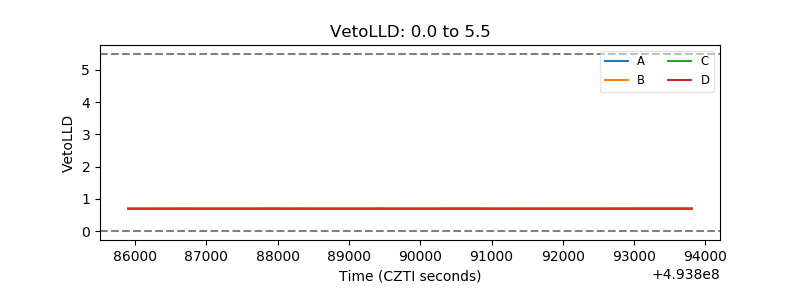 |
| Alpha Counter | 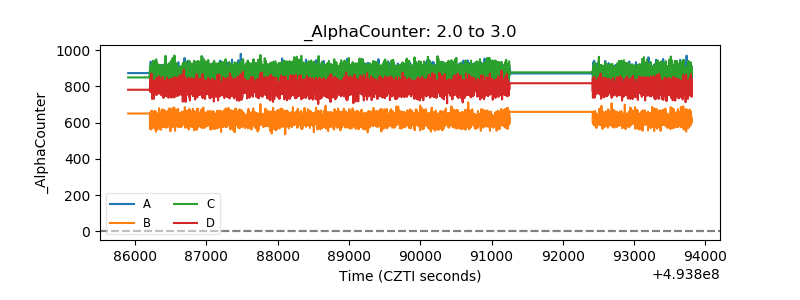 |
| _CPM_Rate | 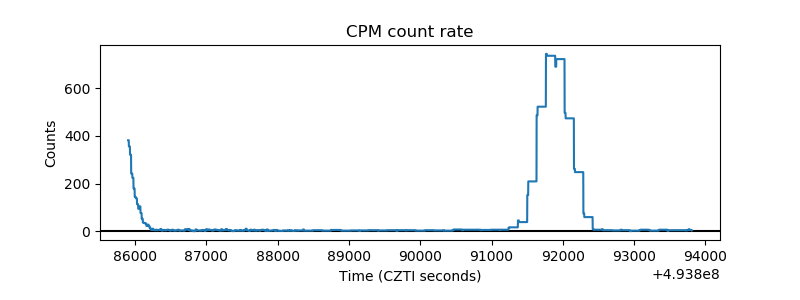 |
| CZT Counter | 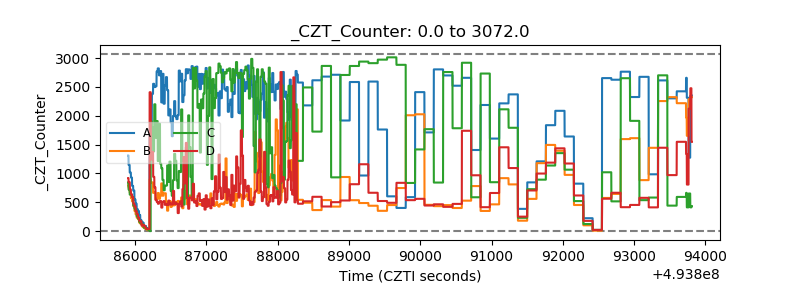 |
| +2.5 Volts monitor | 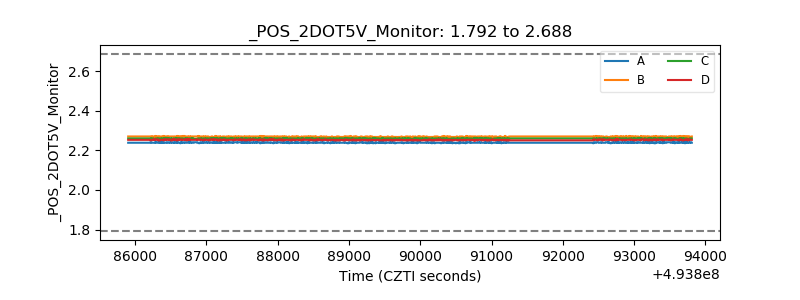 |
| +5 Volts monitor | 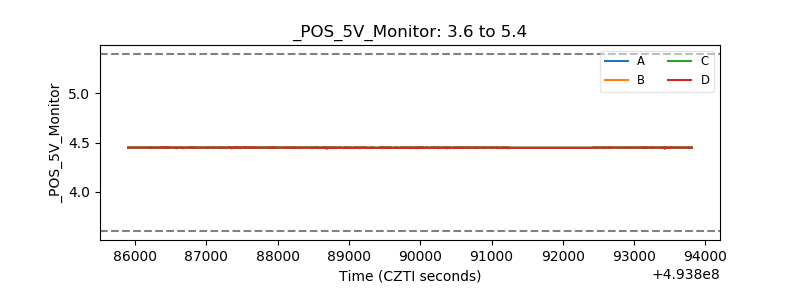 |
| _ROLL_ROT | 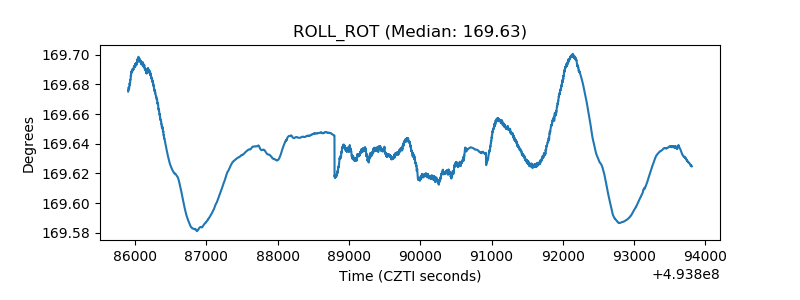 |
| _Roll_DEC | 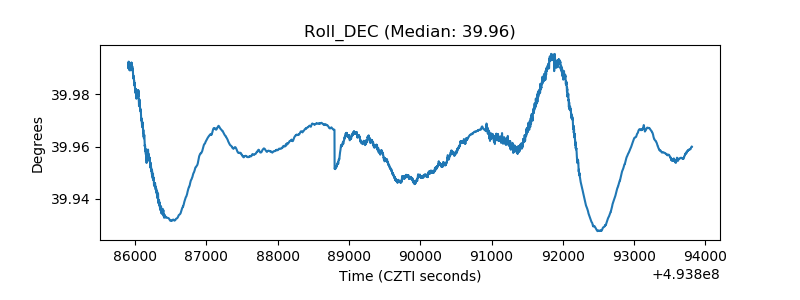 |
| _Roll_RA | 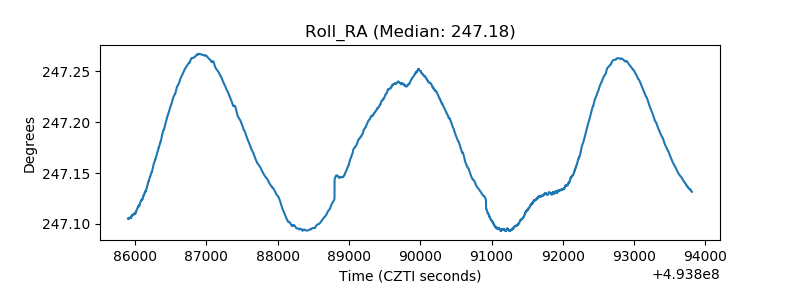 |
| Veto Counter | 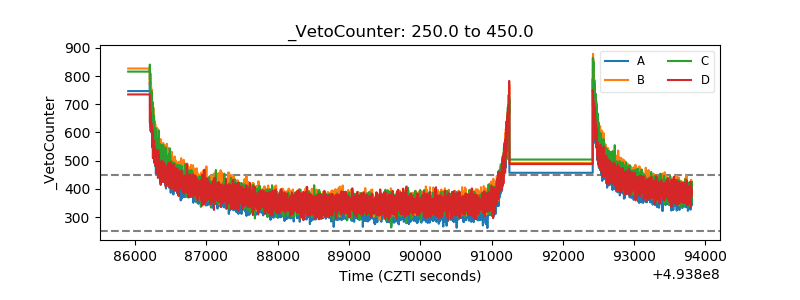 |