| Param | Original file | Final file |
|---|---|---|
| Filename | modeM0/AS1A14_004T05_9000006502_53617cztM0_level2.fits | modeM0/AS1A14_004T05_9000006502_53617cztM0_level2_quad_clean.evt |
| Size (bytes) | 1,073,384,640 | 56,669,760 |
| Size | 1023.7 MB | 54.0 MB |
| Events in quadrant A | 13,269,425 | 150,013 |
| Events in quadrant B | 8,127,212 | 420,447 |
| Events in quadrant C | 9,624,548 | 324,225 |
| Events in quadrant D | 8,261,533 | 411,283 |
| Mode M9 | |||
|---|---|---|---|
| Quadrant | BADHDUFLAG | Total packets | Discarded packets |
| A | 0 | 10 | 0 |
| B | 0 | 10 | 0 |
| C | 0 | 10 | 0 |
| D | 0 | 10 | 0 |
| Mode SS | |||
|---|---|---|---|
| Quadrant | BADHDUFLAG | Total packets | Discarded packets |
| A | 0 | 120 | 0 |
| B | 0 | 120 | 0 |
| C | 0 | 120 | 0 |
| D | 0 | 120 | 0 |
| Mode M0 | |||
|---|---|---|---|
| Quadrant | BADHDUFLAG | Total packets | Discarded packets |
| A | 0 | 43474 | 3 |
| B | 0 | 28189 | 1 |
| C | 0 | 32592 | 1 |
| D | 0 | 28572 | 1 |
| Quadrant | Total seconds | Saturated seconds | Saturation percentage |
|---|---|---|---|
| A | 5855 | 4575 | 78.138343% |
| B | 5856 | 2092 | 35.724044% |
| C | 5856 | 2701 | 46.123634% |
| D | 5856 | 1568 | 26.775956% |
Noise dominated data is calculated using 1-second bins in cleaned event files. If a bin has >2000 counts, and if more than 50% of those come from <1% of pixels, then it is considered to be noise-dominated and hence unusable.
| Quadrant | # 1 sec bins | Bins with >0 counts | Bins with >2000 counts | High rate bins dominated by noise | Noise dominated (total time) | Noise dominated (detector-on time) | Marked lightcurve |
|---|---|---|---|---|---|---|---|
| A | 6904 | 5852 | 4467 | 4467 | 64.70% | 76.33% | 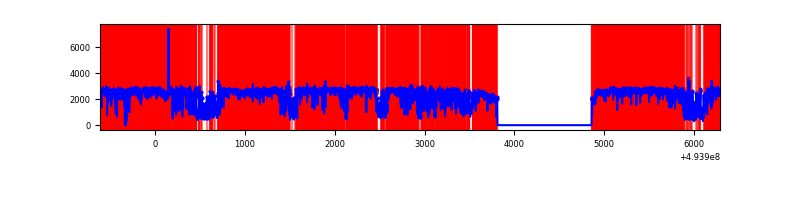 |
| B | 6905 | 5855 | 1673 | 1673 | 24.23% | 28.57% | 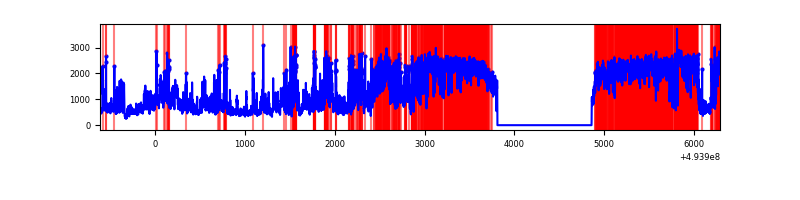 |
| C | 6905 | 5855 | 2558 | 2558 | 37.05% | 43.69% | 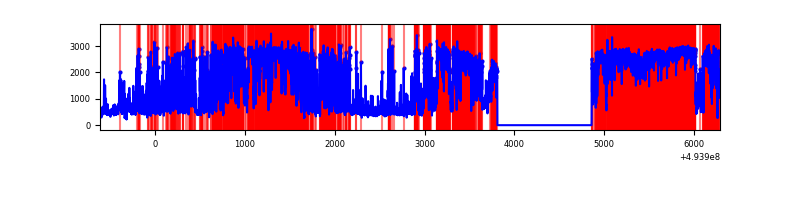 |
| D | 6906 | 5856 | 1506 | 1506 | 21.81% | 25.72% | 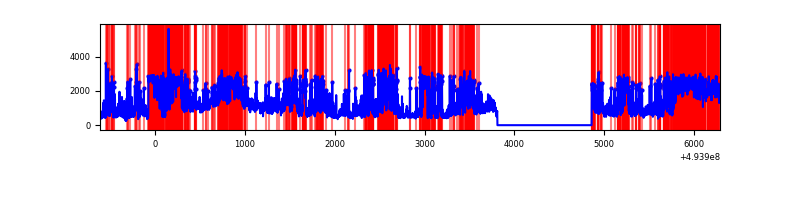 |
Top three noisy pixels from each quadrant. If the there are fewer than three noisy pixels in the level2.evt file, extra rows are filled as -1
| Pixel properties | Quadrant properties | ||||||
|---|---|---|---|---|---|---|---|
| Quadrant | DetID | PixID | Counts | Sigma | Mean | Median | Sigma |
| A | 3 | 78 | 8142485 | 94343.19 | 338 | 330 | 86.3 |
| A | 4 | 95 | 3109663 | 36027.86 | 338 | 330 | 86.3 |
| A | 8 | 249 | 266064 | 3079.06 | 338 | 330 | 86.3 |
| B | 10 | 254 | 3779683 | 31499.07 | 560 | 540 | 120.0 |
| B | 15 | 20 | 1117311 | 9308.26 | 560 | 540 | 120.0 |
| B | 5 | 172 | 310386 | 2582.56 | 560 | 540 | 120.0 |
| C | 1 | 241 | 4459563 | 33870.25 | 479 | 474 | 131.7 |
| C | 15 | 224 | 2672342 | 20294.92 | 479 | 474 | 131.7 |
| C | 13 | 3 | 295283 | 2239.3 | 479 | 474 | 131.7 |
| D | 8 | 176 | 3387693 | 20341.25 | 574 | 547 | 166.5 |
| D | 12 | 34 | 1608476 | 9656.29 | 574 | 547 | 166.5 |
| D | 10 | 172 | 359345 | 2154.73 | 574 | 547 | 166.5 |
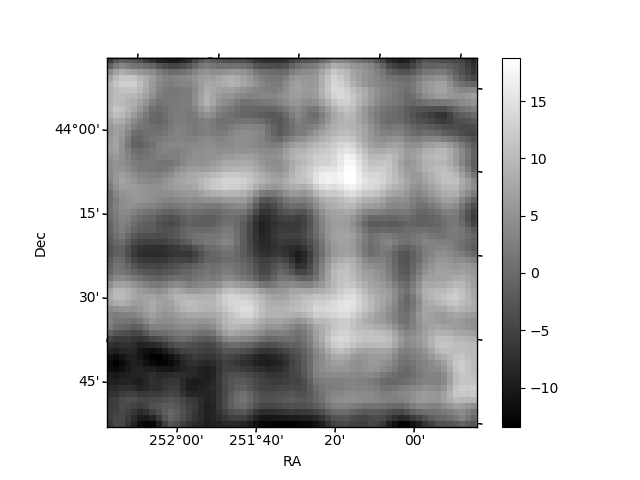
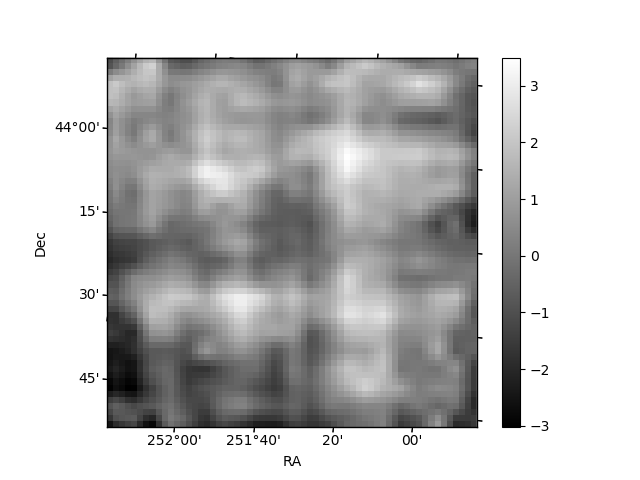
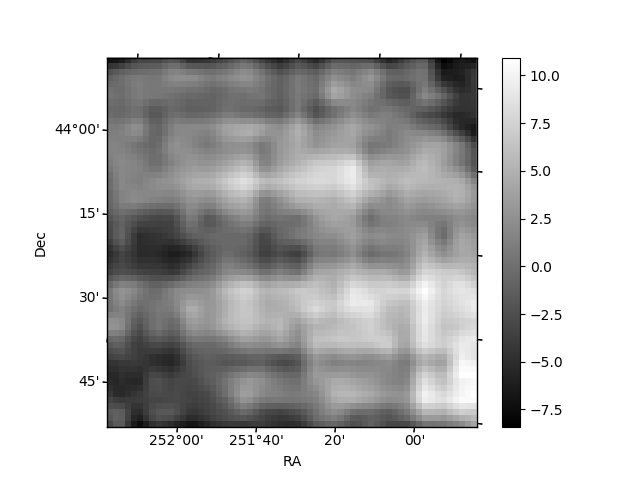
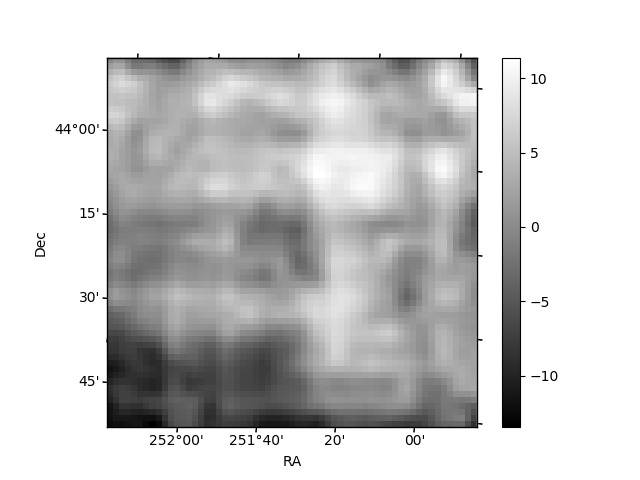
Histogram calculated using DETX and DETY for each event in the final _common_clean file
| Quadrant A | 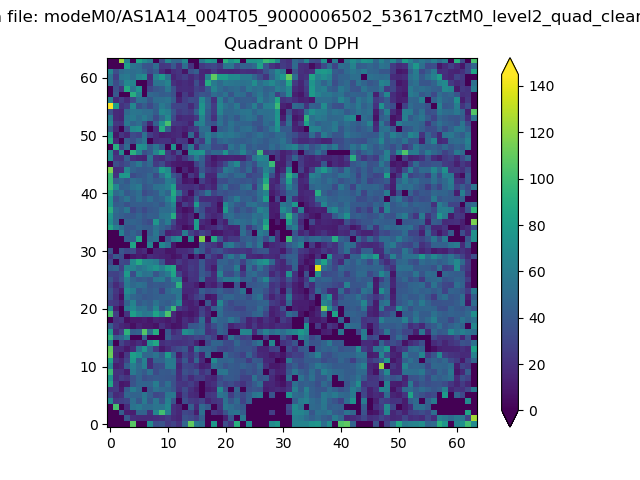 |
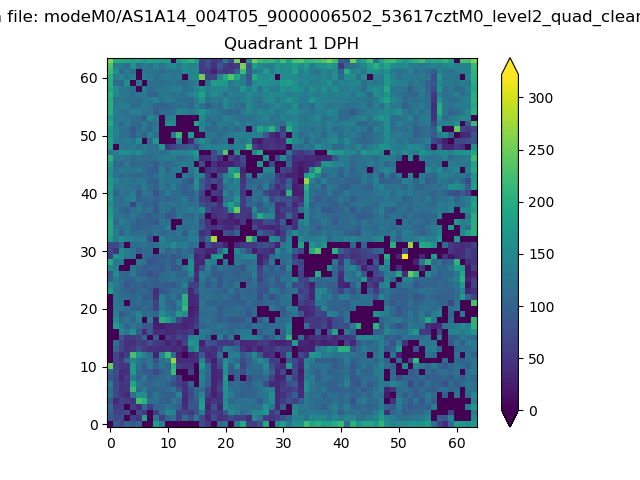 |
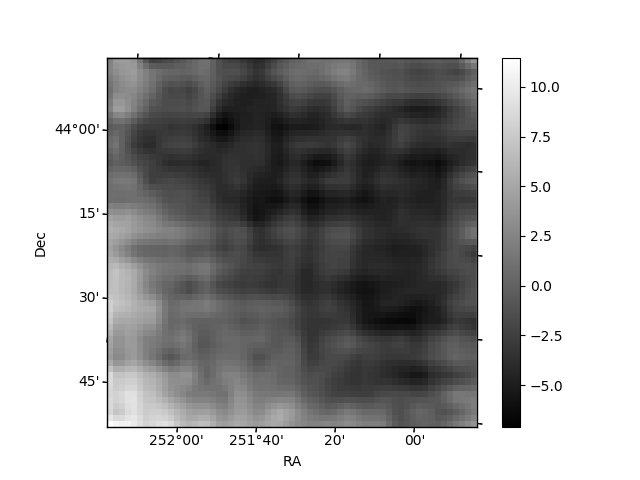
Quadrant B |
|---|---|---|---|
| Quadrant D | 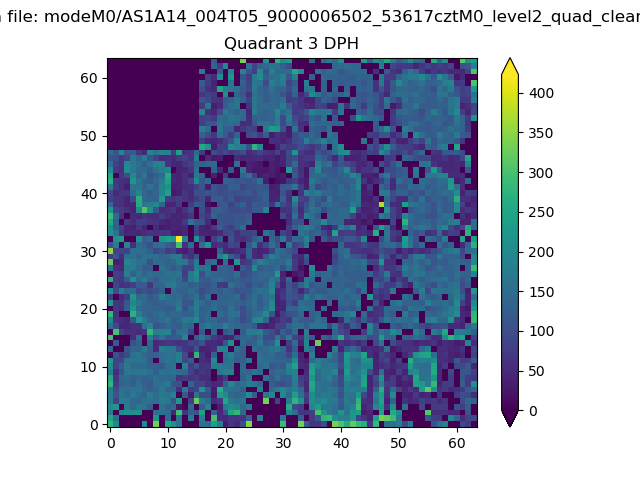 |
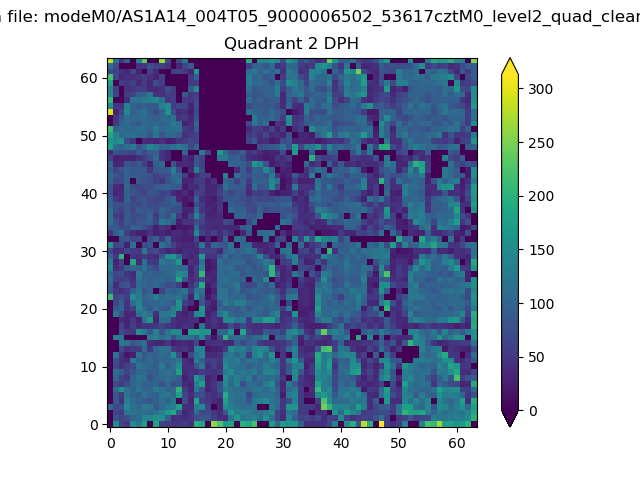 |
Quadrant C |
| Plot type | Count rate plots | Images |
|---|---|---|
| Comparison with Poisson distribution Blue bars denote a histogram of data divided into 1 sec bins. Red curve is a Poisson curve with rate = median count rate of data. |
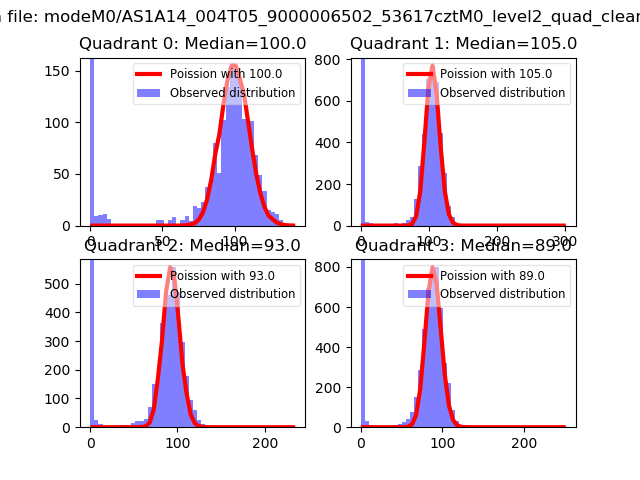 |
 |
| Quadrant-wise count rates Data is divided into 100 sec bins |
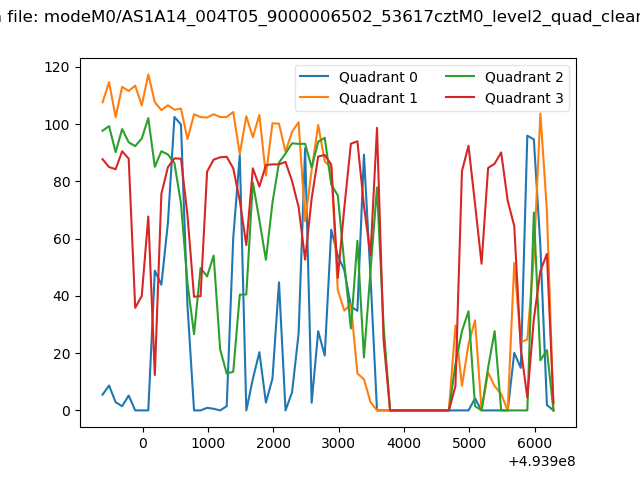 |
|
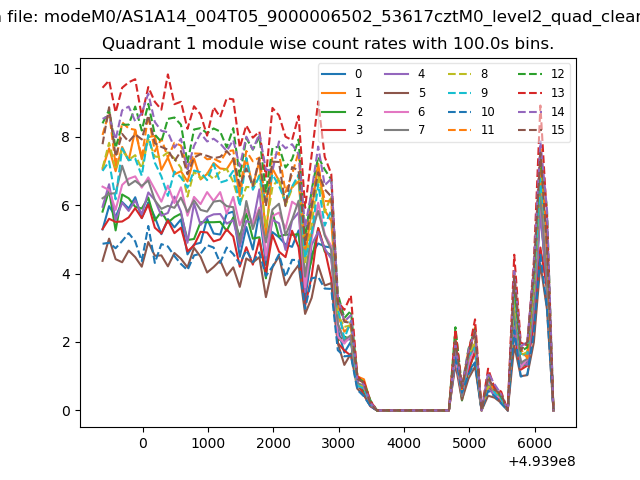
| Module-wise count rates for Quadrant A Data is divided into 100 sec bins |
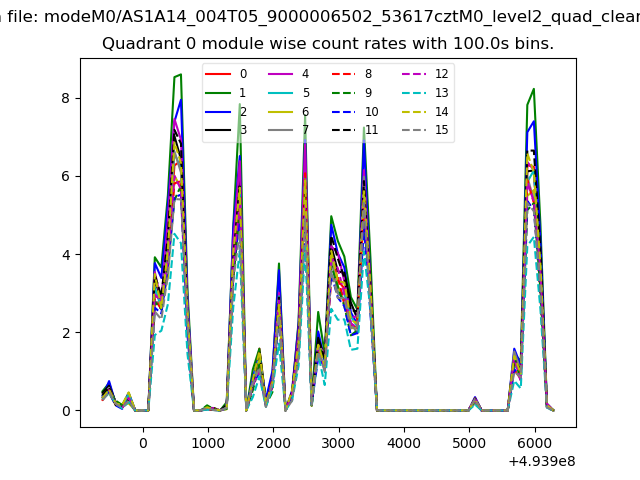 |
 |
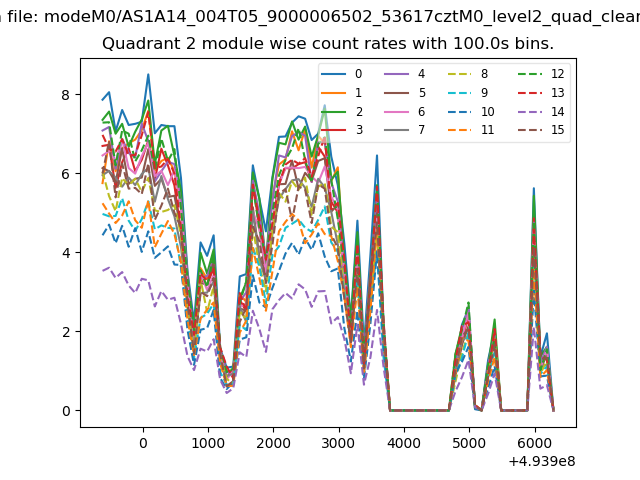
| Module-wise count rates for Quadrant B Data is divided into 100 sec bins |
 |
 |
| Module-wise count rates for Quadrant C Data is divided into 100 sec bins |
 |
 |
| Module-wise count rates for Quadrant D Data is divided into 100 sec bins |
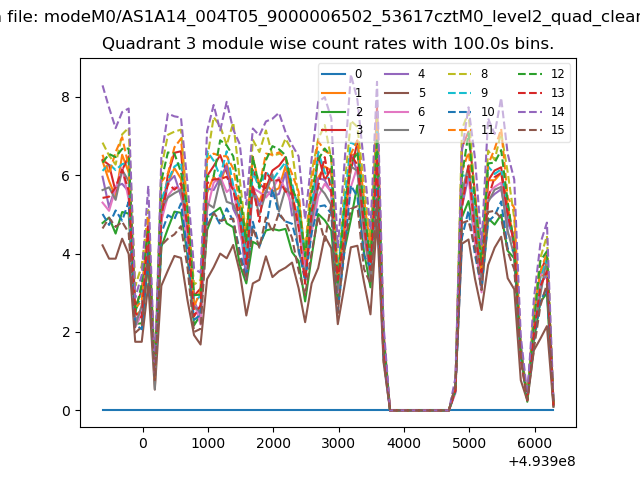 |
 |
| Parameter | Plot |
|---|---|
| CZT HV Monitor | 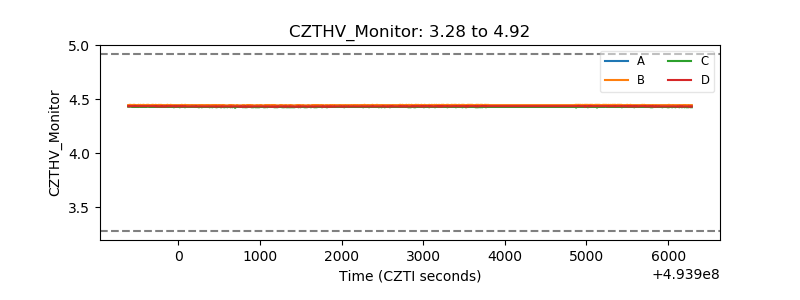 |
| D_VDD | 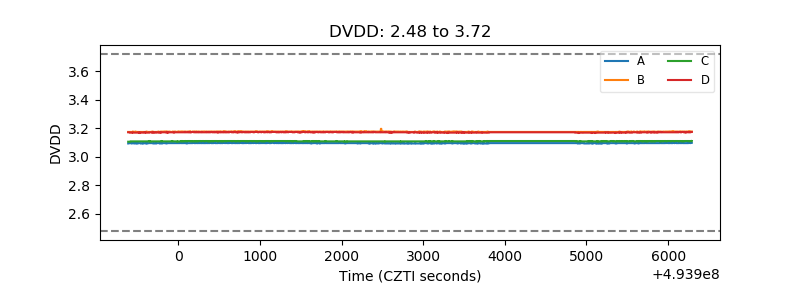 |
| Temperature 1 | 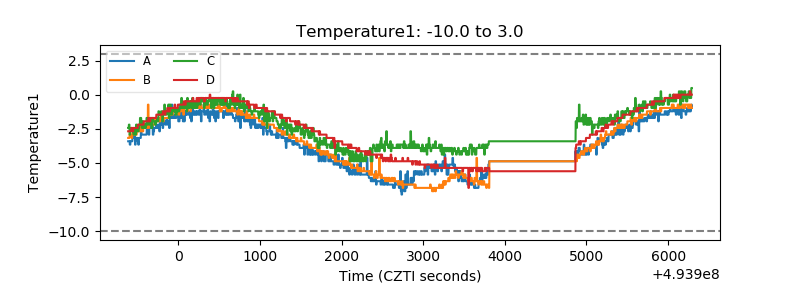 |
| Veto HV Monitor | 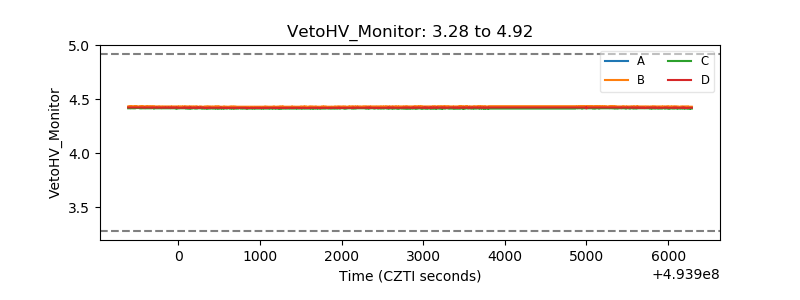 |
| Veto LLD | 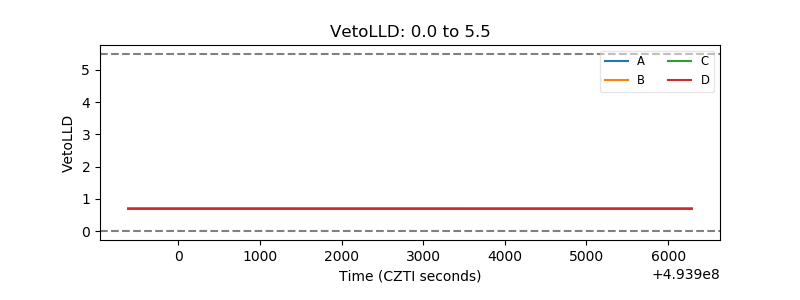 |
| Alpha Counter | 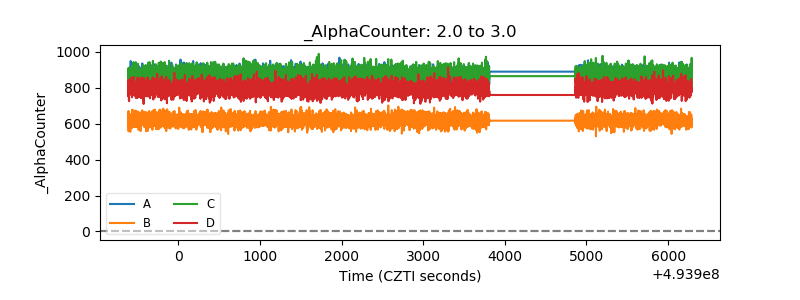 |
| _CPM_Rate |  |
| CZT Counter | 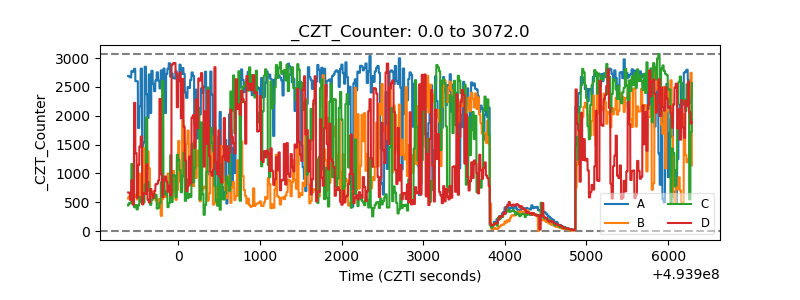 |
| +2.5 Volts monitor |  |
| +5 Volts monitor |  |
| _ROLL_ROT | 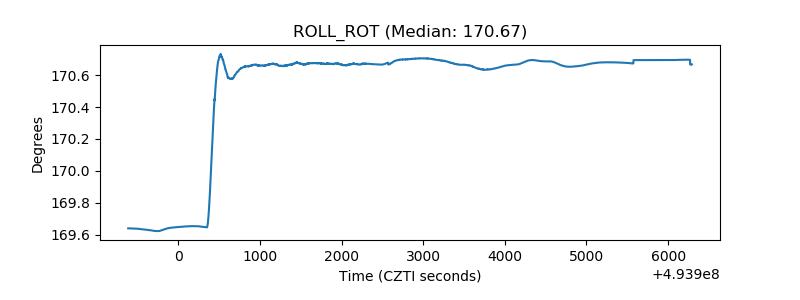 |
| _Roll_DEC | 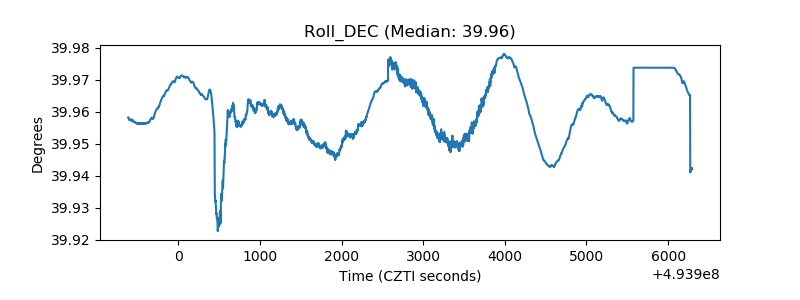 |
| _Roll_RA | 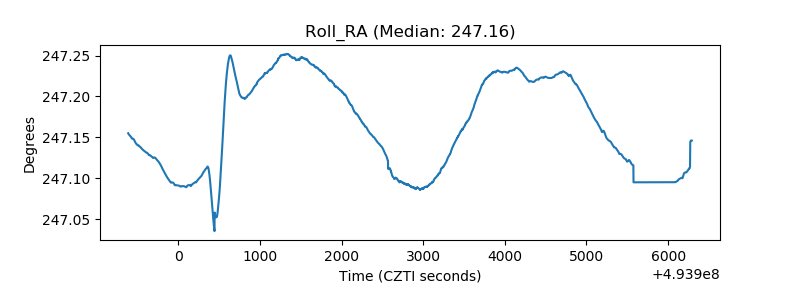 |
| Veto Counter | 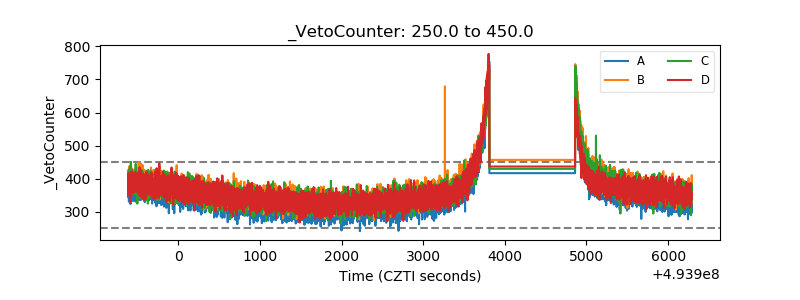 |