| Param | Original file | Final file |
|---|---|---|
| Filename | modeM0/AS1A14_004T05_9000006502_53619cztM0_level2.fits | modeM0/AS1A14_004T05_9000006502_53619cztM0_level2_quad_clean.evt |
| Size (bytes) | 1,937,396,160 | 123,336,000 |
| Size | 1.8 GB | 117.6 MB |
| Events in quadrant A | 23,900,328 | 396,335 |
| Events in quadrant B | 14,081,155 | 1,003,562 |
| Events in quadrant C | 17,756,826 | 723,634 |
| Events in quadrant D | 15,069,588 | 791,566 |
| Mode M9 | |||
|---|---|---|---|
| Quadrant | BADHDUFLAG | Total packets | Discarded packets |
| A | 0 | 11 | 0 |
| B | 0 | 11 | 0 |
| C | 0 | 11 | 0 |
| D | 0 | 11 | 0 |
| Mode SS | |||
|---|---|---|---|
| Quadrant | BADHDUFLAG | Total packets | Discarded packets |
| A | 0 | 242 | 0 |
| B | 0 | 242 | 0 |
| C | 0 | 242 | 0 |
| D | 0 | 242 | 0 |
| Mode M0 | |||
|---|---|---|---|
| Quadrant | BADHDUFLAG | Total packets | Discarded packets |
| A | 0 | 79156 | 3 |
| B | 0 | 50064 | 3 |
| C | 0 | 60891 | 3 |
| D | 0 | 52888 | 7 |
| Quadrant | Total seconds | Saturated seconds | Saturation percentage |
|---|---|---|---|
| A | 11822 | 8043 | 68.034174% |
| B | 11823 | 2501 | 21.153683% |
| C | 11823 | 4330 | 36.623530% |
| D | 11822 | 3001 | 25.384876% |
Noise dominated data is calculated using 1-second bins in cleaned event files. If a bin has >2000 counts, and if more than 50% of those come from <1% of pixels, then it is considered to be noise-dominated and hence unusable.
| Quadrant | # 1 sec bins | Bins with >0 counts | Bins with >2000 counts | High rate bins dominated by noise | Noise dominated (total time) | Noise dominated (detector-on time) | Marked lightcurve |
|---|---|---|---|---|---|---|---|
| A | 12977 | 11822 | 7828 | 7828 | 60.32% | 66.22% | 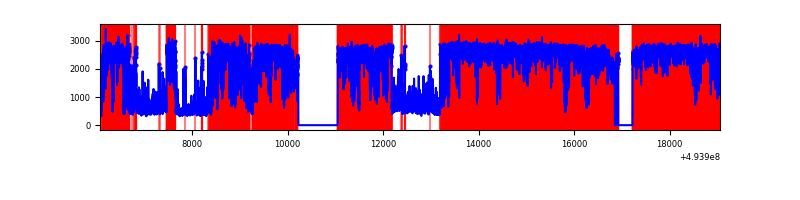 |
| B | 12978 | 11823 | 1986 | 1986 | 15.30% | 16.80% | 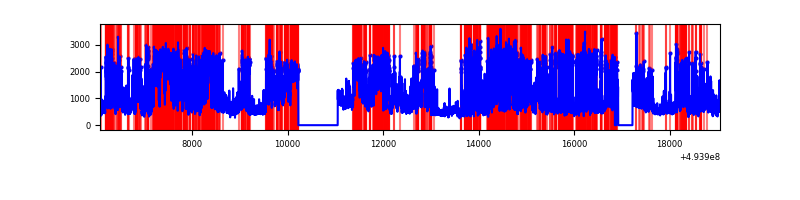 |
| C | 12977 | 11823 | 4066 | 4066 | 31.33% | 34.39% | 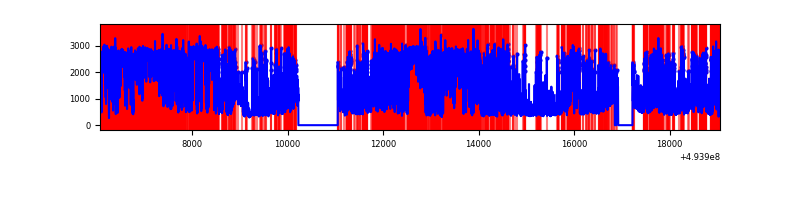 |
| D | 12978 | 11825 | 3047 | 3047 | 23.48% | 25.77% | 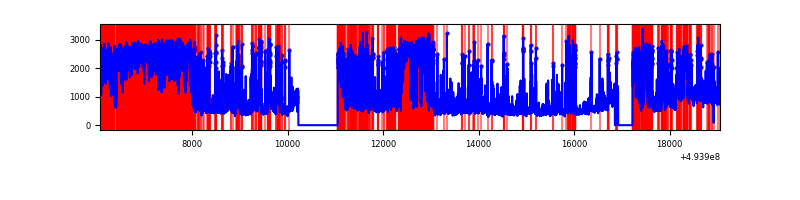 |
Top three noisy pixels from each quadrant. If the there are fewer than three noisy pixels in the level2.evt file, extra rows are filled as -1
| Pixel properties | Quadrant properties | ||||||
|---|---|---|---|---|---|---|---|
| Quadrant | DetID | PixID | Counts | Sigma | Mean | Median | Sigma |
| A | 3 | 78 | 16285449 | 83076.49 | 785 | 767 | 196.0 |
| A | 4 | 95 | 2911600 | 14849.65 | 785 | 767 | 196.0 |
| A | 8 | 249 | 607689 | 3096.22 | 785 | 767 | 196.0 |
| B | 10 | 254 | 4253278 | 16915.18 | 1180 | 1136 | 251.4 |
| B | 15 | 20 | 3837878 | 15262.71 | 1180 | 1136 | 251.4 |
| B | 5 | 172 | 226839 | 897.85 | 1180 | 1136 | 251.4 |
| C | 15 | 224 | 7876129 | 27489.82 | 1043 | 1035 | 286.5 |
| C | 1 | 241 | 2965769 | 10349.08 | 1043 | 1035 | 286.5 |
| C | 13 | 3 | 578343 | 2015.23 | 1043 | 1035 | 286.5 |
| D | 8 | 176 | 3711975 | 11051.46 | 1151 | 1098 | 335.8 |
| D | 12 | 34 | 3544563 | 10552.89 | 1151 | 1098 | 335.8 |
| D | 10 | 172 | 1014775 | 3018.86 | 1151 | 1098 | 335.8 |
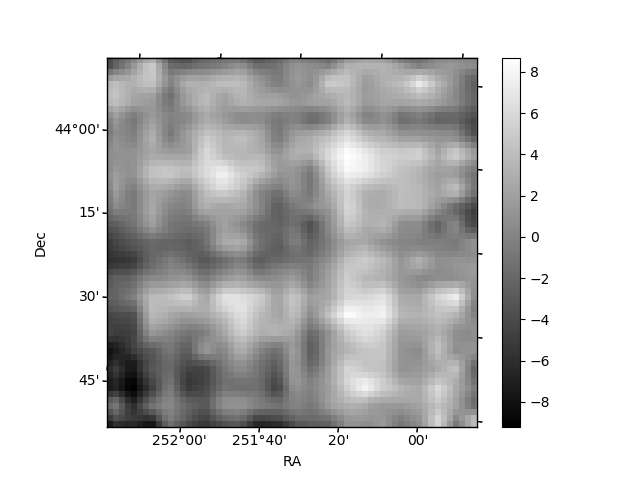
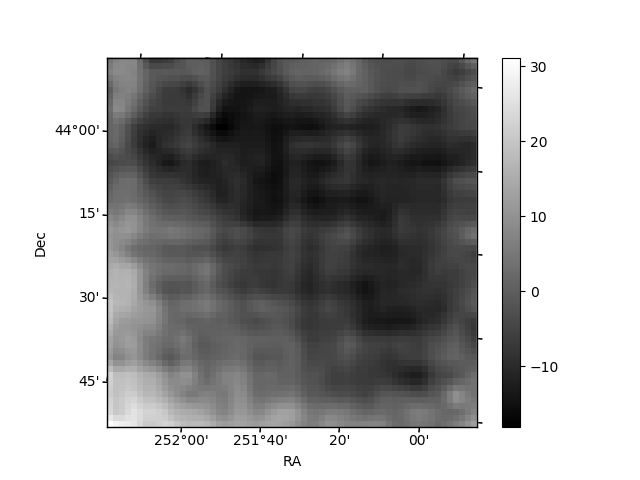
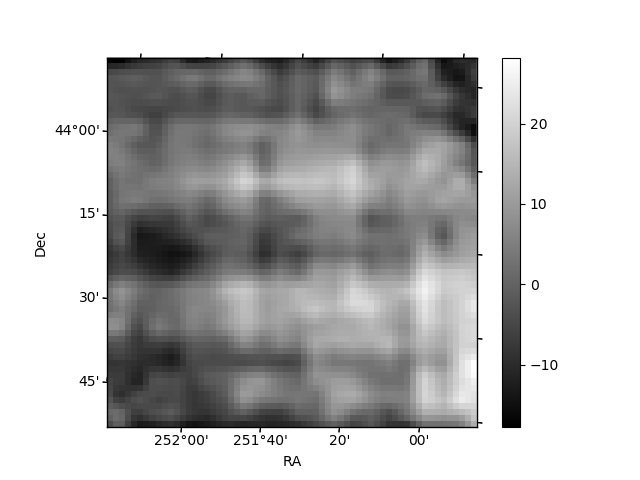
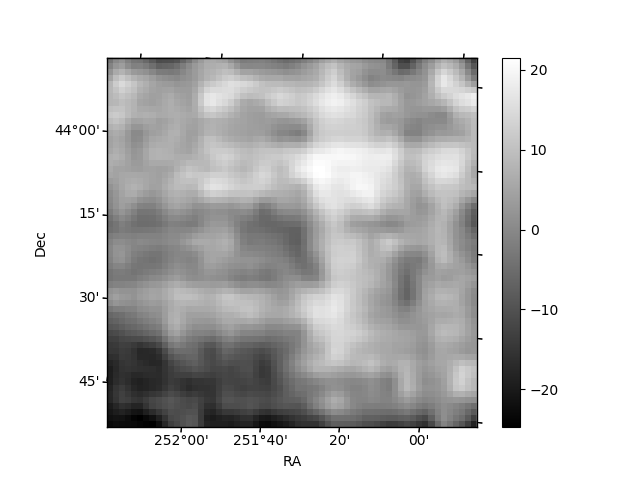
Histogram calculated using DETX and DETY for each event in the final _common_clean file
| Quadrant A | 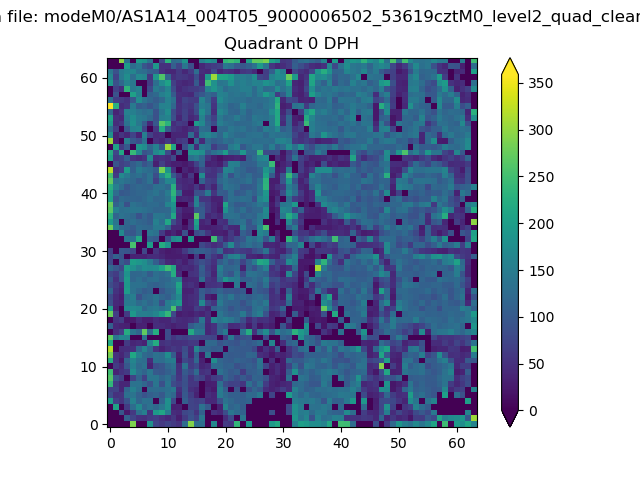 |
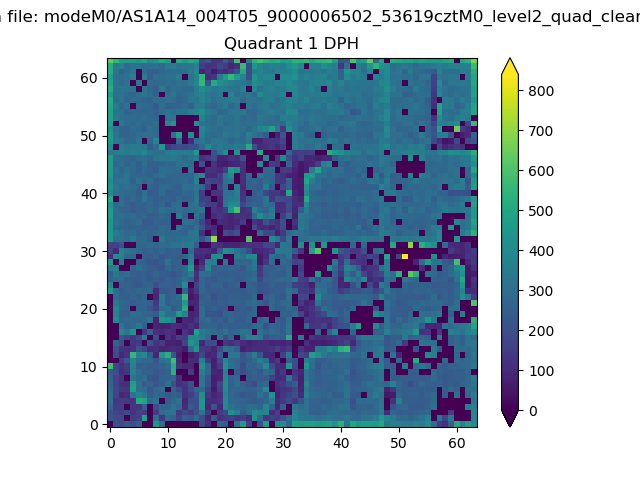 |
Quadrant B |
|---|---|---|---|
| Quadrant D | 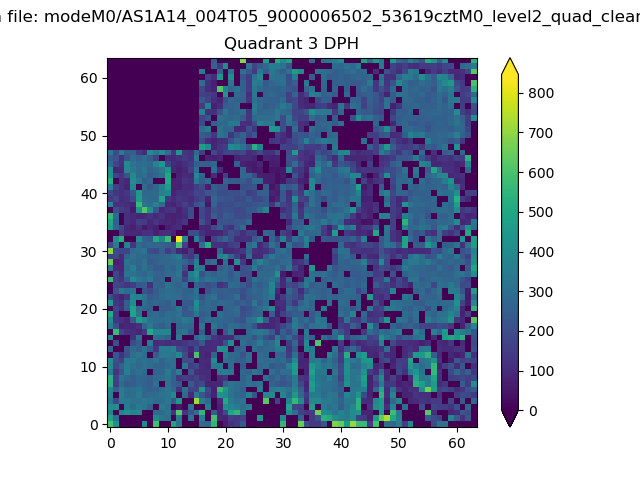 |
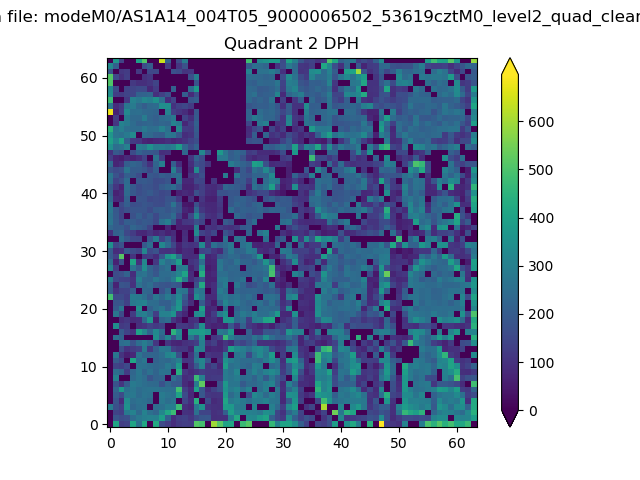 |
Quadrant C |
| Plot type | Count rate plots | Images |
|---|---|---|
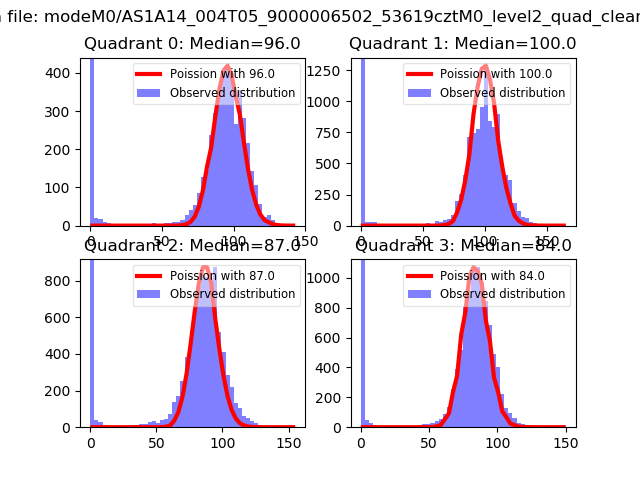
| Comparison with Poisson distribution Blue bars denote a histogram of data divided into 1 sec bins. Red curve is a Poisson curve with rate = median count rate of data. |
 |
 |
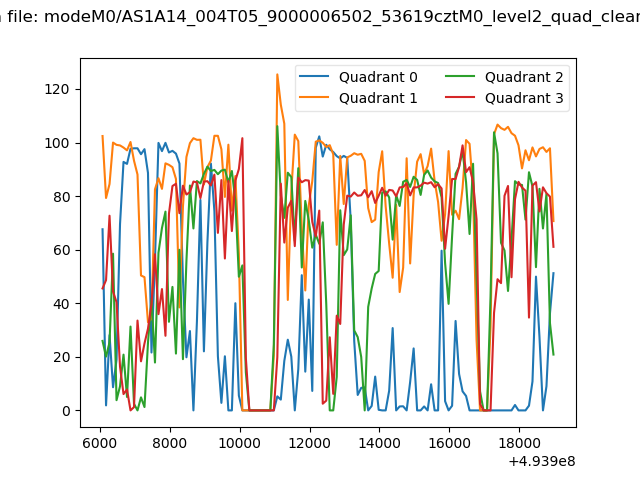
| Quadrant-wise count rates Data is divided into 100 sec bins |
 |
|
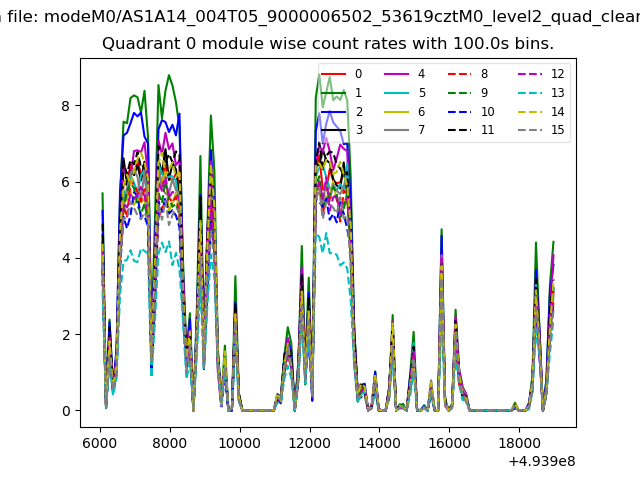
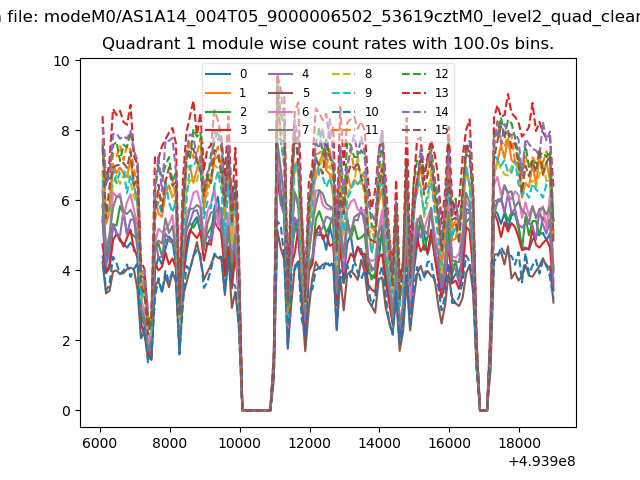
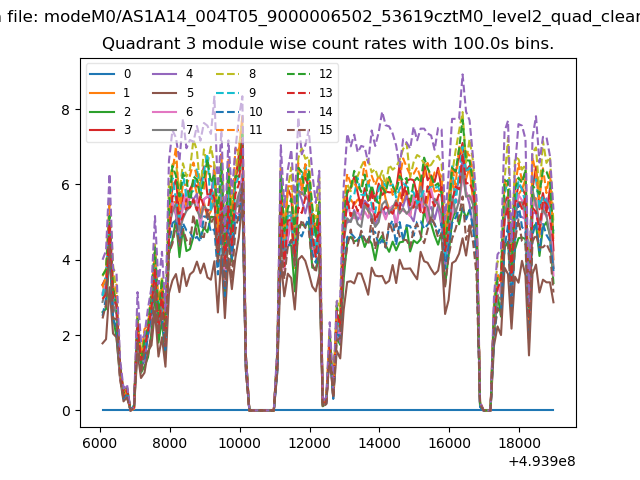
| Module-wise count rates for Quadrant A Data is divided into 100 sec bins |
 |
 |
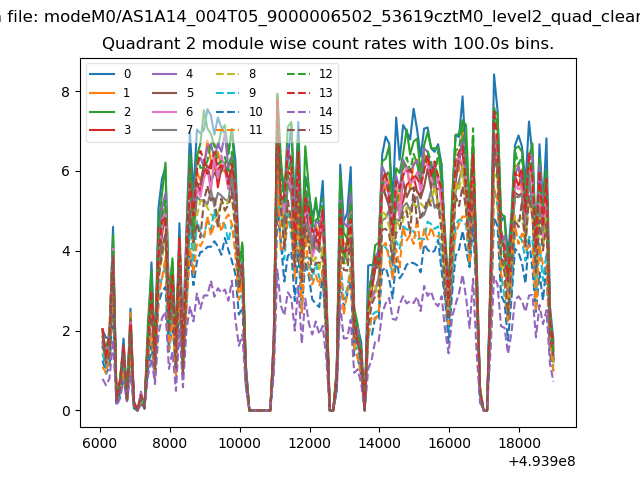
| Module-wise count rates for Quadrant B Data is divided into 100 sec bins |
 |
 |
| Module-wise count rates for Quadrant C Data is divided into 100 sec bins |
 |
 |
| Module-wise count rates for Quadrant D Data is divided into 100 sec bins |
 |
 |
| Parameter | Plot |
|---|---|
| CZT HV Monitor | 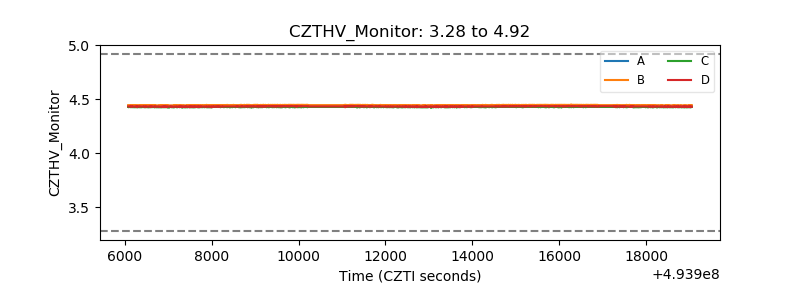 |
| D_VDD | 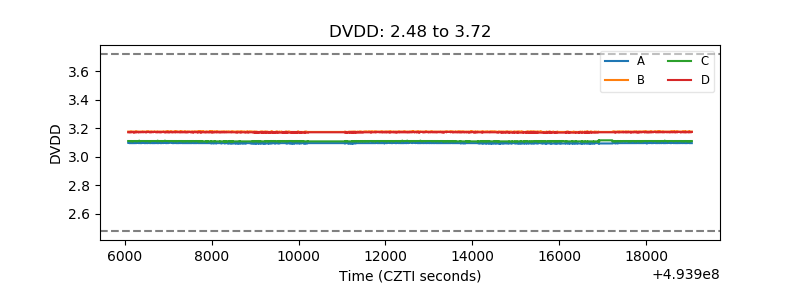 |
| Temperature 1 | 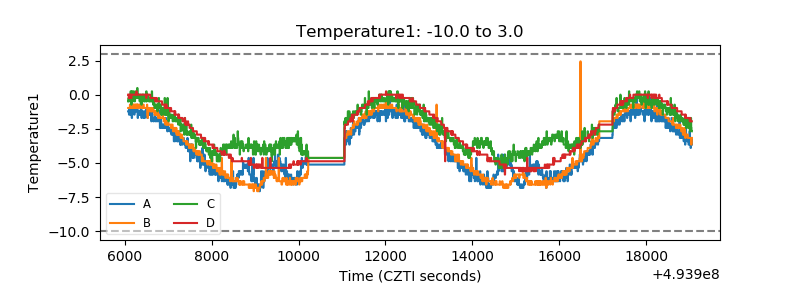 |
| Veto HV Monitor | 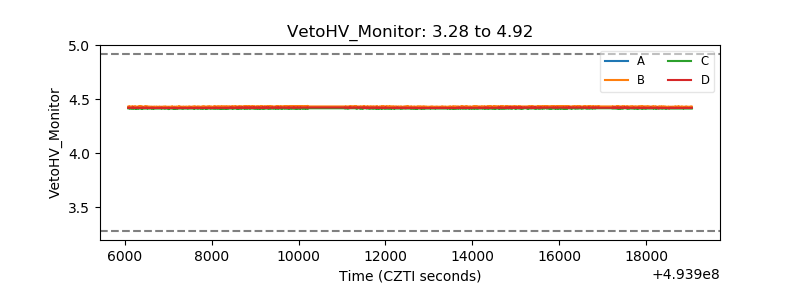 |
| Veto LLD | 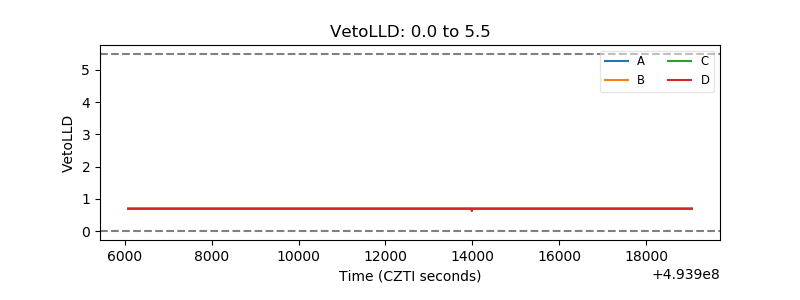 |
| Alpha Counter | 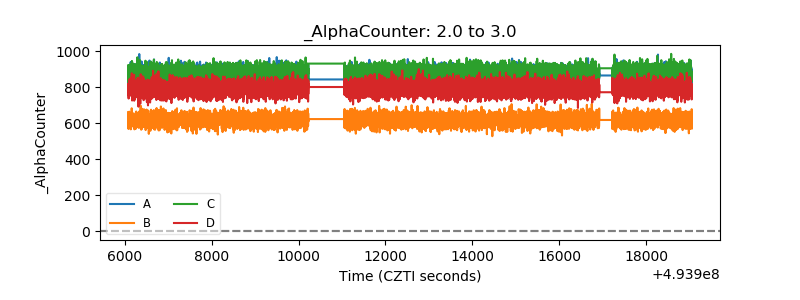 |
| _CPM_Rate | 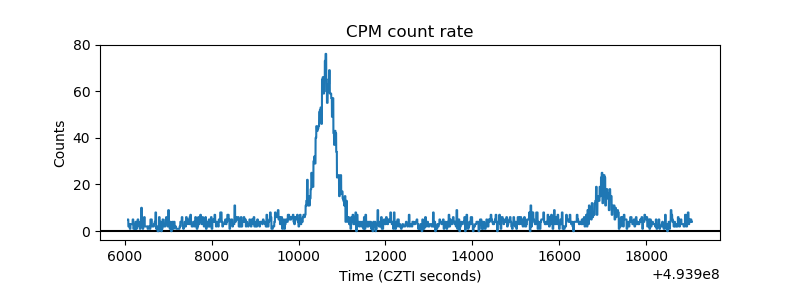 |
| CZT Counter | 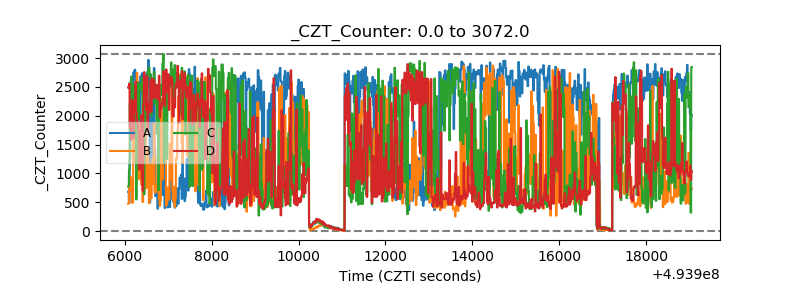 |
| +2.5 Volts monitor |  |
| +5 Volts monitor |  |
| _ROLL_ROT | 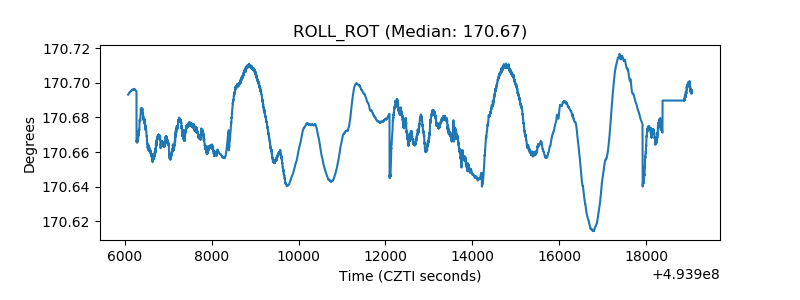 |
| _Roll_DEC | 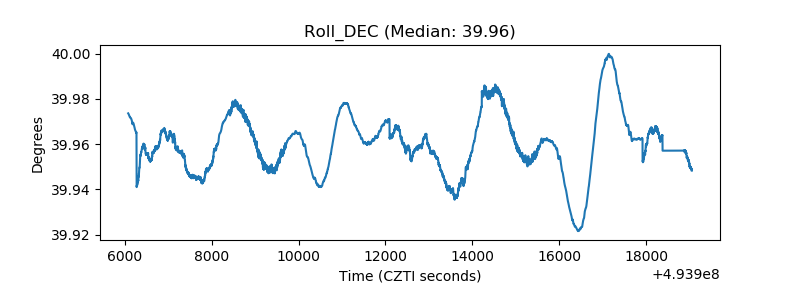 |
| _Roll_RA | 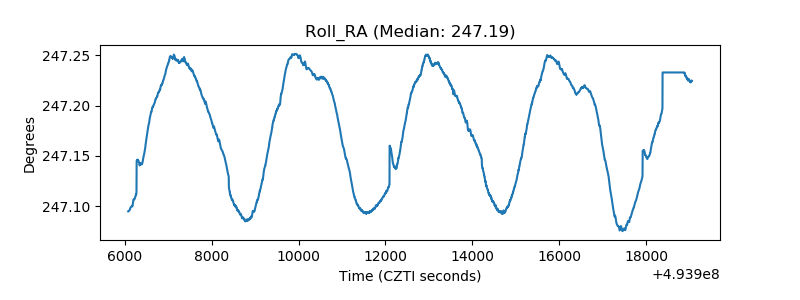 |
| Veto Counter | 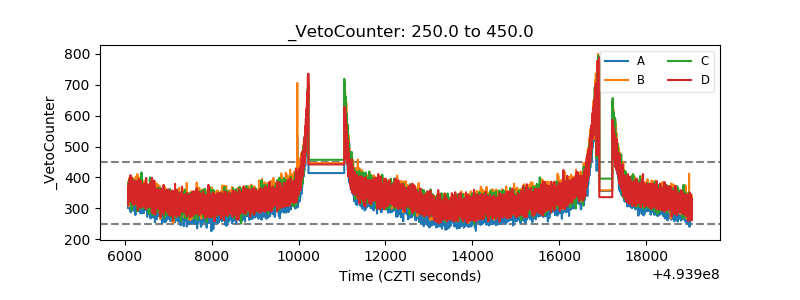 |